Implementation of Value Stream Mapping to Reduce
Waste at Buffing Panel UP PT. Yamaha Indonesia
Renty Anugerah Mahaji Puteri
#, Zanurip
##Industrial Engineering, University of Muhammadiyah Jakarta Jl. Cempaka Putih Tengah 27 Jakarta
1
Abstract — PT Yamaha Indonesia (YI), established in 1970, is one company that is engaged in the manufacture and assembly of piano. As one branch of Yamaha Corporation Japan Company, PT Yamaha Indonesia is required to compete with other branches and subsidiary companies with brands other than Yamaha piano in the world. With the increasing demand for piano, PT YI always trying to improve productivity so that the resulting output can meet the demand. However, problems occurred in the PT YI especially in parts of the buffing Panel upright piano (up) is still a waste that occurs in the production process it is characterized by the presence of a number of non-value added activity caused by transport and unnecessary movement and the presence of inventory which is not in accordance with the requirements. Value Stream Mapping is a tool used in this research. Results after the VSM 140 Pcs inventory, lead time 0.74 day, standard time 53.8, defect 3.19, productivity 1.96 and efficiency 47 %..
Keywords
—
Defect, Lead Time, Productivity, Value Stream Mapping, WasteI. INTRODUCTION
Along with the economic conditions which can not be ensured and a tight competition in world trading, every company should strive to anticipate a condition or circumstances that may threaten the company. The increase in workers wage for example, may force the company to spend more fee. However, problems arise when this cost increases are not offset by the increase in the company‘s productivity thus reducing profits. To be able to survive in the midst of these conditions, every company should have a competitive advantage to win the competition. Therefore, the company should always make a continuous improvement in every process in order to achieve optimal levels of productivity.
A. The aim of this research are :
Based on the formulation of the problems, research purposes can be determined as:
Achieving a short lead time (waiting time) of its prior condition by decreasing the Inventory/Stock (work in process) on the buffing panel UP.
Identifying waste and analyze its causes. Give suggestion to increase efficiency.
II. LITERATURE
Value stream mapping is a lean-management method for analyzing the current state and designing a future state for the series of events that take a product or service from its beginning through to the customer. At Toyota, it is known as "material and information flow mapping".
Value stream mapping is a lean manufacturing or lean enterprise technique used to document, analyse and improve the flow of information or materials required to produce a product or service for a customer . It differs from the process mapping of Six Sigma in four ways :
It gathers and displays a far broader range of information than a typical process map.
It tends to be a higher level than many process maps. It tends to be used at a broader level, i.e from receiving of
raw material to delivery of finished goods.
It tends to be used to identify where to focus future project and or kaizen events.
Seven waste by Shigeo Shingo Waste from overproduction
1. To produce sooner, faster or in greater quantities than the absolute customer demand
2. Manufacturing too much, too early or ―Just in Case‖
3. Overproduction discourages a smooth flow of goods or services
4. Takes the focus away from what the customer really wants
5. Leads to excessive inventory Caused by:
a. MRP push rather than kanban pull b. Large batch sizes
c. Looks better to be busy d. Poor people utilization e. Lack of customer focus Why one of the 7 wastes ?: a. Costs money
b. Consumes resource ahead of plan c. Creates inventory
d. Hides inventory/defect problems e. Space utilization
Excess Transportation
2. Complex material flow paths 3. Poor close coupling
4. Wasted floor space
5. Unnecessary material handling 6. Potential damage to products
Caused by:
a. Badly designed process/cell b. Poor value stream flow c. Complex material flows d. Sharing of equipment Why one of the 7 Wastes ?: a. Increases production time
b. It consumes resource & floorspace c. Poor communication
d. Increases work in progress e. Potential damage to products f.Excess Inventory
Any raw material, work in progress (WIP) or finished goods which are not having
value added to them Caused by:
a. Production schedule not level b. Inaccurate forecasting c. Excessive downtime/set up d. Push instead of pull e. Large batching f. Unreliable suppliers Why one of the 7 Wastes ?: a. Adds cost
b. Extra storage space required c. Extra resource to manage d. Hides shortages & defects e. Can become damaged f. Shelf life expires Waiting Time
1. People or parts that wait for a work cycle to be completed
2. Where are the bottlenecks?
3. What are the major causes of lost machine availability? 4. What are we doing to improve machine availability? 5. Do people wait on machinery?
Caused by:
a. Shortages & unreliable supply chain b. Lack of multi-skilling/flexibility c. Downtime/Breakdown
d. Ineffective production planning e. Quality,design,engineering Issues f. ‗Black art‘ processes
Why one of the 7 Wastes ?: a. Stop/start production b. Poor workflow continuity c. Causes bottlenecks d. Long lead times e. Failed delivery dates Processing Waste
Processing beyond the standard required by the customer
By improving processing efficiency we ultimately use less resource to achieve the same customer satisfaction
Caused by:
a. Out of date standards
b. Attitude - ‗Always done it like this‘ c. Not understanding the process d. Lack of innovation & improvement e. Lack of standard operation procedures Why one of the 7 Wastes ?:
a.It consumes resource b.It increases production time
c.It‘s work above and beyond specification d.Can reduce life of component
Wasted Motion 1.Adds cost
2.Motion is the movement of ―man‖
3.Waste motion occurs when individuals move more than is necessary for the process to be completed
Caused by:
a. No standard operating procedure b. Poor housekeeping
c. Badly designed cell d. Inadequate training Why one of the 7 Wastes ?: a. It interrupts production flow b. Increases production time c. Can cause injury
Waste from Production Defects
1. A defect is a component which the customer would deem unacceptable to pass the quality standard 2. Defects reduce or discourage customer satisfaction 3. Defects have to be rectified
4. Rectification costs money with regard to time effort and materials
5. Defects in the field will lose customers 6. Right first time is the key
Caused by:
a. Out of control/Incapable processes b. Lack of skill, training & on the job support c. Inaccurate design & engineering
d. Machine inaccuracy e. Black art processes Why one of the 7 Wastes ?: a. Adds costs
b. It interrupts the scheduled c. It consumes resources d. It creates paper work
e. Reduces customer confidence
III.METHODS
and retrieving the data after the VSM, then analyzing the final result after the VSM, where the results should provide a benefits for the company.
IV. RESULT
A. Pre-Inventory before VSM
Inventory in WIP calculation is performed three times. This process is taken at each flow process: inventory before the process, while the process, and after the process. From the inventory process, will get the amount of lead time at the moment, as well as the parts that have bottle neck.
TABLE I INVENTORY CALCULATION
No Process Name
Cabinet Name
Inventory Average Max
1 2 3
Total Inventory 232
Lead Time 1,23
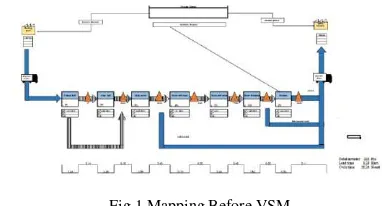
In the calculation of inventory at the end of September 2014 at Buffing Panel UP PT. YI, the average inventory results are 232 Pcs. High polish process is a process with the highest lead time by 0:43 lead time throughout the day for a production capacity of 188 Pcs / day . Buffing mapping process before VSM panel these things:
1. The highest cycle time value are in the ryoto process by 14,86 minutes.
2. The highest lead time are in the high polish by 0,43 days. 3. Total cycle time 20,23 minutes.
4. Production demand 188 Pcs / day.
5. Total lead time 1,23 days and total inventory 232 Pcs. 6. Time between next operation 567,66 minute
B. Mapping Before VSM
Fig.1 Mapping Before VSM
C. Defect Calculation Before VSM
Results of calculation section buffing panel defect UP before VSM implemented is quite high , which is need to be removed in order to increase the productivity section buffing UP panel . The following data defect before VSM implemented. The details as follows
Defect surface 94 Pcs (2,3%) Defect edge 51 Pcs (1,2%) Defect other side 12 Pcs(0,3%) Broken 62 Pcs (1,6%)
Defect Patern 4 Pcs (0,1%) Total defect 223 Pcs (5,41%)
The defect is caused by defect surface 94 Pcs equals 2.3 % of the total amount of production produced for 1 month . So that need another action which can decrease that defect
D. Waste Analysis Before VSM
We observed, analysed and recorded the waste of buffing panel UP, that is suspected as a cause of accumulated inventory and long- lead time and productivity is not good enough.
E. Proposed Improvements to Eliminate Waste
Proposed improvement through analysis and corrective actions carried out so that waste can be eliminated , the following steps are performed :
Looking at the causes of waste Designing corrective action Perform the corrective action Socialize corrective action
Evaluate the results of corrective actions
There are 7 improvements that have been done so that waste can be eliminated so that the inventory / stock decline and lead time ( waiting time ) shorter , these improvements include:
Conduct periodic repair jig , jig so that the conditions are always in good condition .
Making potential mapping Not Good ( NG ) high. Re-lay out the machine prior to its high polish that far
apart between high polish
Move the spot checks in accordance cabinet order process end there is no wastage of steps.
Provide training to its special operators to new employees. Change the way the process can be stiffened once the
process does not need to double the order for the process to be faster.
F. Inventory Calculation After VSM
In the calculation of inventory in WIP performed three times . The calculation process is taken at each flow process, inventory prior to the process , while the process and after the process . The inventory will get the amount of lead time that occurs at this time , following the inventory after the VSM .
TABLE II
INVENTORY CALCULATION AFTER VSM
N
Inventory Average Max
1 2 3
Total Inventory 140
Lead Time 0,79
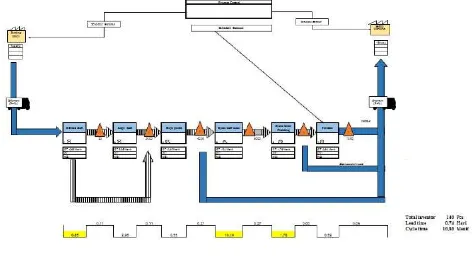
Inventory calculation results obtained after VSM 140 Pcs with lead times of 0.79 days , while the inventory calculation results obtained before VSM 232 pcs with a lead time of 1.23 days , so there was a decrease in Inventory 92 pcs and lead time of 0.44 days due to repairs -Fixes performed after VSM that affect the decline in inventory / stock so that the inventory / stock and lead time ( waiting time ) in the UP panel buffing reduced.
Lead time value is highest in the Ryoto 0.26 days The total cycle time 16.86 minutes
Request for the production of 177 Pcs / da
Total Lead time is 0.79 days and the total Inventory 140 Pcs
Time Between Operation Next , is the time it reached from one work station to work station after VSM
1. 8 Head buff : 20/177 = 0.11 days = 50.6 minutes 2. Edge buff : 20/177 = 0.11 days = 50.6 minutes 3. High polish : 40/177 = 0.22 minutes = 103.95
minutes
4. Ryoto : 50/177 = 0.28 minutes = 129.94 minutes 5. Polyser : 10/177 = 0.05 days = 23 minutes
The calculation result of inventory and lead time in getting 140/177 = 0.79 days = 363.84 minutes
G. Defect Calculation after VSM
Results of calculation section buffing panel defect UP after VSM implemented gone down after the repair , where it is necessary in order to maintain increased productivity in buffing panel with data
From the calculation of defect after buffing panel VSM in the UP obtained the following percentages :
Defect surface before VSM percentage of 2.3% to 94 pcs VSM findings after work and handling of the material or the surface of the cabinet so that defect can be scaled . Defect edge before VSM percentage of 1.4% to 51 Pcs its
Defect other side percentage before and after the VSM VSM is still the same 0.3 % by the number of 12 findings but will need no special snacks that defect other side can be removed.
Broken percentage before VSM 1.6 % to 62 Pcs its findings after VSM percentage fell to 0.2 % with 10 findings , so there was a decrease of 1.4 % with 10 Pcs findings
Defect pattern percentage before and after the VSM is still the same because the same percentage of its findings with the findings of its 0.1 % 4 Pcs cabinet , but need to keep the defect pattern no longer exists.
H. Efficiency Calculations After VSM
Efficiency calculations after VSM conducted to determine the ability of any part of the panel buffing UP in providing products after some improvement. Efficiency results obtained by comparing the output to the input, the following is the calculation of the efficiency Buffing UP panel in December 2014:
Efficiency = TR (time required) / TA (time available) = (48420/102700) * 100 = 47%
TABLE III
THE RESULT OF THE COMPARISON BEFORE AND AFTER VSM
No Item Before After Result Percentage 1 Inventory 232 140 Decrease 40% 2 Lead Time 1,23 0,79 Decrease 36% 3 Standard
Time
57,44 53,8 Decrease 6%
4 Defect 5,41 3,19 Decrease 41% 5 Productivity 1,87 1,96 Increase 5% 6 Efficiency 45% 47% Increase 4%
V. CONCLUSION
Conclusion of the research in the buffing process the panel are:
Results of inventory before and after the VSM implemented namely Inventory decreased from 232 pcs to 140 pcs its percentage decline of 40%. and Lead Time at the UP panel buffing decreased from 1.23 days to 0.79 day.
The identification of waste obtained 8 waste that occurs in the buffing panel among other things: Waste of Overproduction, Time Waits, Transportation, Processes, Waste of Inventory Excess, Waste of unnecessary Motion, and also defect.
Do KAIZEN / continous improvement consistently.
REFERENCES
[1] FAMD.. Value Stream Mapping. Jakarta : Penerbit Matsushita Gobel Inst, 2008
[2] Liker K. J. The Toyota Way. Jakarta : Penerbit Erlangga, 2004. [3] Rangkuti F. Manajemen Persediaan . Jakarta : Penerbit Raja Grafindo
Persada, 2007.
[4] Sutalaksana, I.Z., dkk. Teknik Tata Cara Kerja, Laboratorium Tata Cara Kerja & Ergonomi, Departemen Teknik Industri – ITB, 1979. [5] Wignjosoebroto, Sritomo. Ergonomi: Studi Gerak dan Waktu, Institut