REPÚBLICA DEMOCRÁTICA DE TIMOR-LESTE
Book 1
Page | 1
Contents
Part 1: Speech of the Prime Minister ... 3
Part 2: Description and Analysis of the State Budget ... 4
2.1: Executive Summary ... 4
2.2: Recent Reforms in Economic and Financial Management ... 7
2.3: Economic Overview ... 10
2.4: Millennium Development Goals ... 21
. : E pe ditu e a d De elop e t Pa t e s Co it e ts ... 24
2.6: Revenues ... 37
2.7: Financing ... 55
Part 3: General State Budget Law Text... 66
Part 4: Supporting Documentation
……….
4.1: Justification for Transfer from the Petroleum Fund ... 1104.2: ESI Report 1: Requirement for Transfers from the Petroleum Fund for 2015 ESI ... 111
4.3: ESI Report 2: Requirement for Transfers from the Petroleum Fund for medium term ESI... 113
Page | 2
CPLP Comunidade dos Países de Língua Portuguesa DHS Demographic Health Survey
HCDF Human Capital Development Fund IAB Investment Advisory Board
IBRD International Bank for Reconstruction and Development IDA International Development Association
SEAPRI Secretary of State for the Promotion and Support of the Private Sector SEPFOPE Secretary of State for Professional Training and Employment Policy SERVE Serviço Registro Verificação Empresarial
SISKA Integrated Community Health Services SDP Timor-Leste Strategic Development Plan TLSLS Timor-Leste Standard of Living Survey UNTL U i e sidade Na io al Ti o Lo osa e
WB World Bank
Page | 3
Part 1: Speech of the Prime Minister
Page | 4
Part 2: Description and Analysis of the State
Budget
2.1: Executive Summary
Government Policy
The SDP describes how Timor-Leste will be transformed into an upper-middle income country with an educated, healthy and secure population by 2030. The Program of the Fifth Constitutional Government outlines detailed activities and policies to achieve this vision. This 2015 State Budget appropriates expenditures to finance these activities and policies.
Economic Growth
Strong, high quality non-petroleum GDP growth is required for Timor-Leste to become an upper-middle income country by 2030. From 2007 to 2011 the Government implemented economic policies that led to very high rates of economic growth; with non-petroleum GDP growth averaging 12.5% per annum during this period. This growth was driven by increases in Government spending and was accompanied by relatively high inflation. In 2012 non-petroleum GDP growth slowed to 7.8% and was not driven by Government expenditure. This marked the first stage in the transition to higher quality, sustainable, low inflation, private sector driven economic growth.
In 2013 the transition to higher quality economic growth continued. Non-petroleum GDP is forecast to grow strongly at 5.6%, 7.1% and 7.0% in 2013, 2014 and 2015 respectively. These rates of economic growth are high compared to many other countries. This new growth path is consistent with slower, sustainable growth in Government spending and inflation which is within or below the SDP target range of 4.0%-6.0%. Private sector investment and household consumption will drive economic growth going forward. Higher household consumption will likely contribute to a sustainable and sustained rise in living standards.
Expenditure
The 2015 State Budget is $1,500.0 million (excluding loans), which is just 2.1% higher than in 2014 (see table 2.1.1). The Government has stabilized expenditures in 2015 to ensure fiscal sustainability and that demand in the economy is consistent with inflation within or below the SDP target range.
Page | 5
withdrawals will sharply fall. Over the long-term (after 2019) expenditure will further fall and domestic revenue will increase, allowing excess withdrawals to fall towards zero.
Domestic Revenue
Domestic revenue is forecasted to continue to increase in 2015 and over the medium term (see table 2.1.1). The rate of growth is slightly lower than in past years, principally due to smaller revenue from rice sales. The Government is scaling back rice sales in response to the improved supply of rice. Excluding rice sales, domestic revenue is forecasted to grow at 5.6% in 2015.
Financing
The non-oil deficit is equal to domestic revenue minus expenditure (see table 2.1.1). This deficit provides an approximate estimate of the amount of additional demand and money Government spending is contributing to the economy. Over the medium term the non-oil deficit is falling as a percentage of GDP. This lower contribution to demand in the economy from Government spending is consistent with lower inflation and private sector driven economic growth.
The Government is using the ESI, excess withdrawals from the PF, use of the cash balance and loans to finance the non-oil deficit in 2015.
The ESI for 2015 is calculated at $638.5 million and can be thought of as the amount that can be withdrawn from the PF, each year, forever without the fund ever running out of money. The total amount budgeted to be withdrawn from the PF in 2015 is $1,327.5 million; this is higher than the ESI by $689.0 million. The Government considers that excess withdrawals are necessary in the short term to finance priority expenditures. From 2018 excess withdrawals are expected to fall towards zero as domestic revenue increases and expenditure decreases.
The Government is using the cash balance in the HCDF in 2015 to finance rolled over expenditures. This is in line with the relevant laws and international best practice in PFM. Total use of the cash balance for 2015 is $2.1 million.
Page | 6
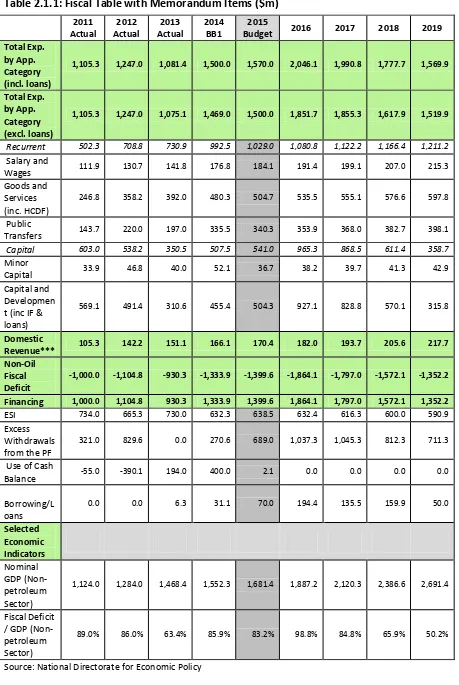
Table 2.1.1: Fiscal Table with Memorandum Items ($m)
Page | 7
2.2: Recent Reforms in Economic and Financial
Management
2.2.1: Overview
The MoF has implemented a significant reform program over the last year. Reforms have been concentrated in the areas of economic monitoring, PFM and performance management.
2.2.2: Economic Monitoring
Formulating effective public policies requires a detailed and up-to-date understanding of the economy. The MoF has started drafting quarterly inflations reviews and GFS bulletins to better understand the economy. It has also strengthened its economic forecasting model.
2.2.2.1: Quarterly Inflation Reports
The MoF drafts quarterly inflation reviews to analyse inflation. These reviews analyse trends in the monthly and yearly rates of inflation, and in the underlying categories of the CPI index such as food and transport. The likely causes of inflation, such as changes in Government spending, in exchange rates and in international commodity prices, are also analysed in these quarterly reviews.
The quarterly inflation bulletins for Q1 2014 and Q2 2014 were recently published on the MoFs e site. Going forward each review will be published shortly after the relevant data becomes available.
2.2.2.2: Government Financial Statistics
GFS is an internationally recognised reporting framework for the presentation and analysis of fiscal data. The Government has recently implemented this framework and now publishes GFS fiscal bulletins every quarter. The implementation of GFS in Timor-Leste has two main benefits.
First, GFS provides an internationally recognised and consistent framework for analysing the fiscal position of the government. The GFS bulletins provide important information on how petroleum revenues and PF investments affect the overall fiscal position of the Government.
Page | 8 2.2.2.3 Economic Forecasting
The MoF recently completed new forecasts of economic growth and inflation. These forecasts were made based on an improved economic model and forecasting process. Important reforms to the modelling process included: forecasting the components of non-petroleum GDP, modelling inflation and ensuring internal consistency.
Forecasting the components of non-petroleum GDP; in the past non-petroleum GDP, but not its underlying components, were forecasted. This year the MoF has forecasted all the underlying components of non-petroleum GDP such as household consumption and private investment. This strengthens economic policy making as the composition of economic growth, and not just its overall level, is important.
Forecasting inflation; the MoF improved the methodology it uses to forecast inflation. The new methodology uses advanced statistical techniques to account for the impact on inflation of Government spending, international commodity prices and exchange rates.
Internal Consistency; in Timor-Leste Government spending, economic growth and inflation are all interlinked. Specifically:
Government spending is a component of non-petroleum GDP. So all else being equal high expenditure will lead to higher economic growth.
Inflation is partly driven by Government recurrent expenditure. Thus all else being equal high expenditure will result in higher inflation.
High inflation may reduce long-term economic growth if it undermines competiveness. Overall these reforms have resulted in superior economic forecasts that have assisted the MoF in better understanding recent and likely future economic developments.
2.2.3: Public Financial Management
The Government spends, collects and manages money through its PFM system. This system is made up of the laws, institutions and information technology infrastructure that govern the management of the public finances. An effective and efficient PFM system is essential for constraining corruption and delivering public services.
Since 2008 the Government has implemented a broad ranging PFM reform program. Other publically available documents such as the MoFs “t ategi Pla a d the State Budget Book1 2013 describe this reform program in detail. This section only outlines key PFM reforms which have been implemented this year. Key reforms include:
Page | 9
use the IFMIS through the internet which has improved accessibility. The new interface also has a clearer, more intuitive and user-friendly lay out.
Making the use of the procurement and contract management modules in IFMIS mandatory. This means that ministries have to record key stages of the procurement process and contracts on the IFMIS before payments are made to contractors. This constrains corruption and encourages line ministries to follow the correct processes.
Improving tax administration by re-registering many tax payers with new unique tax identification numbers.
Establishing a monthly meeting to discuss and resolve problems in budget execution. The meeting is chaired by the Director General of State Finance and is attended by staff from the MoF and the Directors of Finance from each line ministry. This meeting has contributed to higher and more efficient budget execution.
2.2.4
: Measuring Performance
The Government has recently implemented reforms to monitor and improve performance. Key reforms include the Ten Commandments and introducing KPIs.
2.2.4.1: The Ten Commandments to Improve the Performance of the State
The Government met from the 4th to the 6th of August 2014 to discuss how to identify problems and find solutions to improve the performance of the state. Based on these discussions, participants committed to ten commandments. The full list of commandments is available on the MoF website. Three key commandments are:
1. To implement one Vision, one Plan, one Action, aligned with the SDP matrix and to commit to the KPIs as a performance measure.
2. To find out and obtain the necessary information about the existing PFM system before publicly commenting on this system.
3. The national private sector commits to work together with the Government in order to ensure the quality of projects.
These commandments should contribute to more effective Government administration.
2.2.4.2: Key Performance Indicators
The MoF has recently developed KPIs. These indicators measure progress towards important objectives for each directorate in the MoF.
Page | 10
The EU and Australian Government recently showed their confidence in the KPI system for measuring performance by agreeing to provide direct budgetary support to the MoF. This support uses the Government of Timor-Leste s pu li fi a ial a age e t system and therefore conforms to new deal principles.
Overall the KPIs are an important management tool. These indicators have linked the MoFs vision to specific activities, strengthened budgeting and improved human resource management.
In conclusion, the MoF has implemented reforms to strengthen economic monitoring, public financial management and performance management. These reforms should assist the development of more effective economic policies and contribute to more efficient public spending.
2.3: Economic Overview
2.3.1: International Economy
2.3.1.1: Trends in International Growth
The global economic growth rate slowed from 3.2% to 3.0% from 2012 to 2013. Growth in the emerging market and developing economies slowed from 5.0% in 2012 to 4.7% in 2013, while over the same period growth in the advanced economies slowed from 1.4% to 1.3%. Despite less favourable financial conditions emerging market and developing economies continue to drive global growth.
Page | 11
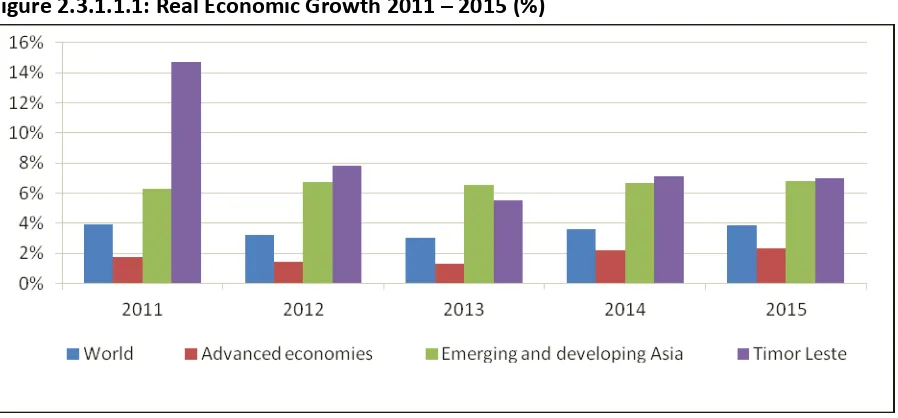
Figure 2.3.1.1.1: Real Economic Growth 2011 – 2015 (%)
Source: IMF, World Economic Outlook Database, April 2014
Emerging and developing Asia is one of the high growth areas in the world (see figure 2.3.1.1.1) and Timor-Leste is performing particularly well within this group of economies. The increased demand for goods and services associated with the strong growth outlook in Asian markets represents an important export opportunity for Timor-Leste.
Table 2.3.1.1.1: Real Regional Growth Rate (%)
Country Actual Projection
2012 2013 2014 2015
ASEAN-5 6.2% 5.2% 4.9% 5.4%
Australia 3.6% 2.4% 2.6% 2.7%
China 7.7% 7.7% 7.5% 7.3%
Indonesia 6.3% 5.8% 5.4% 5.8%
Malaysia 5.6% 4.7% 5.2% 5.0%
Philippines 6.8% 7.2% 6.5% 6.5%
Singapore 1.9% 4.1% 3.6% 3.6%
Thailand 6.5% 2.9% 2.5% 3.8%
Vietnam 5.2% 5.4% 5.6% 5.7%
Timor Leste* 7.8% 5.6%** 7.1% 7.0%
Sources: Timor-Leste's National Accounts 2000-2012, National Directorate of Economic Policy (Timor-Leste) and International Monetary Fund, World Economic Outlook Database, April 2014
*Timor-Leste s GDP efe s to the o -petroleum sector only **Projection
2.3.1.2: Trends in International Prices
Page | 12
Agricultural Commodity Prices
Imported food represents a significant proportion of the food consumed in Timor-Leste. Thus changes in international agricultural commodity prices can have a large effect on both the rate of inflation and standard of living in Timor-Leste. The FAO index, which consists of the weighted average of five key food commodity price indices, has been relatively stable since the third quarter of 2012. International crop and meat prices are expected to decrease over the medium-term, this will reduce inflationary pressure in Timor-Leste.
Coffee is Timor-Lestes second largest export (after oil) and this sector has been identified as one with significant potential for growth. After considerable fluctuations in the price of coffee in recent years, the outlook for international coffee prices is stable.
Oil Price
Compared to the large fluctuations in oil prices over the 2010-2012 period, oil prices in 2014 have been relatively stable. After increasing by 1.0% in 2012 international oil prices1 decreased by 0.9% in 2013 to $104.07 per barrel. This decrease was the result of continued supply growth in North America, and would have been more significant if not for supply disruptions in the Middle East. Projections suggest that international oil prices will remain stable in 2014, growing by 0.1%, and then fall sharply in 2015 by 6.0%, driven by increased supply from North America and slow global demand growth. Changes in international oil prices have a significant effect on the Timorese economy as they affect both the value of petroleum revenues and the cost of imported petroleum for businesses and consumers.
Exchange Rates
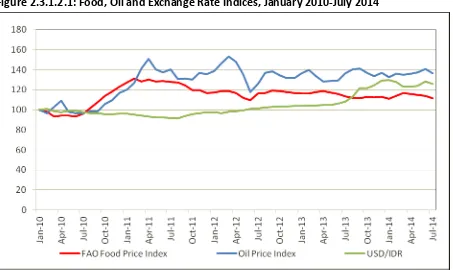
Recently there has been a general appreciation of the US dollar against the currencies of Timor-Leste s ajo trading partners. In particular, the US dollar appreciated by 16.4% against the Indonesian rupiah, from July 2013 to July 2014, see figure 2.3.1.2.1. The appreciation of the US dollar against the currencies of Timor-Leste s ajo t adi g pa t e s may have made Timorese exports more expensive on international markets, constraining the development of export sectors. However, consumers across the country will benefit from the lower rates of inflation associated with cheaper imports.
1
Page | 13
Figure 2.3.1.2.1: Food, Oil and Exchange Rate Indices, January 2010-July 2014
Source: FAO Food Price Index and IMF Primary Commodity Prices
2.3.2: Domestic Economy
This section first reviews economic performance from 2007 to 2012. It then discusses economic projections for 2013 to 2015.
2.3.2.1: Review of Economic Performance 2007-2012
2.3.2.1.1 Total Gross Domestic Product
In 2012 the total GDP in Timor-Leste increased by 5.6% to $4,889.6 million (in constant 2010 prices). The petroleum sector, which grew by 4.9% in 2012, remains the dominant sector in the Timorese economy and contributes 76.4% of total GDP. In recent years the dominance of the petroleum sector has decreased, driven by a slowdown in petroleum sector growth and exceptionally high non-petroleum GDP growth (see table 2.3.2.1.1.1 and figure 2.3.2.1.1.1). Many economies which are dominated by a single resource extraction sector
ha e falle i ti to a esou e u se , ho e e , th ough p ude t poli aki g Ti o -Leste has been able to mitigate the risks associated with large natural resource wealth, see Focus Box 1.
Page | 14
Table 2.3.2.1.1.1: Real GDP and Petroleum Sector Output 2007-20122 ($m)
2007 2008 2009 2010 2011 2012
Total GDP ($m) 4,090.0 4,582.9 4,275.3 4,215.5 4,630.6 4,889.6 Growth Rate Total GDP (%) -0.6% 12.1% -6.7% -1.4% 9.8% 5.6% Petroleum Sector ($m) 3,428.3 3,826.6 3,421.7 3,281.3 3,559.4 3,734.5
Growth Rate Petroleum Sector (%) -2.7% 11.6% -10.6% -4.1% 8.5% 4.9% Source: Timor-Leste National Account 2000-2012, General Directorate of Statistics
Figure 2.3.2.1.1.1: Real GDP by Sector 2003-20123 ($m)
Source: Timor-Leste National Account 2000-2012, General Directorate of Statistics
Focus Box 1: How Timor-Leste Avoided the Resource Curse
What is the Resource Curse?
The resource curse is when natural resource wealth leads to conflict, macroeconomic instability and spending on white elephant (useless) projects. These in turn cause living standards to stagnate or fall.
How Timor-Leste Used Natural Resources to Increases Stability
Political instability in Timor-Leste from 2006 to 2008 was not over access to natural resource wealth. Since 2008 Timor-Leste has enjoyed political stability and improved security even as oil production has increased. Indeed the Government has used oil revenue to finance war
ete a s pe sio s a d the PDID p og a that ha e p o ided a pea e di ide d to the
population and reduced the chances of conflict.
How Timor-Leste Avoided Macroeconomic Instability
Many countries have spent natural resource revenues soon after they have been collected. This results in the boom-bust cycle in commodity prices feeding through into volatile government expenditure, demand and inflation. Timor-Leste has avoided this type of
Page | 15
macroeconomic instability. Oil revenues are saved in the PF and do not flow directly into the State Budget. Withdrawals from the PF are based on what is considered sustainable in the long-term and not short term changes to oil revenues.
Spending on Priority Areas
From 2008 to 2013 the largest amount of infrastructure spending was on electricity ($896.2 million). This project sharply increased electricity generation, distribution and transmission. A reliable electricity supply is essential for economic growth and industrial development. Better access to electricity has benefited many people. This project cannot be regarded as a white elephant project. There has also been significant spending on education and health.
Increases in Living Standards since Oil Production Started
In Timor-Leste living standards have increased since oil production started. More specifically:
Non-petroleum GDP grew at an average rate of 11.8%, and household consumption increased by 6.7%, per annum from 2008 to 2012.
The prevalence of underweight children decreased from 48.6% to 37.7% from 2007 to 2013.
The primary school net enrolment rate increased from 65.6% in 2007 to 91.9% in 2013.
2.3.2.1.2: The Non-petroleum Economy
Economic Growth
The 2007-2012 period has been one of exceptionally high non-petroleum GDP growth, over these six years there have been two distinct growth periods. The first period, between 2007 and 2011 saw high growth driven by sharp increases in Government expenditure. While in 2012 the slightly lower non-petroleum GDP growth of 7.8%, was driven by factors other than Government expenditure.
Table 2.3.2.1.2.1: Non-petroleum GDP by Sector 2007-20124 ($m)
2007 2008 2009 2010 2011 2012
Non-Petroleum Sector ($m) 661.7 756.2 853.6 934.3 1,071.2 1,155.1 Growth Rate Non-Petroleum Sector (%) 11.4% 14.3% 12.9% 9.5% 14.7% 7.8% Source: Timor-Leste National Account 2000-2012, General Directorate of Statistics
As seen in figure 2.3.2.1.2.1, there were rapid increases in Government expenditure over the 2007- pe iod as the Go e e t s f o tloadi g poli as s aled up. F o tloadi g uses excess withdrawals from the PF in the short-term to kick-start economic growth through high quality investment in infrastructure and human capital. The Government is firmly committed to fiscal sustainability, and it has ensured that expenditure levels over the
Page | 16
2007-2011 period and all subsequent periods have been fiscally sustainable. However, a continuation of the growth rates in Government expenditure, seen during the scaling up period, would have been unsustainable. Thus Government expenditure growth has slowed to ensure fiscal sustainability, reducing the extent to which future Government expenditure will drive growth.
There was a substantial reduction in the growth rate of Government expenditures in 2012, and in particular capital and development expenditures decreased. This fall in capital and development expenditures was partially due to improvements in the investment management process, which may simultaneously constrain and improve the quality of capital expenditure. The lower Government expenditure growth is largely responsible for the below trend growth seen in 2012.
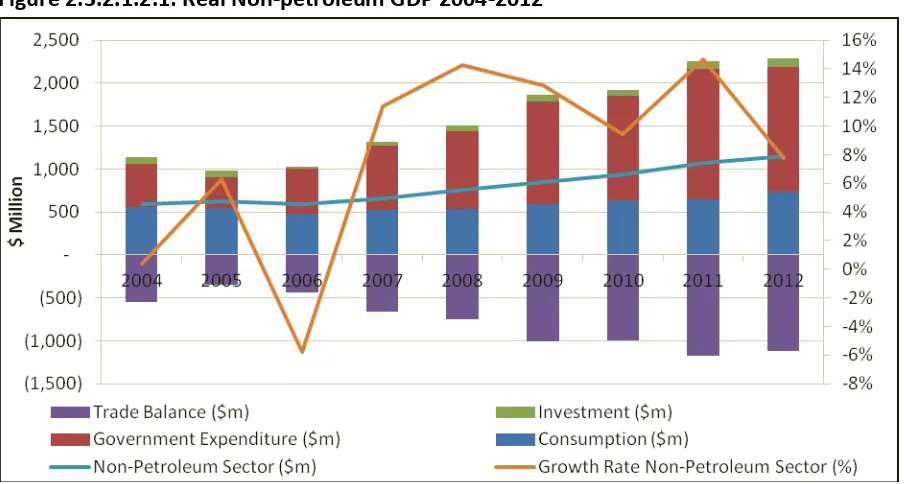
Non-petroleum private investment grew strongly over the entire 2007-2012 period, but remains relatively low, and thus has not significantly impacted overall growth rates. Household consumption also grew strongly over the 2007-2012 period, increasing by 37.6% from $507 million to $698 million. It is likely that this was partially driven by the increases in Government expenditures, especially the enlargement of public transfer programs. Finally, while the overall trade balance5 is significantly in surplus, Timor-Leste s o -petroleum trade deficit expanded rapidly between 2007 and 2011. However, in 2012 largely due to the fall imports, caused by the decrease in capital and development expenditure the trade deficit fell.
Figure 2.3.2.1.2.1: Real Non-petroleum GDP 2004-2012
Source: Timor-Leste National Account 2000-2012, General Directorate of Statistics and National Directorate of Economic Policy
5
Page | 17
Growth across the major sectors of the Timorese economy varied significantly during both the 2007-2011 and 2012 periods.
During the 2007-2011 period, driven by increases in Government expenditure, the public administration and constructions sectors boomed with average annual growth rates of 16.5% and 68.7% respectively. In contrast, the agricultural sector declined in real terms over the 2007-2011 period; this decline was heavily linked to weather conditions over the period. Finally, growth in the wholesale and retail sector Timor-Leste s fou th ajo o -petroleum sector, grew steadily averaging growth of 7.8% a year.
As seen in table 2.3.2.1.2.2, in 2012 the slowdown in Government salaries and wages expenditure growth led to below trend public administration sector growth of 11.0%. While the fall in Government capital expenditure led to a 6.6% fall in construction sector output. After falling in 2010 and 2011, the agricultural sector grew by 14.6% in 2012. The
ag i ultu al se to is a highl i po ta t se to as a la ge p opo tio of the ou t s
population are dependent on agriculture through either formal employment or subsistence agriculture. The strong growth in this sector suggests that, despite the slowdown in real non-petroleum GDP growth, the living standards for a large proportion of Timor-Leste s population may have increased significantly in 2012. In 2012 the wholesale and retail sector grew by 7.3% a continuation of the grow rates seen between 2007 and 2011.
Table 2.3.2.1.2.2: Real Non-Petroleum Sector Growth Rates 2006 -2012 (%)
2006 2007 2008 2009 2010 2011 2012 Source: Timor-Leste National Account 2000-2012, General Directorate of Statistics
Inflation
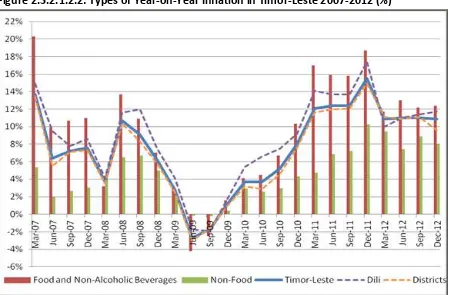
The SDP sets a 4.0%-6.0% target inflation range. As seen in figure 2.3.2.1.2.2 inflation fluctuated significantly between 2007 and 2012 and was predominantly above the target range. The inflation witnessed in the early stages of this period can be partially attributed to supply effects associated with the civil unrest in 2006.
After a brief period of deflation in late 2008 and early 2009, year-on-year inflation6 began to steadily increase towards a peak of 15.5% in December 2011. This sharp increase in inflation can be attributed to three main causes. Firstly, increases in international food prices may have led to increases in the price of imported food. Secondly, the USD depreciated against the currencies of Timor-Leste s ajo t adi g pa t e s, hi h also p o a l led to a
6
Page | 18
increase in the prices of imports. Finally, the increase in recurrent Government expenditure may have increased demand in the economy, creating inflationary pressure.
Over this period the overall trend in inflation was driven by changes in food and non-alcoholic beverage prices. Prices in this category rose by 50.6% between June 2009 and December 2012. It is likely that over this period food and non-alcoholic beverage inflation
put do a d p essu e o o su e s pu hasi g po e . I flatio i oth Dili a d the
districts followed the same trend over the period, though the rate of inflation was usually slightly higher in Dili.
Figure 2.3.2.1.2.2: Types of Year-on-Year Inflation in Timor-Leste 2007-2012 (%)
Source: Monthly CPI publication, General Directorate of Statistics
Summary of Performance of the Domestic Economy from 2007-2012
Page | 19 2.3.2.2: The Medium Term Outlook 2013-2015
Economic Growth 2013-2015
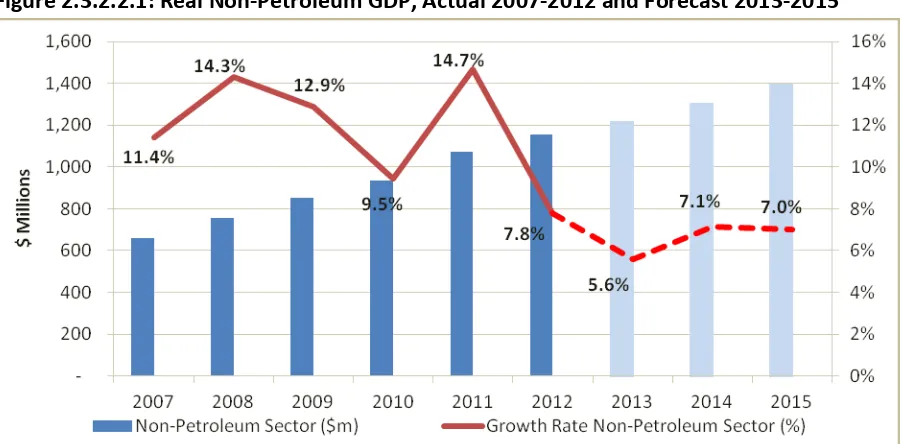
The MoF is forecasting non-petroleum GDP growth in the 5.6% to 7.1% range over the 2013-2015 period (see figure 2.3.2.2.1.). Despite being below the growth path seen between 2007 and 2011 these rates of economic growth are still high by international standards and in line with emerging and developing Asia, see table 2.3.1.1.1.
Figure 2.3.2.2.1: Real Non-Petroleum GDP, Actual 2007-2012 and Forecast 2013-2015
Source: National Directorate of Economic Policy, Ministry of Finance and Timor-Leste National Account 2000-2012, General Directorate of Statistics
In 2013 the non-petroleum GDP growth rate has been forecast at 5.6%. This below trend projection has been by driven by low execution of Government capital expenditure which was partially the result of improvements in the investment management cycle. Imports of goods and services7 which grew strongly, also contributed to the below trend growth forecast. However, the strong growth rates in private sector investment and household consumption seen in recent years are forecast to continue.
The non-petroleum GDP growth forecasts for 2014 and 2015 are 7.1% and 7.0% respectively. The 2014 growth projection is primarily driven by increases in household consumption and recurrent Government expenditure. While in 2015 the growth rate is driven by strong growth in household consumption and private sector investment. Private investment growth in 2015 is driven by firm project proposals from several multinational companies wishing to do business in Timor-Leste.
7
Page | 20
Inflation 2013-2015
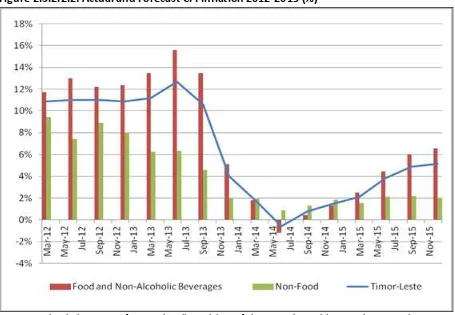
Year-on-year inflation in Timor-Leste in December 2013 was 4.0%. This is within the SDPs 4.0%-6.0% target range and represents a significant fall from the double digit inflation witnessed between 2010 and 2012. This downward trend has continued into 2014 and year-on- ea i flatio is fo e ast to e elo the Go e e t s ta get a ge i . While the 2015 forecasts estimates that the rate of inflation will return to within the target range. In December 2013 year-on-year food and non-alcoholic beverage, and non-food CPI were 5.1% and 2.0% respectively. Inflation in both of these categories is significantly down on the rates seen between 2011 and 2012. As during the 2007-2012 period, the rate of inflation in this period is primarily driven by food and non-alcoholic beverage inflation, with non-food price inflation remaining more stable.
Figure 2.3.2.2.2: Actual and Forecast CPI Inflation 2012-2015 (%)
Source: National Directorate of Economic Policy, Ministry of Finance and Monthly CPI Series, General Directorate of Statistics, Ministry of Finance
Page | 21
Domestic factors may also have played a role in reducing the rate of inflation. The lower rates of inflation in 2013 and 2014 may be the result of the slowdown in Government expenditure in 2013 slowing domestic demand. While the forecasted increase in recurrent expenditure in 2014 is partially driving the higher inflation forecast in 2015. On the supply side it is possible that increases in the supply of domestically produced food or the removal of import capacity constraints are partially responsible for the reductions in the rate of inflation. However, supply side analysis is severely restricted by data constraints.
Lower but Higher Quality Growth
Though the non-petroleum GDP growth forecast for 2013-2015 is below the 2007-2011 growth trend, it is likely to be of a higher quality for four reasons.
Firstly, there are signs that the Timorese economy has begun to transition away from short-term expenditure driven growth towards more sustainable long-short-term private sector driven growth. The high growth trend witnessed between 2007 and 2011 was the result of large
i eases i Go e e t e pe ditu e hi h o u ed as the Go e e t s f o tloadi g
policy was scaled up. Whilst over the 2013-2015 period, Government expenditure growth is projected to slow and growth in the private sector will begin to drive non-petroleum GDP growth.
Secondly, in line with strong private sector driven growth, the projections show private investment playing an increasingly important role in driving non-petroleum GDP growth. Private investment is expected to reach unprecedented levels in 2015 due to solid proposals from several multinational organisations intending to do business in Timor-Leste. This is
di e tl i li e ith the Go e e t s poli to eate the e essa o ditio s to att a t
private sector investment.
Thirdly, the current low rates of inflation are forecast to continue throughout the rest of the 2013-2015 period. These rates sharply contrast with the high inflation seen during the
pe iod. Lo e i flatio a help to i ease the pu hasi g po e of itize s ages
and reduce poverty. In addition, lower inflation will lead to lower increases in business costs. This will help to improve Timor-Leste s i te atio al o petiti e ess hi h ill increase exports and investment.
Page | 22
2.4: Millennium Development Goals
The MDGs consists of eight ambitious economic and social goals that the Government is committed to achieving by 2015.
Goal 1: Eradicate Poverty and Hunger
The 2007 TLSLS indicated that 49.9% of Timorese people lived under the national poverty line of $0.88 per day. The incidence of poverty, as measured by the WB in 2010, decreased to around 41.0%. This decrease was largely attributed to post-2007 economic growth. Efforts are underway to obtain a more recent estimation of poverty in Timor-Leste.
Child malnutrition has significantly fallen since independence but remains high. More specifically, the prevalence of under-weight children under five decreased from 45.8% in 2002 to 37.7% in 2013. The Government is aiming to further reduce child malnutrition by increasing agricultural production, encouraging citizens to improve their diets and providing children with nutritious meals at school.
Goal 2: Achieve Universal Primary Education
There has been a marked improvement in primary school enrolment rates. More specifically, the net enrolment rate increased from 65.6% in 2007 to 91.9% in 2013.8 The net enrolment rate is also now higher for girls than for boys in both primary and secondary education.
Further expanding and improving the quality of education is a priority for the Government. Key policies include improving access to and the quality of schools, reducing absenteeism, implementing the new curriculum and better preparing children for primary school through improvements to pre-primary education.
Goal 3: Promote Gender Equality and Empower Women
Gender equality has improved in Timor-Leste and the percentage of seats occupied by women in Parliament now exceeds the Govern e t s ta get of % at . %.
The Government is committed to further reforms in institutions, politics, policy making and education to improve gender equality. Key activities include but are not limited to: running an advocacy campaign to increase awareness of gender responsive laws and policies, establishing a district female congress and employing more female teachers to act as positive role models for girls.
8
Page | 23
Goal 4: Reduce Child Mortality
Timor-Leste has already achieved its goal of reducing the under-five mortality rate by two thirds. According to the DHS 2009-2010, the infant mortality rate decreased to 44.0 per 1,000 live births, below the target of 53.0 per 1,000 live births.
Going forward the Government is determined to further improve child health. Key policies will include strengthening health services and further improving rates of immunization.
Goal 5: Improve Maternal Health
Maternal mortality has fallen since independence but is still high compared to other countries in the region. There were 557 maternal deaths per 100,000 live births in 2009/20109 compared to 660 deaths per 100,000 live births in 2000.
Maternal health policy has been an area of significant progress in Timor-Leste. Policies have focused on increasing awareness about maternal health issues, strengthening human resources in the health sector, ensuring health units are properly equipped, improving the nutritional status of mothers and strengthening family planning services.
Goal 6: Combat HIV/AIDS, Malaria and other Diseases
Malaria remains one of the main public health concerns as more than 80% of the population is at high risk and a high percentage of the cases concern children. Malaria has been combated by raising knowledge and awareness of its causes, strengthening data collection, distributing bed nets and employing volunteers to detect and treat this disease.
The first case of HIV/AIDS was detected in Timor-Leste in 2003 and, since then, the number of cases has increased to 426, causing the deaths of 41 people. This implies that although the prevalence of HIV/AIDS is low in Timor-Leste it has been increasing. Key policies in this area have been public health campaigns to increase awareness of HIV/AIDS and strengthening the ability of the health system to diagnose and treat this disease.
Goal 7: Ensure Environmental Sustainability
The 2010 Census suggests that over 90.0% of the population use wood as source of energy for cooking which might be contributing to the slight loss of forest cover witnessed between 2001 and 2009, from 51% to 50%. The recent expansion of the national electricity grid may reduce demand for firewood and consequently deforestation. There are also plans to plant sandalwood, mahogany and teak which will directly contribute to reforestation.
The proportion of the population using an improved water drinking source and the proportion of the population using an improved sanitation facility have both increased in Timor-Leste since 2001. The Government has improved water and sanitation by
9
Page | 24
strengthening planning, constructing new facilities and building the capacity of communities to maintain these facilities. Going forward there are plans to build a total of 65,000 latrines for vulnerable households by 2017 and develop water master plans for all districts.
Goal 8: Develop a Global Partnership for Development
The Government is encouraging development partners to use national systems for Overseas Development Assistance. The Australian government and EU recently showed their confidence in national systems by providing direct budgetary support
Timor-Leste has strengthened its relationship with the international community through its leading role in the g7+ and presidency of CPLP.
The Government also recognizes that in the context of a globalized economy, it is important to promote new technologies as this will be key for Timor-Leste to reach its development goals. In this area Timor-Leste has witnessed dramatic improvements with approximately half of the population now enjoying mobile phone access. There have also been similar improvements in internet access where currently approximately 25% of the population are able to get online.
2.5
: Expe diture a d Develop e t Part ers’
Commitments
The 2015 combined sources of the State Budget amounts to $1,735.5 million. This total is composed of $1,570.0 million in Government expenditures (including loans) and $165.5 million from development partners.
Total Government expenditure (excluding loans) is only 2.1% higher for 2015 than 2014. The Government is stabilizing expenditures to ensure fiscal sustainability, high quality spending and improved budget execution. Lower growth in Government expenditure is also consistent with stronger economic growth driven by the private sector and low inflation.
2.5.1: Expenditures by Fund
Government expenditure is spread across the CFTL, the IF, the HCDF and loans. CFTL and IF expenditures in 2015 (excluding loans) have increased by 1.1% and 7.8% respectively compared to the 2014 budget; whilst HCDF expenditures have decreased 19.7% compared to the 2014 budget figure.
Page | 25
HCDF activities have been reviewed and spending has been refocused to ensure value for money. CFTL expenditure growth has been constrained to ensure fiscal sustainability and improve budget execution.
Loan financed expenditures have more than doubled in comparison to the 2014 budget, reaching $70.0 million in 2015.
Table 2.5.1.1: Expenditure by Fund ($m)
2013 Sources: National Directorate of the Budget and Development Partners Management Unit
2.5.2: CFTL Expenditures
The CFTL is the Go e e t s e t al a ou t and includes all expenditures for line ministries and autonomous agencies with the exception of the IF and HCDF. Within it, recurrent and capital expenditures are spread across five appropriation categories as laid out in table 2.5.2.1.
Expenditures in the CFTL are expected to slightly increase by 1.1% in 2015. The increases in recurrent are 4.7%, whilst capital expenditures are expected to decrease 23.0% in 2015, compared to the budget figure for 2014.
Table 2.5.2.1: CFTL Expenditure by Fund ($m)
2013
Page | 26
difficult action to reverse in the future. This constrained growth in recurrent expenditure is necessary to ensure fiscal sustainability.
Capital expenditures in the CFTL have been reduced in 2015, mainly due to a 29.6% reduction in minor capital spending. The Government made this saving by reviewing minor capital spending and eliminating wasteful expenditures. This should increase the efficiency of public spending going forward.
2.5.2.1: Salaries and Wages
Salaries and wages expenditures are expected to grow modestly by 4.1%, in 2015. The main measures for 2015 are:
$ . illio to the Mi ist of Edu atio to a ds i easi g tea he s sala ies,
particularly for those in remote areas. This expenditure will attract more and better teachers which will increase the quality of education across the whole country.
$2.0 million to the Ministry of Foreign Affairs & Cooperation towards increasing foreign living expenses for Timorese Ambassadors. This will allow them to better represent Timorese citizens and businesses in foreign countries.
$1.4 million to PNTL, Ministry of Health and Courts towards supporting the wages of new PNTL members in Australia and Indonesia, as well as midwives and doctors and new national auditing in the courts. This will encourage skilled workers to join key sectors such as defence, justice and health.
2.5.2.2: Goods and Services
Goods and services is the largest appropriation category in CFTL and will reach $472.6 million for 2015; 7.3% higher than was budgeted for 2014. This section first describes measures under this appropriation category and it then classifies investments.
Measures
The main measures for goods and services include:
$115.6 million to the Ministry of Public Works towards fuel and maintenance of the electricity generators. Providing electricity throughout the whole country has been one
of the Go e e t s g eatest a hie e e ts a d should u de pi futu e economic development. Ensuring effective maintenance of generators and the regular, adequate supply of fuel is essential for ensuring a reliable supply of electricity.
Page | 27 $17.8 million in the Ministry of Education towards for the School Feeding program in
public schools and for scholarships. Providing children with sufficient and adequate nutrition will improve both their educational attainment and their health.
$15.3 million to the Ministry of Health to buy medicines and food for patients. These expenditures will help improve the quality of health services provided in the country.
$14.5 million for Ministry of Justice towards the program Ita nia Rai and the cadastral survey. These programs are important for improving land rights in Timor-Leste which will contribute to security and economic growth.
$8.5 million for Ministry of Commerce, Industry and Environment towards rice imports and sale of local products. This will support the local rice market, contribute to the School Feeding and Disaster Relief programs and ensure basic access to food for the population.
$7.5 million to the Whole of Government towards paying quotas and for the 2015 census. This survey provides important information on the population and living standards in Timor-Leste.
$5.5 million to the Whole of Government for the Counterpart Fund. This fund pays for
the Go e e t s o t i utio to p oje ts u de take ith development partners that boost economic growth and reduce poverty.
$3.7 million to the Ministry of Agriculture and Fisheries towards the purchase of seeds. This will contribute to the development of agriculture and improve food security.
$3.0 million to the Whole of Government towards reinforcing the tax law. Improving tax revenues is a central strategy of the Government in order to diversify revenue streams. This expenditure will contribute to this goal and help the Government increase efficiency of tax administration and collection.
$2.0 million for Ministry of Commerce, Industry and Environment for the celebration of the 500th anniversary of Oecussi.
$1.8 million to the Ministry of Social Solidarity for entertainment and contributions to veterans in honour of their sacrifices in achieving independence.
$1.6 million to the National Electoral Commission for the Election of the Chefe de Suco program. Promoting democracy and rural development is of great importance to the Government in order to ensure growth which is inclusive and also to maintain security across the whole territory.
Page | 28 $1.5 million to the Whole of Government for the CPLP. This money with assist
Timor-Leste during its presidency of the CPLP and promote dialogue and trade between Portuguese speaking countries. Timor-Leste s leadi g ole i the CPLP ill allo it to further influence the global community.
$1.4 million to the Ministry of Agriculture in support of agricultural groups. Promoting local production is a priority for the Government and will help ensure sustainable access to food.
$1.3 million to the Ministry of Transport and Communication towards fuel for the Berlin Nakroma. This expenditure will contribute to better transport, which is an important
pa t of the Go e e t s e onomic growth strategy.
$1.2 million for the Presidency of the Republic in order to promote and support rural communities.
$1.0 million for the Ministry of Justice towards biometric passports. This expenditure will make travelling abroad easier for Timorese citizens.
$1.0 million towards the Growth Triangle Program between Indonesia, Timor-Leste and Australia. This expense will contribute towards better relations with neighbouring countries, which will foster trade and closer regional ties.
Investments
The Government considers that many expenses under CFTL goods and services are investments that contribute towards development. More specifically 43.0% of total goods and services expenditures in CFTL are classified as physical, social or human capital investments.
Physical Investments
Physical investments total $129.1 million, 27.3% of CFTL goods and services expenditure. This includes the counterpart contribution, purchase of seeds, fuel and maintenance for the generators and fuel for the Berlin Nakroma.
Social Investments
Page | 29
Human Capital Investments
Human capital investments increase the qualifications and productivity of the workforce. Of CFTL expenditure on goods and services, $0.8 million are considered to directly contribute to the development of human capital. These include programs for teacher training and vocational education.
2.5.2.3: Public Transfers
Public transfers comprise all of the money the Government spends on public grants and consigned payments. They are the second largest category in recurrent expenditures and are set to reach $340.3 million in 2015.
This section describes the main measures for this category and their classification into different types of investment.
Measures
The main measures for public transfers include:
$176.4 million to the Ministry of Social Solidarity towards social programs, including the veterans , old age and disability pension schemes and Bolsa de Mãe. These programs support vulnerable and deserving groups and contribute to reducing poverty.
$20.0 million to the Office of the Prime Minister towards emergency support for rehabilitating of schools and health posts across the whole territory. Improving health and education in Timor-Leste are priorities of Government.
$17.8 million in the Ministry of State Administration to support PNDS. This program significantly contributes to rural development.
$14.0 million to the Office of the Prime Minister towards supporting NGOs. The NGO sector in Timor-Leste provides a valuable service to the country and its people.
$11.5 million to the Ministry of Petroleum and Mineral Resources to support ANP, Timor GAP and IPG. This money is required to ensure Timor-Leste maximises the benefits from its natural resources.
$10.5 million to SEPFOPE for rural employment, the ceramic industry, building of five houses program, road changes and the self-employment, mobile training centre. This will contribute promoting job creation and economic growth.
Page | 30 $9.9 million to the Council of Ministers towards the Special Social Market Economic
Zone in Oecusse.
$8.3 million to the Ministry of Health for treatments abroad, a new cardiovascular clinic and to support activities of public health and the SISKA. These investments are important to ensure that the quality of health services for the population continues to improve.
$7.3 million to the Ministry of State Administration in order to subsidize the Council for Sucos and operational costs for cleaning in Dili.
$6.5 million to the Secretary of State of Youth and Sports to support sport and artistic activities. Promoting culture and sports is important both for morale as well as to promote Timorese traditions.
$ . illio to the Mi ist of Edu atio to a ds suppo ti g u i e sities, “alesia s
educational institutions and the School Feeding Programme in private schools.
$6.0 million to Whole of Government towards pensions for former Prime Ministers, Presidents of the Republic, Presidents of Parliament, Government Ministers and Members of Parliament
$6.0 million to the National Electoral Commission to support political parties. This expenditure will contribute to the democratic process in Timor-Leste.
$4.8 million to Ministry of Commerce, Industry and Environment to support cooperatives, commercial groups, industrial groups and environmental protection groups.
$4.0 million to Whole of Government towards financial contributions.
$4.0 million to UNTL towards scholarships through international partner organizations. This will ensure Timorese students have access to world renowned universities.
$2.7 million for the Ministry of Social Solidarity to support orphans, the homeless and the handicapped. The Government is committed to supporting these and other vulnerable groups in society.
$2.5 million for the g7+ secretariat. The work of this secretariat ensures that the voice of fragile states is heard and acted upon by the international community.
$1.5 million to SEAPRI for the bamboo centre and to support the private sector in the areas of agriculture and tourism. These initiatives are important for promoting economic diversification and supporting new industries.
Page | 31 the Go e e t s o it e t to provide electricity across the whole territory as well as promote the use of renewable energy.
$1.2 million to Ministry of Social Solidarity and Office of the Vice Prime Minister towards the Red Cross and the HIV/AIDS programs. These will support the provision of healthcare in Timor-Leste.
$1.0 million to Ministry of Tourism towards national and international events.
Investments
Investments towards public transfers for 2015 add up to $332.3 million, 97.7% of total budgeted public transfer expenditures.
Physical Investments
The Government has classified $65.0 million of transfer spending as physical investments, which are 19.1% of public transfers expenditure. The measures classified as physical investments include those towards PNDS, rural employment, building of five houses by village, support for cooperatives and industries which protect the environment, rehabilitation of schools and health posts and support towards installing solar panels for communities.
Social Investments
The Government has classified $238.2 million, or 70.0% of transfer spending as social investments. Measures classified under this category include funds for supporting the disabled, orphans and homeless, support for NGOs, contributions for international finance, the Special Social Market Economic Zone, the g7+ secretariat, support to health activities in SISKA and the new cardiology centre, subsidies towards treatment abroad, subsidies for the School Feeding program in private schools, subsidies for sucos, national and international events, support for sports activities and the bamboo centre.
Human Capital Investments
Page | 32 2.4.2.4: Minor Capital
Minor capital includes expenditures on vehicles, furniture and other equipment. The 2015 budget for this category is significantly decreasing by 29.6% from the 2014 budget as a result of the elimination of some inefficient expenditures.
This section first describes the main measures for this category and then their classification into different types of investment.
Measures
The main measures for minor capital are outlined below:
$12.0 million for the Ministry of Transport towards purchasing a new ferry.
$3.0 million in the Ministry of Public Works towards the provision of water equipment and installation of electricity across the territory. Providing adequate infrastructure is a core objective of the Government and is a cornerstone for future development.
$1.7 million towards fire trucks and special vehicles for Ministries of Health, Justice, State Administration, Public Works, Public Transport and Communication and the Secretary State for Security. This expenditure will contribute to safer living conditions for the population.
$1.2 million to the Ministry of Health towards medical equipment, including labs, x-ray machines and beds. This expenditure will help towards improving the quality of health services provided in the country.
Investments
The Government considers that $18.8 million of the minor capital budget is a social investment. This is 51.2% of total projected expenditures for minor capital in 2015. Minor capital expenditures which are classified as social investment include the purchase of fire trucks and specialized vehicles by the Ministry of Transport and Communication, new labs for the Ministry of Health, prepayment machines for EDTL, fishing machinery and the new ferry boat.
2.5.2.5: Capital and Development
Page | 33
Table 2.5.2.5.1: PDID and Other Capital and Development Expenditures ($m)
2013
economic growth and development. The IF was established in 2011 to manage all large scale (above $1.0 million), multi-year infrastructure projects. Key programs such as electricity generation and road construction have been financed through the IF.
In accordance with international best practice the IF uses a multi-year budget (see table 2.5.3.1). The unspent balance in the fund is rolled over from one year to the next. This ensures that money to pay contractors is effectively ring-fenced, it simplifies budgeting (as
p oje t s udgets do not have to be recalculated every year) and it reduces the risk of non-payment to contractors.
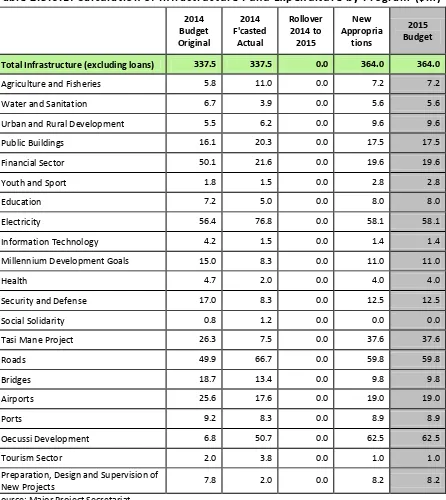
The total budget for the IF in 2015 (excluding loans) is set to reach $364.0 million (7.8% higher than in the 2014 budget) and is broken down into various programs. The largest of these for 2015 are the Oecusse development (17.2% of the total budget), the roads program (16.4% of the total budget) and the electricity program (16.0% of the total budget). These
e pe ditu es a e i li e ith the Go e e t s p io ities as set up i the “DP. The Oe ussi
Special Social Market Economic Zone is one of the six special economic zones envisioned in the SDP, which are believed to promote economic growth through increased exports and greater industrial production. Roads and electricity programs are two key investments for the development of the country, which will directly increase standards of living and stimulate business.
Page | 34
Table 2.5.3.1: Calculation of Infrastructure Fund Expenditure by Program ($m)
2014
Total Infrastructure (excluding loans) 337.5 337.5 0.0 364.0 364.0
Page | 35
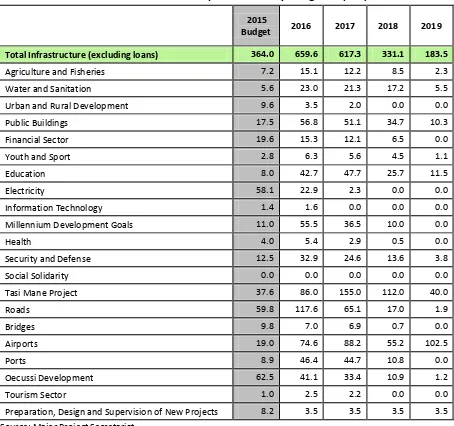
Table 2.5.3.2: Infrastructure Fund Expenditures by Program ($m)
2015
Budget 2016 2017 2018 2019 Total Infrastructure (excluding loans) 364.0 659.6 617.3 331.1 183.5
Agriculture and Fisheries 7.2 15.1 12.2 8.5 2.3
Water and Sanitation 5.6 23.0 21.3 17.2 5.5
Urban and Rural Development 9.6 3.5 2.0 0.0 0.0
Public Buildings 17.5 56.8 51.1 34.7 10.3
Financial Sector 19.6 15.3 12.1 6.5 0.0
Youth and Sport 2.8 6.3 5.6 4.5 1.1
Education 8.0 42.7 47.7 25.7 11.5
Electricity 58.1 22.9 2.3 0.0 0.0
Information Technology 1.4 1.6 0.0 0.0 0.0
Millennium Development Goals 11.0 55.5 36.5 10.0 0.0
Health 4.0 5.4 2.9 0.5 0.0
Security and Defense 12.5 32.9 24.6 13.6 3.8
Social Solidarity 0.0 0.0 0.0 0.0 0.0
Tasi Mane Project 37.6 86.0 155.0 112.0 40.0
Roads 59.8 117.6 65.1 17.0 1.9
Bridges 9.8 7.0 6.9 0.7 0.0
Airports 19.0 74.6 88.2 55.2 102.5
Ports 8.9 46.4 44.7 10.8 0.0
Oecussi Development 62.5 41.1 33.4 10.9 1.2
Tourism Sector 1.0 2.5 2.2 0.0 0.0
Preparation, Design and Supervision of New Projects 8.2 3.5 3.5 3.5 3.5 Source: Major Project Secretariat
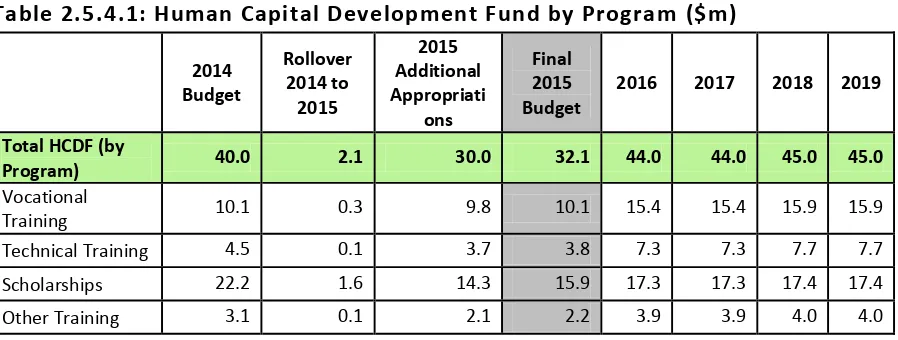
2.5.4: Human Capital Development Fund
Page | 36
Table 2.5.4.1: Human Capital Development Fund by Program ($m)
The total 2015 budget for the HCDF is $32.1 million, which is a 19.7% reduction compared to the 2014 budget. The Government has reviewed and reduced the HCDF budget to ensure the highest returns for each dollar spent. All four programs have lower budgets for 2015, with the exception of vocational training (which will remain the same as in the 2014 budget). The Government plans to conduct an impact assessment of all HCDF programs since 2011 and draft a map of human resources per district. Lower and better executed expenditures, together with detailed reviews on the progress of different programs will strongly increase the HCDF s outcomes going forward and provide greater returns towards investment in education and skills in Timor-Leste.
2.5.5: Expenditure on Loan Financed Projects
Expenditure on loan financed projects is presented in table 2.5.5.1, which amounts to $70.0 million in 2015. A detailed description of these projects is presented in section 2.7.
Table 2.5.5.1: Expenditure on Loan Financed Projects ($m)
2014
2.5.6: Development Partners
’
Commitments
Page | 37
Figure 2.5.6. : Develop e t Part ers’ I dicative Co it e t -2019 ($m)
Sources: Development Partnership Management Unit
2.6: Revenues
2.6.1: Overview of Revenue Projections
Table 2.6.1.1 shows forecasts for total revenues up to 2019, which are the sum of domestic revenues and petroleum revenues. Total revenues are projected to fall due to declining petroleum revenues. This decline was expected as oil production from Bayu-Undan has now passed its peak production levels. Domestic revenues are forecasted to increases every year from 2015 to 2019.10
Table 2.6.1.1: Total Revenue 2013 – 2019 ($m)
2013
Actual 2014 BB1
2015
Projection 2016 2017 2018 2019 Total Revenues 4,057.8 2,684.1 2,445.4 2,360.7 2,272.8 2,047.8 1,945.9 Domestic Revenues 151.1 166.1 170.4 182.0 193.7 205.6 217.7 Petroleum Revenues 3,906.7 2,518.0 2,275.0 2,178.7 2,079.0 1,842.2 1,728.2 Sources: National Directorate of Economic Policy and the PF Administration Unit.
2.6.2: Domestic Revenue
2.6.2.1: Overview
Government policy is to increase domestic revenue collections so that the financing of public services is less reliant on withdrawals from the PF in the future. Domestic revenue has experienced steady growth during the past few years and this is set to continue in 2015 (see table 2.6.2.1.1). More specifically, domestic revenue is forecasted to increase by 2.6%
10
Page | 38
in 2015 compared to 2014.11 This rise is more modest than in previous years, but this is not because of reduced domestic economic activity, lower tax rates or more inefficient tax administration. Rather it is mainly because of lower revenue from rice sales and low inflation. Excluding revenues from rice sales domestic revenue is growing by 5.6% from 2014 to 2015 which is more similar to the past increases. The reduction in revenue from rice sales is due to a deliberate policy decision by the Government to scale back the rice subsidy program due to improved rice supply in Timor-Leste. These arguments are further discussed in the following subsections which cover all components of domestic revenues; namely taxes, fees & charges, interest and autonomous agencies.
Table 2.6.2.1.1: Domestic Revenue 2013 – 2019 ($m)
2013 direct taxes, indirect taxes and other tax revenues and their projections are summarized in Table 2.6.2.2.1.
As seen in Table 2.6.2.2.1, increases in tax collection are expected to continue, reaching $125.5 million in 2015 (a 4.6% rise on the 2014 budget). The Government is striving to promote higher tax collection and is considering various changes in the taxation system in Timor-Leste towards this goal, including the signing of a convention with Portugal in July 2014 to improve tax administration.
Direct taxes are expected to increase by 1.1% in 2015 compared to the figure for the 2014 budget. This is mostly due to improved levels of compliance and also because of a reclassification of the categories I di idual I o e a d I di idual I o e Othe applied since 2014, in order to distinguish between civil servants and other workers more accurately. In contrast, withholding and corporate taxes are expected to decrease compared to the figures for the 2014 budget.
11
Page | 39
Indirect taxes are expected to increase in 2015 by 6.9% due to higher excise tax and import duties. The increase in revenue from these taxes is a result of the rising purchasing power of the population, imports of materials for large infrastructure projects and greater compliance.
These rises counteract expected a slight reduction in service and sales tax for 2015 compared to the 2014 budget figure. Collections of both these taxes are expected to be higher than the actual collection in 2013. This upward trend is expected to continue in the future.
However the collection of these taxes ought to also continue improving in the near future with the strengthening of the private sector and the administration mechanisms around it.
Table 2.6.2.2.1: Total Tax Revenue 2013 – 2019 ($m)
Source: National Directorate of Economic Policy
2.6.2.3: Fees & Charges
Fees & charges include a wide selection of categories which contribute to domestic revenue from non-tax sources. These comprise administrative fees, utility payments and endowments to the Government from natural resources other than petroleum. As shown in Table 2.6.2.3.1, most of the categories represent small amounts, which are rounded to zero in some cases.12 The list is also often updated with new categories, reflecting regular changes to the revenue collection system in Timor-Leste, which are the result of improvements in administrative efficiency and new delineation of responsibilities across line ministries. Table 2.6.2.3.1 shows the projections.
12
Page | 40
Table 2.6.2.3.1: Fees & Charges Projections 2013 – 2019 ($m)
2013 Source: National Directorate of Economic Policy
Total fees & charges are expected to decrease by 9.7% in 2015 in comparison to the 2014 budget figure. This is mostly explained by the fall of expected revenues from rice sales, business registration fees and dividends, profits and gains.
Page | 41
The reduction in business registration fees for 2015 stems from changes in the administration process brought about by the One Stop Shop (SERVE). The lower dividends, profits and gains are the result of smaller profits from the telecom provider Timor Telecom since the liberalisation of the telecommunications market.
Despite an overall reduction in fees & charges, many of its categories are expected to increase for 2015. Most notably these include water fees, productos florestais, visa fees, franchising public transport, RTTL fees and social games and receipts. All relevant line ministries for these categories attributed the improvements to either better monitoring, new technology, administration or improved legislation. The increase in social games receipts stems from the increasing number of games and lotteries available in Timor-Leste.
2.6.2.4: Interest
Interest reflects interest payments received from cash held in the CFTL, HCDF and IF (see table 2.6.2.1.1). It is expected to slightly decrease in 2015 due to smaller cash reserves in these accounts. These s alle ash ese es a e due to the Go e e t s poli of u i g down cash balances before withdrawing money from the PF. This policy maximises investment returns as the yield on PF assets is higher than the interest rate on cash held in
the Go e e t s a ou ts.
2.6.2.5: Autonomous Agencies
Table 2.6.2.5.1 lays out the revenue forecasts for the four autonomous agencies which are currently operating in Timor-Leste (previously there were five, but EDTL was incorporated into the Ministry of Public Works in 2014).
Table 2.6. .5. : Auto o ous Age cies’ Reve ues – 2019 ($m)
Source: National Directorate of Economic Policy
Overall, autonomous agency revenues are expected to increase by 59.5% in 2015 compared to the 2014 budget figure. Higher port and aviation revenues are due to an increase in the flow of the people and goods in and out of the country, which is in accordance with higher levels of imports.