Full Terms & Conditions of access and use can be found at
http://www.tandfonline.com/action/journalInformation?journalCode=cbie20
Bulletin of Indonesian Economic Studies
ISSN: 0007-4918 (Print) 1472-7234 (Online) Journal homepage: http://www.tandfonline.com/loi/cbie20
Survey of recent developments
Ross H. McLeod
To cite this article: Ross H. McLeod (2011) Survey of recent developments, Bulletin of Indonesian Economic Studies, 47:1, 7-34
To link to this article: http://dx.doi.org/10.1080/00074918.2011.556054
Published online: 15 Mar 2011.
Submit your article to this journal
Article views: 290
View related articles
ISSN 0007-4918 print/ISSN 1472-7234 online/11/010007-28 © 2011 Indonesia Project ANU DOI: 10.1080/00074918.2011.556054
SURVEY OF RECENT DEVELOPMENTS
Ross H. McLeod
Australian National University
SUMMARY
The Indonesian public is becoming increasingly concerned about the gap between policy rhetoric and action. A strong contributor to this has been a long-running corruption saga involving a tax oficial, Gayus Tambunan, whose activities have helped conirm the pub-lic’s worst fears about the ineffectiveness of the anti-corruption campaign. Claims of pro-gress in this and other ields, including the economy, are often overstated, and opinion polls suggest that people are increasingly unwilling to take them at face value.
Nevertheless, the most recent data reveal a surprising surge of GDP growth, driven mainly by investment spending. Inlation has been quite steady for the last six months, albeit a little above the target range; this is disappointing, but not a major problem. In response to surging food prices the government has temporarily removed tariffs on rice, wheat and soybeans, and ordered increased rice imports. Energy subsidies continue to weigh heavily on the budget; the plan to remove the subsidy from petrol used in private cars but not from that used in motor cycles makes good political – if not economic – sense, since motor cycle owners greatly outnumber car owners. The 2011 budget is unlikely to have a stimulatory impact.
The composition of exports has altered quite dramatically over the last two decades, albeit in unexpected directions. The pattern of export destinations has also undergone sig-niicant change, relecting the growing relative importance of Asia to the global economy. The president’s proposal for a new capital as the solution to the congestion problem in Jakarta is questionable. If policy makers fail to understand why existing cities perform their diverse functions poorly, the creation of a new capital is more likely to replicate than to solve problems. Cities are crucial to the modernisation of the economy, and are impor-tant vehicles for poverty reduction. City governments could greatly improve their perfor-mance by adopting a strategy of inancial self-reliance.
The decision to establish a single authority to supervise the entire inancial sector has now been delayed for almost 11 years. The draft law currently under discussion suggests that the central bank has no intention of giving up its role as supervisor of the banks. This means there would be wasteful and confusing duplication of that function in the new authority. In any case, it remains unclear exactly what purpose the authority’s establish-ment is intended to achieve.
POLITICAL DEVELOPMENTS
Although the popularity of President Susilo Bambang Yudhoyono (SBY) remains remarkably high, there is little doubt that it is waning. The general public – or, at least its more sophisticated, urban-based members – are increasingly conscious of the gap between government rhetoric and action. According to a poll by the Indonesia Survey Institute, the government’s overall approval rating fell from 85% in July 2009 to 63% in December 2010 (The Economist, 14/1/2011). Aside from their concerns about prices, unemployment and poverty, only 51% of respondents were satisied with the government’s efforts to ight corruption, compared with 84% previously. A strong contributor to this turnaround has been a protracted corruption saga involving a relatively low-ranking tax oficial, Gayus Tambunan. The story began in July 2009, when Gayus was found to have over $3 mil-lion in his bank accounts, and was named as a money-laundering suspect.1 His
assets were initially frozen by the police, but then somewhat surprisingly unfro-zen in late November. In March 2010 the Tangerang district court cleared him of the charges laid against him, but shortly afterwards the former chief of detec-tives, Susno Duadji, implicated two other police generals as ‘case brokers’ who had helped to secure Gayus’s acquittal (Baird and Wihardja 2010: 145). Gayus travelled to Singapore shortly afterwards but was persuaded in September to return to Jakarta, where he was immediately re-arrested and put on trial for a second time. Despite his repeated claims to have received payments from three large companies associated with the Golkar Party chair, Aburizal Bakrie,2 Gayus
was charged only with mishandling the tax affairs of a small, unrelated company. Although supposedly in detention during the period of his second trial, he was photographed at a tennis tournament in Bali in November, following which nine oficers from the Police Mobile Brigade were investigated. Later it emerged that Gayus had been allowed to leave prison on scores of occasions, on one of which he had travelled overseas on a false passport. He testiied that he had received millions of dollars in bribes and fees from more than 150 individual and corporate taxpayers, yet he was eventually found guilty only of having bribed a judge and other law enforcement oficials to secure his original acquittal, thus leaving unre-solved his own admissions of corrupt dealings with wealthy taxpayers. He was sentenced to just seven years in gaol, and ined Rp 300 million (roughly 1% of the amount that had been discovered in his bank deposits).3
The Gayus case seems to have conirmed the public’s worst fears about the inef-fectiveness of the government’s campaign to reduce corruption. It demonstrated that, despite the efforts of the reformist former inance minister, Sri Mulyani Indra-wati (McLeod 2008: 197–201), the tax ofice remained far from free of corruption. The fact that Gayus named Bakrie group companies as among those he had assisted with their tax affairs added to concerns voiced at the time of the strong campaign to oust Sri Mulyani (Patunru and Von Luebke 2010: 12). That he had managed to secure his original acquittal by using high police oficials to bribe the judici-ary reinforced the public’s low opinion of the various law enforcement agencies.
His apparent capacity to bribe his way out of prison at any time added to public disgust that Artalyta Suryani, also convicted of corrupt behaviour, had served her prison term in a luxurious cell resembling a presidential suite, and was released after serving only two-thirds of her original sentence (Jakarta Post, 29/1/2011).4
That he had no trouble acquiring a false passport suggested strongly that cor-ruption extended to the immigration ofice in the Ministry of Justice and Human Rights (Jakarta Globe, 20/1/2011). Of particular concern was the widespread per-ception that many ‘big ish’ – higher-level oficials and business tycoons seem-ingly involved in the same web of corruption as Gayus – appeared untouchable.
In this context, in early January 2011 a meeting of a kind that has become com-mon in recent years was held under the banner ‘Fight Government Lies’. In what appears to have been a rather rambling discussion, a number of prominent reli-gious leaders and activists for the most part emphasised their own views or pro-moted their own ideologies, rather than providing evidence of government lies. Initially this event seemed to arouse little interest, and might well have disap-peared quickly from view, except that the lying accusation ‘sparked an angry back-lash from senior cabinet ministers’ (Jakarta Globe, 19/1/2011). As a consequence, the president met with the group behind closed doors about a week later. This succeeded only in fuelling the controversy, encouraging many other commenta-tors to add their voices to the original criticisms, so that subsequent reporting resulted in an even longer list of concerns about the government’s performance.
Rather than ‘lies’, most items on this list can be thought of as ‘discrepancies between the government’s words and actions’ (Jakarta Globe, 19/1/2010, quoting a spokesman for the group). They fall in four main areas.
• Protection of citizens: that is, failure to support the constitutional requirement for freedom of religion and, speciically, to protect religious minorities from attack by extremists;5 failure to overcome the threat of terrorism; failure to defend
freedom of speech and of the press (in the face of attacks on journalists) (Basorie 2011); failure to act in relation to the murder of human rights activist Munir (McLeod 2005: 134); failure to protect Indonesian migrant workers (who are vulnerable to ill treatment by their employers overseas); and failure to protect the interests of victims of the Lapindo mudlow disaster (McMichael 2009). • Improvement in transparency and accountability: that is, failure in general to fulil
the promise of clean, well-behaved and ethical politics, and speciically to explain clearly the circumstances in which Sri Mulyani resigned as inance minister to join the World Bank (Baird and Wihardja 2010: 144–6).
• Reduction of corruption: that is, failure to make suficient progress in eradicating corruption; to make any headway against the ‘judicial maia’; and properly to investigate cases in which high-ranking police oficials had been found to have large sums of money in their bank accounts.
• Reduction of poverty: that is, failure to reduce poverty (or to reduce it as much as promised).
4 Sentence remissions for good behaviour are common in Indonesia.
To this list may be added an assortment of other concerns, such as failure to protect the environment, failure to manage the economy in the manner supposedly called for by the Constitution, the alleged take-over of Indonesia’s natural resources by foreign players, and even sexual promiscuity among teenagers (Jakarta Globe, 23/1/2010).
At a national working meeting with district heads, cabinet ministers and other oficials in Jakarta on the same day as the meeting of religious leaders and activ-ists, the president outlined 10 ‘achievements’ of 2010 and 10 ‘challenges to be faced’ in 2011. For the most part, the latter could also have been described, less charitably, as performance shortfalls of SBY’s presidency to date. Notable for its absence was any mention of the need for better protection of citizens, other than migrant workers. Some of the ‘challenges’ bore close resemblance to the concerns of the other group: embezzlement and corruption, including in the tax ofice; damage to the environment as a consequence of mining and forestry practices; the increasing prevalence of money politics, which could harm democracy; and various public services not working well – including education and health, and services speciically targeted at the poor. Several additional challenges were men-tioned, however: the danger posed by large increases in global food and energy prices; the inadequacy of infrastructure; the problem of large budget subsidies and evident shortcomings in using the budget to stimulate growth; obstacles to investment; and lack of readiness to deal with natural disasters. By acknowledg-ing these problems without demonstratacknowledg-ing an intention to do more than exhort those present to strive to overcome them, the president succeeded only in remind-ing his critics of what they see as his propensity to promise more than he is able to deliver. As Patunru and Von Luebke (2010: 24–7) showed in relation to the ‘First 100 Days Program’, careful assessment of claims of progress and achieve-ment typically shows them to be overstated. Opinion polls now suggest that such claims are becoming less and less convincing to the general public.
MACROECONOMIC DEVELOPMENTS Growth
private consumption is currently more than twice as large as investment (in 2000 prices) means that if its growth falls to, say, 0.5% below GDP growth, investment growth would need to accelerate to more than 1.0% above GDP growth for the latter to be sustained (assuming, for simplicity, that the other demand categories – government consumption and net exports – are growing at the same rate as GDP). In reality, investment spending was the only major demand category consistently to grow faster than GDP during 2010, and only its acceleration over the last six quarters has prevented economic growth from falling.
The optimistic notion that careful manipulation of government spending can be used to offset the largely unpredictable business cycle becomes untenable in the face of the enormous volatility of year-on-year growth rates of government consumption evident in these data. Clearly, there is still a long way to go before it will be feasible to use iscal policy as an effective stabilising macroeconomic inluence. Many observers ind cause to celebrate in the rapid growth of exports in 2010, but imports follow a very similar growth pattern, providing an opposite
TABLE 1a Components of GDP Growth (2000 prices; % year on year)
Sep-09 Dec-09 Mar-10 Jun-10 Sep-10 Dec-10
Gross domestic product (GDP) 4.2 5.4 5.6 6.1 5.8 6.9
By expenditure
Private consumption 4.7 4.0 3.9 5.0 5.2 4.4
Government consumption 9.8 18.0 –7.6 –7.3 4.8 7.3
Investment 3.2 4.1 8.0 8.0 9.2 8.7
Construction 7.7 8.1 7.3 7.2 6.8 6.7
Machinery & equipment –12.7 –3.7 7.2 14.0 23.8 22.5
Transport –2.0 –16.3 22.3 9.4 8.5 1.7
Exports –7.8 3.7 20.0 14.6 9.6 16.1
Imports –14.7 1.6 22.6 18.4 12.2 16.9
By sector
Tradables 2.7 4.4 3.5 4.0 3.3 4.7
Agriculture, livestock, forestry &
isheries 3.4 4.1 3.0 3.1 1.8 3.8
Mining & quarrying 6.3 5.3 3.1 3.9 2.7 4.2
Manufacturing 1.3 4.3 3.9 4.5 4.3 5.3
Non-tradables 5.6 6.2 7.6 8.1 8.2 8.8
Electricity, gas & water supply 14.9 14.9 8.8 5.1 3.4 4.3
Construction 7.7 8.1 7.3 7.2 6.8 6.7
Trade, hotels & restaurants –0.1 3.7 8.6 9.1 8.7 8.4
Transport services 7.6 6.8 5.1 6.2 6.6 9.3
Communication 22.9 16.6 16.9 17.8 17.8 19.8
Financial, rental & business services 4.9 3.8 4.8 5.6 5.9 6.3
Services 6.1 5.8 4.7 5.3 6.4 7.5
impact of comparable magnitude on GDP growth. Net exports actually had a slightly negative impact throughout 2010.
From the supply perspective, output of the tradables sectors collectively con-tinued to grow at less than half the rate of non-tradables, on average, during 2010 (table 1a). Manufacturing performed somewhat better over the last year than both the agriculture, livestock, forestry and isheries group and mining and quarrying. Like private consumption on the demand side, however, manufacturing is still holding back GDP growth, notwithstanding some acceleration during the year. By contrast, most of the non-tradables sectors have recently been growing faster than, or about as fast as, total GDP; the exception is the small utilities sub-sector (that is, electricity, gas and water supply). By far the largest component of the non-tradables sector is trade, hotels and restaurants, growth of which has averaged nearly 9% p.a. during 2010.
The seasonally adjusted quarter-on-quarter growth data for selected compo-nents of GDP (table 1b) present much the same picture as the year-on-year data. The deceleration of private consumption growth toward the end of the period
TABLE 1b Components of GDP Growth
(2000 prices; seasonally adjusted; % quarter on quarter, annualised rates)
Sep-09 Dec-09 Mar-10 Jun-10 Sep-10 Dec-10
By expenditure
Private consumption 4.5 4.2 5.2 5.6 4.8 2.6
Government consumption –10.5 16.2 –27.4 8.3 30.1 17.3
Investment
Construction 8.7 7.3 6.5 7.2 6.7 7.2
Machinery & equipment –0.2 26.8 12.1 18.9 44.0 16.7
Transport 11.5 –9.5 42.7 –11.4 20.7 –15.6
Exports 41.1 28.5 –14.5 11.2 18.3 61.7
Imports 41.7 22.3 –9.0 24.8 14.0 44.4
By sector
Tradables 5.7 2.4 2.6 5.9 3.3 5.4
Agriculture, livestock, forestry &
isheries 5.1 1.8 2.9 3.2 2.1 3.9
Mining & quarrying 8.5 1.4 2.1 6.2 2.5 2.8
Manufacturing 5.1 3.0 2.6 7.3 4.3 6.9
Non-tradables 8.0 7.5 6.7 10.3 8.5 9.7
Electricity, gas & water supply 9.3 6.8 –1.7 6.4 2.8 9.8
Construction 8.3 7.5 6.5 7.0 6.9 7.0
Trade, hotels & restaurants 8.6 12.4 6.2 9.4 7.0 10.9
Transport services 6.6 2.8 2.6 13.1 8.4 13.3
Communication 21.7 7.9 18.1 24.1 21.6 15.6
Financial, rental & business services 4.9 3.8 6.6 7.1 6.1 5.4
Services 3.1 4.6 4.2 9.4 7.5 9.0
shows up even more clearly on this basis, commencing in Q3 2010. The growth rate of construction – the major component of investment spending – was quite high and remarkably steady for the whole period shown in the table, whereas the growth rates of the machinery and equipment and transport components were very volatile. Export and import growth showed extreme volatility, and it is noticeable that net export growth actually became increasingly rapid during the second half of 2010, helping to offset the dampening impact of decelerating pri-vate consumption. On the supply side, all of the non-tradables sub-sectors grew strongly in Q4 2010. Not too much should be made of this, however, because there is considerable volatility from one quarter to the next.
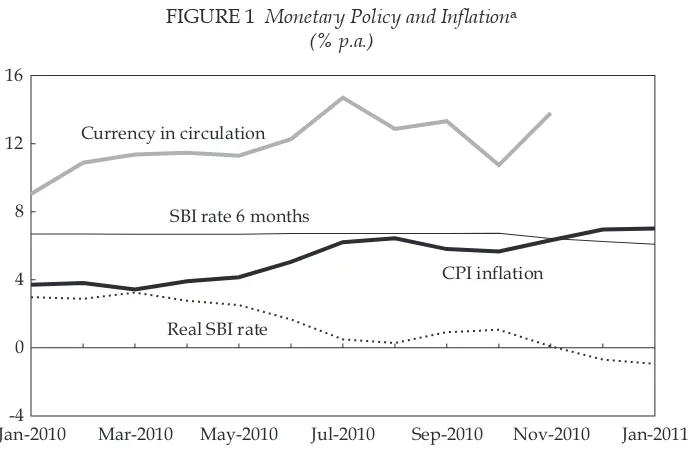
Monetary and exchange rate policy and inlation
Central Statistics Agency data for December 2010 conirmed that inlation ended the calendar year outside the central bank’s target range of 4–6% p.a., with the rate inishing fractionally below 7% (igure 1). Much was made of an accelera-tion in January 2011 to just over 7%, but the increase was negligible given likely measurement errors. Inlation was quite steady for the six months to January, even if a little above the target range. Its level is a disappointing outcome rather than a major problem. The acceleration of inlation in Q2 2010 and its subse-quent stabilisation is consistent with the growth of the central bank’s monetary liabilities (proxied here by currency in circulation), which declined signiicantly Jan-2010 Mar-2010 May-2010 Jul-2010 Sep-2010 Nov-2010 Jan-2011
-4 0 4 8 12 16
Currency in circulation
SBI rate 6 months
CPI inflation
Real SBI rate
FIGURE 1 Monetary Policy and Inlationa
(% p.a.)
a Currency in circulation is used as the indicator of money supply in preference to base money because of the distorting impact of occasional changes in banks’ minimum reserve requirements on the effective supply of base money; currency is the major component (about 75%) of base money. The growth rate shown has been smoothed based on 3-month moving averages to clarify the underlying
trend. The real SBI (Bank Indonesia Certiicate) rate is approximated by the nominal rate less the con
-temporaneous CPI (consumer price index) inlation rate.
from the excessive peak in July 2010. It is a matter of concern, however, that this tightening of monetary policy was not sustained through the end of the year – as is also indicated by the reduction in the six-month Bank Indonesia Certiicate (SBI) rate, and by the real SBI rate remaining negative.
In any event, Bank Indonesia (BI) responded to concerns about its performance by raising its so-called ‘policy rate’ slightly, from 6.5% to 6.75%, in February 2011. What this means for actual interest rates in the market can only be guessed at, how-ever. The ‘policy rate’ has been often, though not always, identical with the 30-day SBI rate, but BI no longer issues 30-day SBIs. In its 9 February auction, for example, it issued only nine-month SBIs, so the yield on that instrument was the only con-crete indicator of the actual stance of monetary policy at the time of writing.6 The
average yield was 6.71% – higher than the level in January (6.5%) but close to the level in November, and lower than the new ‘policy rate’. In any case, since longer maturity certiicates generally carry somewhat higher rates, the switch to longer maturities implies that the policy rate increase may be more apparent than real.
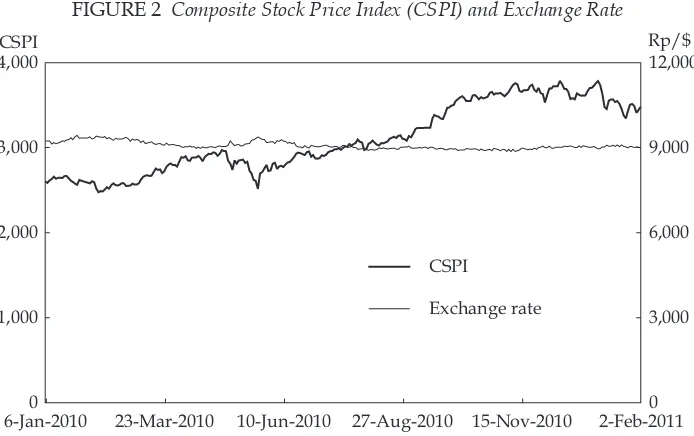
Monetary policy and inlation outcomes continue to be driven largely by BI’s commitment to keeping the exchange rate at about Rp 9,000/$. It has done this very successfully, especially since mid-2010 (igure 2). The problem is that this has required it to continue purchasing large quantities of foreign exchange in the market. These purchases increase BI’s monetary liabilities (base money) and this, in the absence of sterilisation, tends to cause inlation. Mindful of the problem, BI has issued a large quantity of SBIs – although not enough to keep money growth down to a level consistent with sustained low inlation, as we have just seen. BI’s reluctance to issue even more SBIs presumably stems partly from the impact on its own balance sheet and proitability. Speciically, its interest earnings on foreign
6 Figure 2 shows the six-month SBI rate, since nine-month SBIs were rarely issued in 2010. 6-Jan-20100 23-Mar-2010 10-Jun-2010 27-Aug-2010 15-Nov-2010 2-Feb-2011 1,000
2,000 3,000 4,000
0 3,000 6,000 9,000 12,000
CSPI
Exchange rate
CSPI Rp/$
FIGURE 2 Composite Stock Price Index (CSPI) and Exchange Rate
exchange reserves are signiicantly lower than the interest paid to holders of SBIs. Towards the end of 2010, the negative spread between the yield on reserves and that on SBIs appeared to be about 4% p.a.7 With outstanding SBIs of around
Rp 340 trillion toward the end of 2010, the implied loss on this part of BI’s balance sheet (that is, reserves funded by SBIs) was running at about Rp 13.6 trillion – or $1.5 billion – annually.
BI has recently changed the banking regulations so as to increase signiicantly the minimum amounts of deposits the commercial banks are required to keep with it (BI Regulation No. 12/19/PBI/2010). This resulted in a huge Rp 266 trillion jump in such deposits between September and November 2010. These deposits are, in effect, a compulsory loan from the banks to BI, and have the same monetary impact as the issue of SBIs in the same amount. Since they are compulsory, however, BI is able to pay a low interest rate, and then only on a small portion of these deposits. In this manner, some of the cost of maintaining its current monetary and exchange rate policies is transferred to the banks – and through them to the wider community – in the form of some combination of higher lending rates and lower deposit rates. The cost to BI would also have been even higher but for the fact that the government has continued to issue bonds well in excess of the gap between its spending require-ments and its revenues. As a consequence, government deposits with BI increased by Rp 64 trillion in the 12 months to November 2010, reducing base money by the same amount. The implication of this was that the government was bearing part of the hidden inancial cost of keeping the exchange rate constant. As Arman (2010) has pointed out, the huge interest cost to the government of outstanding debt well in excess of inancing requirements diverts funds that could instead be used to put ‘hundreds of thousands of impoverished children through school’.
Another explanation for BI’s reluctance to issue more SBIs is that to do so would require an increase in interest rates. Besides strong political opposition to such a move, higher interest rates would create an even more attractive arbitrage opportunity for investors willing to accept the exchange rate risk of borrowing in dollars and investing in rupiah. This concern is well founded. With international reserves so high (almost $100 billion), the perceived risk of depreciation of the currency appears small, so it is very tempting for investors to engage in this ‘carry trade’ at the expense of the central bank.8 The strong performance of the stock
exchange during 2010 (igure 2) is one indicator of the attractiveness of this invest-ment strategy. Pushing interest rates higher therefore risks generating higher cap-ital inlow and an even greater need to undertake costly sterilisation. In short, BI is now facing the consequences of trying to maintain an inconsistent combination of prices (inlation), interest rates and exchange rates. Investors appear to be con-scious of the problem BI is facing, which increases perceived risks because of the policy uncertainty it creates. Reversal of the rising trend of stock prices around the end of 2010 may relect this uncertainty.
7 This rough estimate is based on an average SBI rate of around 6.5%, and a yield on US government 10-year bonds of around 2.8%. Shorter maturity bonds have lower yields, and conversely, but the detailed composition of BI’s foreign exchange reserves is not publicly available.
Food prices
Rapid food price increases in recent months have been of particular concern to the government because of their deleterious impact on poverty. The price indices for cereals (including rice), cassava and related products, and for vegetables, rose by over 20% in the year to January 2011, and the index for spices (including chillies) by some 60%. Though many refer to this as an inlation problem, in fact it is not. Inlation is best thought of as a decline in the value of money, relecting generally rising prices. The problem in this case is increases in the relative prices of these products, partly because of unusually large rainfall, and partly because of delay by Bulog (the logistics agency) in importing rice. Tightening monetary policy to try to deal with this problem would reduce inlation, but would not reduce the relative prices in question. Accordingly, the government has instead temporarily removed import tariffs on rice, and on wheat and soybeans, and ordered Bulog to increase rice imports.
The budget
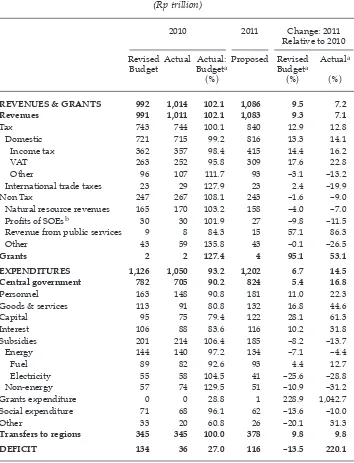
One welcome consequence of public sector accounting reform, under way since 2003 (Kuncoro, Widodo and McLeod 2009: 171), is that data on the budget out-come are now available a few days, rather than a year or two, after the end of the inancial year. The release of preliminary data for 2010 makes it possible not only to compare outcomes with budgeted amounts, but also to undertake a more meaningful assessment of the budget for 2011 (table 2).
Most of the larger revenue items in 2010 came in fairly close to target (column 3 of the table). Revenue overall was a little higher than planned, mainly because of higher than expected non-tax revenues. By contrast, central government expendi-tures in most categories fell well short of the budgeted amounts. Some of the details here are rather surprising. In keeping with the view that fear of being accused of corruption has made oficials with procurement responsibilities overly cautious, realised spending on both goods and services and capital items was only about 80% of the planned totals. But this consideration does not apply in the case of spending on personnel, which also fell noticeably short of budget. This is hard to compre-hend, given that personnel numbers, ranks and remuneration would all appear to be highly predictable. The much lower than planned amount of interest payments, while welcome, is also surprising, given that interest rates have not changed mark-edly, and that the debt maturity proile is not subject to uncertainty. The reason for the unexpectedly large amount of spending on non-energy subsidies is unclear.
The last two columns in the table show that it can be quite misleading to base estimates of the extent of iscal stimulus (or contraction) on a comparison of the new budget with the planned rather than the realised budget for the previous year (although, of course, there is no simple alternative until the realised data become available). Several of the igures in these two columns differ substan-tially from each other. Noteworthy among these are the implied growth rates for VAT revenue, and for the major central government expenditure items, including interest payments.
shortfalls in 2010, and in the absence of any known policy changes – that spend-ing on personnel, goods and services and capital items will increase by 22%, 45% and 61% respectively: the corresponding rises in 2010 were only 16%, 13% and –0.5%. The level of energy subsidy payments depends crucially on movements
TABLE 2 Budgets for 2010 and 2011
REVENUES & GRANTS 992 1,014 102.1 1,086 9.5 7.2
Revenues 991 1,011 102.1 1,083 9.3 7.1
Tax 743 744 100.1 840 12.9 12.8
Domestic 721 715 99.2 816 13.3 14.1
Income tax 362 357 98.4 415 14.4 16.2
VAT 263 252 95.8 309 17.6 22.8
Other 96 107 111.7 93 –3.1 –13.2
International trade taxes 23 29 127.9 23 2.4 –19.9
Non Tax 247 267 108.1 243 –1.6 –9.0
Natural resource revenues 165 170 103.2 158 –4.0 –7.0
Proits of SOEsb 30 30 101.9 27 –9.8 –11.5
Revenue from public services 9 8 84.3 15 57.1 86.3
Other 43 59 135.8 43 –0.1 –26.5
Grants 2 2 127.4 4 95.1 53.1
EXPENDITURES 1,126 1,050 93.2 1,202 6.7 14.5
Central government 782 705 90.2 824 5.4 16.8
Personnel 163 148 90.8 181 11.0 22.3
Goods & services 113 91 80.8 132 16.8 44.6
Capital 95 75 79.4 122 28.1 61.3
Interest 106 88 83.6 116 10.2 31.8
Subsidies 201 214 106.4 185 –8.2 –13.7
Energy 144 140 97.2 134 –7.1 –4.4
Fuel 89 82 92.6 93 4.4 12.7
Electricity 55 58 104.5 41 –25.6 –28.8
Non-energy 57 74 129.5 51 –10.9 –31.2
Grants expenditure 0 0 28.8 1 228.9 1,042.7
Social expenditure 71 68 96.1 62 –13.6 –10.0
Other 33 20 60.8 26 –20.1 31.3
Transfers to regions 345 345 100.0 378 9.8 9.8
DEFICIT 134 36 27.0 116 –13.5 220.1
a Ratios and rates of change are calculated using unrounded data. b SOE = state-owned enterprise.
in the world oil price, which is assumed in the 2011 budget to be $80 per barrel (Thee and Negara 2010: 290). At the time of writing the actual igure was more like $95 per barrel, but the government was resisting calls to change this assump-tion (Jakarta Globe, 4/2/2011). Given the obvious reluctance of the Coordinating Minister for Economic Affairs, Hatta Rajasa, to allow fuel and electricity prices to rise (Jakarta Globe, 4/1/2011), it seems unlikely that energy subsidies will, in fact, decline in 2011.
The 2011 budget is predicated on assumed growth of 6.3% and inlation of 5.3%, which is equivalent to roughly 12% growth in nominal GDP. With the above comments in mind, government expenditure is likely to grow by much less than the planned 14.5%, and quite possibly by less than GDP itself, suggesting that any expansionary impetus to the economy will have to come from somewhere other than government spending. Moreover, continued rapid growth in income tax and VAT revenues is likely to have a negative impact on private sector spending. In short, the budget is unlikely to have a stimulatory impact in 2011.
Limiting fuel subsidies
The government is aware of the huge proportion of its natural resource revenues that is being dissipated in subsidies to the consumption of fuel and electricity, which accounted for over 13% of total government spending in 2010. It also under-stands the negative implications for income distribution – given that these subsi-dies low disproportionately to the wealthy and the middle class. One approach to limiting these subsidies has been to reduce signiicantly the subsidy to high-octane petrol (Pertamax), the price of which now varies with changes in the world oil price. It has become obvious, however, that even reasonably well-off individu-als are prepared to continue purchasing lower-octane fuel (Premium), in order to beneit from the heavy subsidy. Rather than risk a public backlash by reducing or removing the subsidy to the latter, the government proposes to restrict the use of Premium to motor cycles and public transport vehicles (Jakarta Globe, 14/12/2010). Privately owned four-wheel vehicles are to be required to use Pertamax as from the end of March. The policy is to be introduced in stages, beginning with Jakarta, later extending to the rest of Java, and by 2013 covering the whole of Indonesia. Immediate introduction of the scheme nationwide appears to be precluded by a lack of separate storage tanks for Pertamax in illing stations, and by the limited capacity of the state oil company, Pertamina, to produce this type of fuel (Jakarta Globe, 8/2/2011). From a political point of view there is a certain logic to removing the subsidy from petrol used in cars but not from that used in motor cycles, since there are about ive times as many motor cycle owners (well over 50 million) as car owners. Critics of this proposal point to the obvious opportunity it creates for arbitrage. It is not dificult to imagine the emergence of a black market in which ways will be found to divert the cheaper Premium fuel to privately owned motor cars, thus limiting the effectiveness of the new policy.
The return of discretionary taxes
introducing new technology and having strategic value to the economy’ – may now be granted unspeciied special income tax treatment. It is virtually impos-sible to provide meaningful operational deinitions of criteria such as these. The only likely effect of the regulation is to provide a new set of opportunities for mutually beneicial arrangements between irms and tax oficials at the expense of the general public.
EXPORT TRENDS: A LONGER-TERM PERSPECTIVE
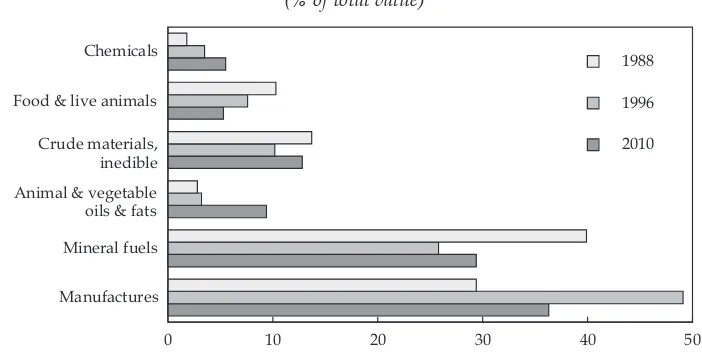
In the early 1990s, before the Asian inancial crisis (AFC), Indonesia’s exports typically contributed 26–27% of GDP. Their contribution rose substantially after the crisis – averaging around 40% during 1999–2001 – but has since slipped back fairly steadily, falling somewhat below pre-AFC levels to about 24% since early 2009. The composition of exports has also altered quite dramatically over the last two decades or so. Figure 3 shows the changing contribution of the six main export categories to total exports between 1988 and 2010.9 Over this full period,
three of these categories declined in importance and three increased, although the direction of change before and after the AFC was reversed in some cases. Exports of manufactures increased their share dramatically to 1996, only to fall away again subsequently, though still recording a net increase over the full period. The rapidly expanding share of animal and vegetable oils and fats since the AFC is particularly noteworthy, as is the declining importance of mineral fuels (oil, gas and coal).
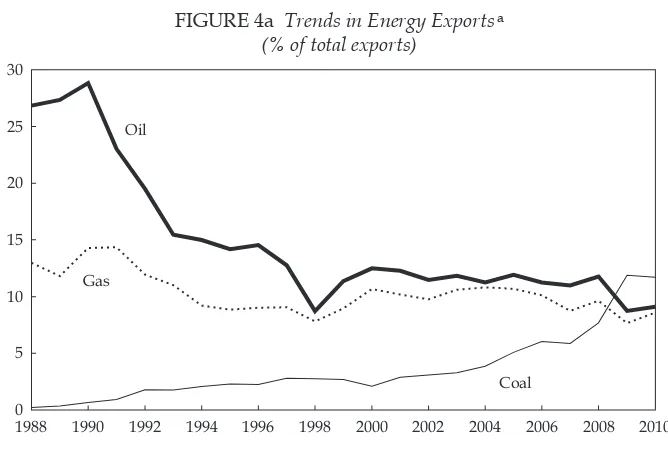
Turning to the components of the major categories, we see that exports of oil (that is, petroleum and petroleum products) have plummeted by about two-thirds since 1990, while those of gas have been fairly stagnant since about 1994
9 In the following discussion, data for 2010 refer to the year to October. Manufactures
Mineral fuels Animal & vegetable oils & fats Crude materials, inedible Food & live animals Chemicals
0 10 20 30 40 50
2010 1996 1988
Animal & vegetable oils & fats Crude materials, inedible
FIGURE 3 Change in Export Composition, 1988–2010a
(% of total value)
a 2010 data are for the year to October.
(igure 4a). To some extent this is explained by the depletion of known reserves, but certain government policies have also had an impact (Lindblad and Thee 2007: 22–3; Boyd et al. 2010). In contrast, exports of coal have expanded dramati-cally from almost negligible amounts in 1988; coal became Indonesia’s single big-gest export in 2009 (accounting for 12% of the total), having overtaken both oil and gas in that year.
Figure 4b shows trends in the key non-energy natural resource exports. Clearly the outstanding performer is vegetable oil and fats. This category is dominated by palm oil, and has grown from less than 2% of the total in the early 1990s to over 9% in 2010, with nearly all of this expansion occurring in the period since 2001. The only other category in this group to have expanded its share is metalliferous ores and metal scrap, which grew to about 5–6% of the total in the late 2000s from about 3% on average previously. Rubber exports have varied cyclically without any clear trend over time, while other traditional exports in the coffee, tea, cocoa and spices group have tended to decline, as have those of seafood.
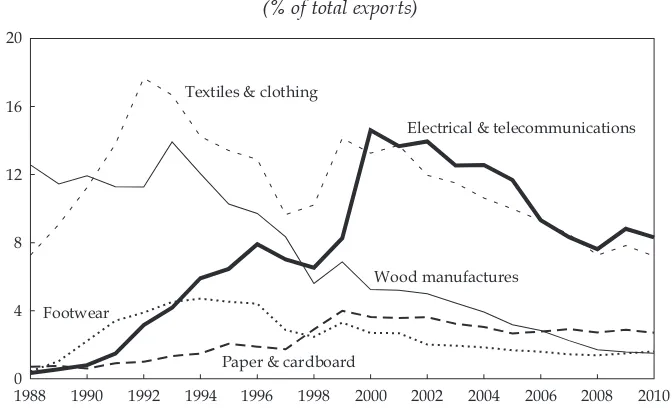
The performance of Indonesia’s key manufactured exports is shown in igure 4c. The contribution of these categories to total exports has declined over the last dec-ade, in contrast to the pattern of performance in the early to mid-1990s. Exports of textiles and clothing had expanded rapidly until 1992 – leading Hill (1991) to proclaim that ‘the emperor’s clothes can now be made in Indonesia’ – but they began to decline almost as rapidly thereafter; there was a brief resurgence follow-ing the AFC, but this was not sustained (Thee 2009a). The concern that ‘if textile and garment exports lounder, it is unlikely that Indonesia will be able to engineer a strategy of rapidly growing and broad-based non-oil exports’ (Hill 1991: 90) has not been borne out. Exports of wood (mainly plywood) manufactures had been as important as those of gas in the late 1980s, because of the costly log
1988 1990 1992 1994 1996 1998 2000 2002 2004 2006 2008 2010 0
5 10 15 20 25 30
Oil
Gas
Coal
FIGURE 4a Trends in Energy Exportsa
(% of total exports)
a 2010 data are for the year to October.
export ban introduced in 1981 (Lindsay 1989), but their contribution to the total declined rapidly from the peak in 1993, and then somewhat less rapidly beyond the AFC (Thee 2009b). Footwear had seemed a promising export category in the early 1990s, but its contribution stagnated from around 1994 and has continued to decline since then. The share of paper and cardboard exports had risen to almost
1988 1990 1992 1994 1996 1998 2000 2002 2004 2006 2008 2010 0
3 6 9 12
Vegetable oil & fats
Crude rubber
Metalliferous ores & metal scrap
Coffee, tea, cocoa & spices
Seafood
FIGURE 4b Trends in Non-Energy Natural Resource Exportsa
(% of total exports)
a 2010 data are for the year to October.
Source: CEIC Asia Database.
1988 1990 1992 1994 1996 1998 2000 2002 2004 2006 2008 2010
0 4 8 12 16 20
Electrical & telecommunications Textiles & clothing
Wood manufactures Footwear
Paper & cardboard
FIGURE 4c Trends in Key Manufactured Exportsa
(% of total exports)
a 2010 data are for the year to October.
4% by the turn of the century, but declined a little subsequently. Electrical and telecommunications products grew from a negligible level in 1988 to become the largest sub-category of exports in 2000, only to fall back again in the following years. Nevertheless, with a share over 8% in 2010, this group continues to be one of Indonesia’s main export categories.
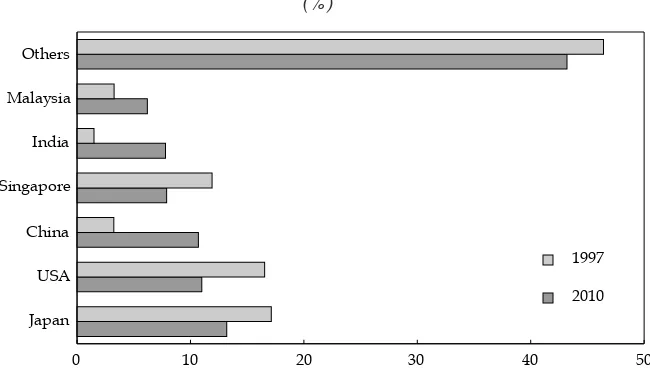
Like commodity shares, the destinations of Indonesia’s exports have under-gone signiicant change since the AFC. Oil and gas exports are concentrated on a very few countries, among which Japan continues to dominate (igure 5a).
FIGURE 5a Country Shares of Indonesian Oil and Gas Exportsa
(%)
Japan
South Korea China Singapore Australia Malaysia Others
0 10 20 30 40 50
2010 1997
a 2010 data are for the year to October.
Source: CEIC Asia Database.
FIGURE 5b Country Shares of Indonesian Non-oil and Gas Exportsa
(%)
a 2010 data are for the year to October.
Source: CEIC Asia Database. Japan
USA China Singapore India Malaysia Others
0 10 20 30 40 50
Nevertheless, Japan’s share has declined signiicantly, while those of Singapore and Malaysia have markedly increased. Non-oil and gas exports are much more widely diversiied as to destination, with only six countries accounting for indi-vidual shares in 2010 in excess of 6% of the total (igure 5b). The USA, Singa-pore and Japan have all witnessed large declines in their shares of the total, while there have been rapid expansions in the shares of China, India and Malaysia. The collective share of all countries other than those shown also declined somewhat to about 43% of the total in 2010. The already quite small shares of European countries have, almost without exception, declined or remained at very low lev-els during the period under consideration, while the reverse is true of the larger developing economies in East and South Asia. Broadly speaking then, Indonesia seems to have been very successful in harnessing rapidly growing demand from the most dynamic performers in the global economy.
RETHINKING CITY MANAGEMENT
The previous survey raised the issue of congestion in Jakarta (Thee and Negara 2010: 304–6), and made brief mention of the president’s proposal for a new capital or a new administrative capital as possible solutions to the congestion problem. Implicit in such suggestions is the notion that congestion is a problem only in Jakarta, which ignores the realities of daily life in other large cities such as Sura-baya, Bandung and Medan. As for the idea of shifting government departments and agencies out of Jakarta to some new site, sufice it to say that even if this ambi-tious notion were to be realised, the immense problems of Jakarta itself, and of the other large cities, would remain, since most of their residents and workers seek their livelihoods in the private sector. By way of illustration, the establishment of the ‘government city’ of Canberra as Australia’s capital, arguably a success in itself, has done virtually nothing to diminish congestion in the pre-existing large cities of Sydney and Melbourne.10
The underlying problem needs to be interpreted much more widely, however, as one of poor management of cities. Indonesia’s larger cities all suffer from trafic congestion and the directly related inadequacy of public transport, but all of its cities face many other problems as well.11 Their inhabitants lack access to
high-quality drinking water and sewerage systems. Their drainage systems are fre-quently overwhelmed by surface run-off from heavy rain, while in some cases their sub-surface aquifers are being depleted by pumping in response to the lack of piped water; in turn, ground-water depletion results in subsidence of the ground surface (Thee and Negara 2010: 305). Public areas are poorly maintained, and efforts to establish and maintain trees, bushes and ground-cover plants are lim-ited and sporadic at best. Road surfaces deteriorate quickly – not least as a result of looding – and repairs are subject to long delays. Garbage is often disposed of in the street and in rivers and canals, reducing amenity and increasing lood risk; to the extent it is collected there are gross inadequacies in subsequent handling, occasionally resulting in loss of life (McLeod 2005: 149). The absence of sewerage systems results in the spread of disease through contaminated ground-water and
10 This was not the planners’ intention, of course.
rivers. Electricity supply is often interrupted because of inadequate generation capacity, transmission and distribution limitations and equipment failure. Finally, the higher-level education and health care services that are available only in cities leave much to be desired, leading many better-off families to seek such services in other countries where standards are much higher.
All of these deiciencies have similar causes, as we shall show below. If policy makers fail to understand this, and therefore to comprehend why existing cities perform their many functions so poorly, creating a new capital is less likely to solve problems than to replicate them.
The city as a means of poverty alleviation
Sound management of cities is obviously crucial from an eficiency perspective, because they generate a large and increasing proportion of economic output, and are home to a large and increasing proportion of the population. The services cities provide are critical to modernising the economy and increasing incomes. Perhaps less obviously, the city is also a vital potential contributor to poverty reduction.
We can identify two broad approaches to reducing poverty. The irst and per-haps most obvious – at least to non-economists – is by way of handouts and sub-sidies. In Indonesia these take many different forms: along with cash transfers to poor families there are subsidies to education, health care, loans, rice, fuel, electric-ity, public transport, irrigation, drinking water and urban services. In some cases (such as cash transfers and cheap rice) the subsidies are targeted (by no means perfectly) to the poor, while in others (such as fuel and electricity) they are avail-able to the general population and thus are extremely wasteful and ineficient. Another form of (non-budgetary) handouts to the poor involves allowing them to make use of public land, both for housing and for petty commercial activity, free of charge – for example, alongside railway lines, roadways and watercourses.
A disadvantage of this approach to helping the poor is that it tends to foster an attitude of dependence on the state and a sense of entitlement to services and the use of public assets. In addition, the effectiveness and sustainability of this approach always depend on the political process: if the iscal cost becomes too high, the subsidies will be reduced, if not entirely removed. Thus, although pov-erty can be reduced in the short term by income redistribution (that is, by way of handouts and subsidies to the poor, paid for by others), it is dificult to achieve much in the longer term by this means.
The other broad approach to poverty alleviation involves boosting demand for the labour of people with low skills. In contrast to the irst approach, this requires no diversion of iscal resources away from productive investments – particularly in infrastructure – and no taxation of other individuals. It is therefore likely to be more sustainable because it does not generate much political opposition.
personnel; receptionists; administrative assistants; and so on. Cities not only offer vast and highly varied employment opportunities to individuals across the income spectrum: they also beneit the poor in rural areas by providing ‘export’ markets for agricultural produce and supplying ‘imports’ of consumer goods desired by rural households.
The hypothesis advanced here is that the main reason Indonesia’s cities are so dysfunctional is the excessive emphasis on their use as instruments for dispensing subsidies – at best very roughly targeted at the poor – rather than as a means to create more and better jobs. Politically determined user charges for public trans-port, clean water, electricity, hospital care and education are all heavily subsidised, and bear little or no relationship to the costs of provision. And in some cases even heavily subsidised charges are routinely evaded (for example, by those who ride on trains for free, or who make illegal connections to piped water and power lines).
The heavy emphasis on providing subsidies means that few if any of the ser-vices offered by city governments – and in cities by other levels of government – are inancially self-supporting, because the political process limits the funding available to cover them. The consequence is that demand exceeds supply, and equilibrium is achieved by rationing quantity and reducing quality. Electricity supply is frequently interrupted, public transport is overcrowded, public spaces are poorly maintained, piped water is unit for drinking and sewerage systems are non-existent in most areas. Similarly, services such as garbage disposal, stormwater drainage, road maintenance, ‘re-greening’ and security are also inad-equately supplied because the political process again results in user charges and taxes on city land and buildings being set too low to generate enough revenue to cover the costs involved. In short, politically determined budgets reduce both the quality and quantity of services provided, and simultaneously give those respon-sible for their provision a ready – and not entirely unjustiied – excuse for poor performance. Demand for the services of the city, unlike those offered by proit-oriented private sector irms, can rarely be satisied, because those who beneit from them are not expected to cover the cost of their provision.
At the same time, many poor people obtain access to public land, intended for other purposes, without payment to any government agency. It is not only the rich who thumb their noses at land-use regulations. Slum housing is constructed, for example, along railway easements and river banks, and on other vacant land owned by governments. Small businesses such as food stalls, fruit and vegeta-ble sellers, and retailers of clothing, footwear and household supplies operate on what should be sidewalks and parks, and even on the edges of roads and streets, contributing signiicantly to trafic congestion.
From instrument of subsidisation to generator of proits and jobs
is a tangible embodiment of the basic principle that the proit motive effectively generates desirable outcomes, because irms typically cannot make proits if they fail to provide the types of goods and services that people want, at prices they are willing to pay. It relects a different mindset on the part of its management: supply-ing clean water, public transport, education and health care, dispossupply-ing properly of garbage and sewage and providing reasonable levels of security are seen not as unwanted burdens on limited budgets but as opportunities to boost proits by increasing service quantity, improving service quality, or both.
All households and businesses in Karawaci have metered access to water that is safe to drink, and access to a proper sewerage system. ‘Clean’ water is purchased from the local government water supply company and treated further to make it safe for drinking; sewage is properly treated and either recycled as water for plants in public spaces or returned safely to the aquifer, along with stormwater, via a number of lakes on the specially designed local golf course. Individuals live and work in an environment in which land use is reasonably well controlled; where houses and other buildings are safe from the threat of looding; where gar-bage is collected and properly disposed of; where street surfaces are continuously maintained; where persons and property are effectively protected against criminal activity by the city’s own security personnel; and where an extensive re-green-ing program helps lower the ambient temperature signiicantly and results in an attractive urban landscape. Residents have access to schools, a university and a hospital, all seemingly of a high standard. The roads and streets are adequate for the volumes of trafic they carry, and there is ample public transport in the form of buses, minibuses and taxis, supplemented by informal motor cycle taxis (ojek). Village communities around the periphery of Karawaci beneit enormously from the extensive job opportunities created within the city, which is easily accessible – providing a sharp contrast to the daily commuter grind between Jakarta and its hinterland.
None of these beneits is subsidised: all costs are covered by users of the vari-ous services, either through rates levied on commercial and residential property (in addition to rates paid to the local government, for which virtually nothing is received in return), or by user charges (mainly for water and sewerage).12 Students
pay for school and university education, and patients for hospital treatment. Karawaci succeeds where Jakarta and other cities managed by governments fail, for the simple reason that it is not operated as an instrument of income redis-tribution. While its immediate focus is to provide an attractive residential location for the wealthy and, to a more limited extent, for the middle class, in so doing it also generates extensive employment opportunities for the poor – which is by far the more effective means of helping them out of poverty and affording them a sense of self-reliance. Like every successful service provider in the private sector, this city enterprise depends on its ability to discern what its customers want, and to provide this at prices that exceed costs.
The challenge this example poses for conventional city governments is to ind lessons in it that they might be able to apply to their own circumstances. They would do well to think about improving their performance by adopting a strategy
of inancial self-reliance, based on the principle of ensuring that fees, user charges, rates and other revenue sources are set at levels that at least cover the costs of provision of the services in question.13 A more radical approach would be to move
generally in the direction of privatisation. There is no reason why the supply of clean water, the treatment of sewage, the collection and disposal of garbage, and the provision of public transport, education and health care cannot be undertaken by the private sector. All that is needed is an appropriate legal basis for private sector city managers to set their own user charges, fees and rates, such as the developer of Lippo Village has been able to negotiate with the local government.
FINANCIAL SERVICES AUTHORITY
In May 1999, following the implosion of the banking system in 1997–98, parlia-ment enacted Law 3/1999 on Bank Indonesia. Among other things, this called for the establishment of a new institution to undertake supervision of the inancial services sector – including the transfer of bank supervision from BI – by no later than the end of 2002. This writer noted at the time that BI
clearly had great success in opposing the threatened loss of a signiicant part of its operations: a draft law submitted to parliament required the establishment of this new institution 18 months earlier ...
and that
the delay simply provides a great opportunity to those who oppose the new institu-tion to lobby to make the delay permanent (McLeod 1999: 149).
In the event, the deadline was indeed not met, and eventually a revision to the law was enacted in January 2004 that extended the time-frame for a further seven years to the end of 2010. The failure of Bank Century in the midst of the global inancial crisis (GFC) that began in 2008, with its immensely destabilising politi-cal aftermath (Baird and Wihardja 2010: 144), relected poorly on BI’s ability to supervise banks,14 and gave fresh impetus to the task of establishing the new
supervisory body. In mid-June 2010 the president submitted to parliament for ‘top priority’ consideration a draft law on a proposed Financial Services Authority (Otoritas Jasa Keuangan, OJK). However, the 2010 deadline for its establishment also passed without being met. The 11-year delay in implementing this policy decision is cause for concern, but at least this latest slippage provides an oppor-tunity for further discussion of the decision itself, which appears to have been poorly thought out in a number of respects. Such discussion is important, since
13 Thee (2009c) says of China’s economic reform program: ‘[d]evelopment of high quality infrastructure, particularly good transport infrastructure and reliable power supplies, was emphasized, the implementation of which was based on ”full cost recovery”...’.
there is no consensus internationally as to what constitutes best practice in this ield.15 This is well illustrated by the fact that the model chosen for the OJK in the
draft law was the Financial Services Authority in the UK, which failed to prevent the meltdown of the British banking system during the GFC – as a result of which it is now planned to abolish it (Vina 2010).
A irst major law in the draft law is its ambiguity about BI’s own role as visor of the banks. Although the 1999 law stated clearly that the task of super-vising banks would be undertaken by this new institution (art. 34 (1)), it made no attempt to reconcile this with article 24, which stated that ‘Bank Indonesia ... undertakes bank supervision, and imposes sanctions on banks in accordance with the law’; nor was there any attempt to clarify this apparent contradiction when the law was amended in 2004. Indeed, the contradiction became even more stark in the elucidation of the amendments, which stated, among other things, that the
... transfer of the function of bank supervision from Bank Indonesia to the institution for supervision of the inancial services sector is to be undertaken in stages upon fulilment of [various] requirements ... (elucidation of art. 34 (2), emphasis added).
This ambiguity about who is to undertake bank supervision is also apparent in the draft law on the OJK. Clause 2 of article 37 refers to coordination and coopera-tion between the OJK and BI in ‘joint supervision’ of banking, while clause 4 states that BI ‘can undertake direct and/or indirect supervision of banks’. It seems that BI’s presumed opposition to ‘the threatened loss of a signiicant part of its opera-tions’ is real: if the draft law is any indication, BI intends to maintain its present role as bank supervisor. In short, the draft law on the OJK calls not for a transfer of bank supervision from BI to the OJK, as Law 3/1999 on Bank Indonesia stipulates, but rather for a wasteful and confusing duplication of that role in the new author-ity if it is eventually established.
Setting aside the lack of clarity about BI’s role in the future, the second major concern about the draft OJK law is the absence of any substantive indication as to how the establishment of this new authority will lead to better supervision of the inancial services industry. The main parties to negotiation on the new law are BI and the inance ministry, the latter currently being responsible for supervision of the capital market and the non-bank inance industry (encompassing pension funds, insurers, inance companies, pawnbrokers, social security institutions and the like). The intention appears to be to transfer supervisory personnel from BI and these two parts of the inance ministry (jointly referred to as ‘Bapepam–LK’)16
into the new OJK, where they would constitute three separate supervisory sec-tions – each with its own chief executive – reporting to a board of commissioners. There are weaknesses in the present arrangements for the prudential supervision of banks, in particular, and these often relate to inability or unwillingness to track
banks’ close relationships with various non-bank inancial institutions, or to act resolutely when such relationships give rise to unacceptable risks. However, it is unclear how the relocation of supervisory personnel to the new authority is expected to change the way they function. Presumably the argument is that the supervisory groups for banks and non-bank inancial institutions will be able to share relevant information, such that both groups will be better informed as to what is going on in the market. But this should not be taken for granted. Such an outcome might be more likely if the two groups were combined, rather than continuing as separate entities, albeit under one roof. Alternatively, signiicant progress in this direction might be achieved simply by requiring that the inance ministry and BI each have access to the other’s relevant database – perhaps by way of an inter-agency committee with representatives from both organisations. Some experimentation along these lines might yield better results than the more radical OJK proposal now under consideration.
A third concern is lack of clarity about what the new authority is supposed to achieve. Is it intended to avoid large-scale disruption to the economy as a result of widespread failures of inancial institutions, or to protect individuals and organi-sations against misconduct on the part of irms in the inancial services industry (Cooper 2006)? These are quite different objectives, and a strong argument can be mounted for making each the mission of a separate agency, to allow those respon-sible to concentrate on a single primary task. Thus, for example, supervision of the capital market has little in common with prudential supervision of banking, and it is dificult to see what will be achieved by requiring the new authority to divide its attention between the two. Indeed, one of the strong arguments for relieving BI of responsibility for bank supervision is to allow it to devote its full attention to its own sole responsibility according to law – that of maintaining the value of the currency (art. 7. of the Law on Bank Indonesia, as amended). It was precisely the conlict between BI’s dual roles as bank supervisor and guardian of the rupiah that became so problematical in 1997–98 (McLeod 2004). At that time its concern about impending bank failures led it to increase system liquidity enormously in the space of a few months. This resulted in very high inlation and drastic depreciation of the rupiah, yet failed to avoid a bank system meltdown, a severe recession, and consequent losses to the public on an enormous scale.17
THE ERUPTION OF MOUNT MERAPI
October and November 2010 provided new reminders of Indonesia’s vulnerability to natural disasters (BNPB 2010). A lash lood on 5 October in Wasior, West Papua province, killed almost 300 people.18 A tsunami struck the Mentawai Islands in
West Sumatra province on 25 October, resulting in over 500 deaths. And multiple eruptions of Mount Merapi, on the northern border between Yogyakarta Special Region (DI Yogyakarta) and Central Java province, caused almost 400 fatalities. The following discussion focuses on the latter disaster.
17 For an ‘insider’s’ account of this episode, see Djiwandono (2000).
Merapi began to exhibit increased seismic activity from September, culminat-ing in three major eruptions on 25 October.19 There were many further
erup-tions over the next 10 days, with volcanic ash falling as far away as the city of Yogyakarta. By 2 November, lights to both Yogyakarta and nearby Solo had to be suspended or re-routed. By 3 November, deadly pyroclastic lows as hot as 600–800ºC were travelling so far that evacuees had to be relocated to more distant camps. Eruptions larger than any since the 1870s occurred early on 5 November,
19 The discussion here draws heavily on an extremely detailed account of these events on Wikipedia, at <http://en.wikipedia.org/wiki/2010_eruptions_of_Mount_Merapi>.
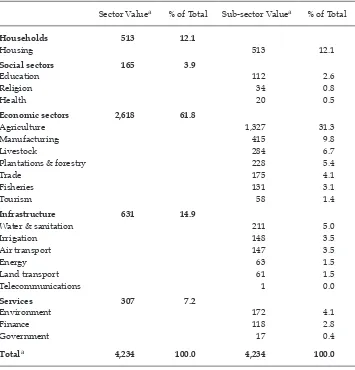
TABLE 3a Estimated Value of Damage by Major Sector (Rp billion)
Sector Valuea % of Total Sub-sector Valuea % of Total
Households 513 12.1
Housing 513 12.1
Social sectors 165 3.9
Education 112 2.6
Religion 34 0.8
Health 20 0.5
Economic sectors 2,618 61.8
Agriculture 1,327 31.3
Manufacturing 415 9.8
Livestock 284 6.7
Plantations & forestry 228 5.4
Trade 175 4.1
Fisheries 131 3.1
Tourism 58 1.4
Infrastructure 631 14.9
Water & sanitation 211 5.0
Irrigation 148 3.5
Air transport 147 3.5
Energy 63 1.5
Land transport 61 1.5
Telecommunications 1 0.0
Services 307 7.2
Environment 172 4.1
Finance 118 2.8
Government 17 0.4
Totala 4,234 100.0 4,234 100.0
a Totals are calculated using unrounded data.
and the oficially declared danger zone was expanded to a radius of 20 km around the mountain as nearby villages were blanketed in a deep layer of ash. Areas that had been hit by the pyroclastic lows were stripped of all vegetation, leaves and branches were incinerated and tree trunks snapped like matchsticks. In the next few days the eruptions began to subside, but only on 3 December was Merapi’s warning status formally lowered from the highest of four levels. Just as earth-quakes tend to have after-shocks, the sting in the tail of Merapi’s eruptions was an ongoing series of destructive lahars.20 These are mudlows generated when
heavy rain falls onto newly deposited volcanic ash on a mountainside, with no vegetation to slow the run-off. They are so powerful that they can carry massive boulders along with them, damaging, if not destroying, all in their path.
Aside from those who died, hundreds more were injured. In addition, the erup-tions wiped out whole villages, along with schools, crops and livestock, and dam-aged roads, bridges and irrigation facilities. Tables 3a and 3b contain estimates of the monetary losses by category and location as at mid-January, although further losses continue to accumulate as a consequence of the lahars. Much of the damage from the eruptions was concentrated in the district of Sleman in DI Yogyakarta, but considerable lahar damage has occurred subsequently in neighbouring dis-tricts in Central Java province.
The local authorities appear to have handled the disaster quite well, in no small part because eruptions are subject to much less uncertainty than earthquakes or tsunamis. Merapi has erupted many times in living memory, and is closely moni-tored by volcanologists from the Geological Agency (Badan Geologi). The increase in seismic activity over several weeks meant that the irst major eruption was well anticipated, and residents of the villages at risk had been trained in what to do and where to go in the event of an eruption – although not all chose to follow this advice. The head of Sleman district moved quickly to place a senior oficial in
20 ‘Lahar’ is a word adopted in English from the Javanese language.
TABLE 3b Estimated Value of Damage in Agriculture, Livestock and Fisheries (Rp billion)
District Totala %
Sleman Magelang Boyolali Klaten
Food crops & horticulture 981 206 111 28 1,327 67.3
Livestock 86 103 66 29 284 14.4
Smallholder plantations & forestry 124 67 24 13 228 11.6
Fisheries 79 49 3 131 6.7
Totala 1,270 425 204 70 1,970 100.0
% 64.5 21.6 10.4 3.6 100.0
a Totals are calculated using unrounded data.
charge of handling the threatened disaster (Decree 323/Kep.KDH/A/2010, dated 22 October). Contingency plans for evacuations and for accommodating refu-gees in camps scattered around the foothills of the mountain were immediately activated. Roads leading into the danger zone were closed to incoming trafic, although many evacuees insisted on going back to their villages each day to check on their livestock and crops and, presumably, to guard against looters.
After several days, many in the refugee camps began to apply their skills in handicraft production to generate a little income and escape the boredom of wait-ing for the eruptions to end. When it became obvious that whole villages had been obliterated, the implication was that many individuals would have nowhere to go for an extended period. In response to this, a program of temporary housing con-struction was undertaken. The work was done by volunteers and by the evacuees themselves, many of whom voiced their unwillingness to be passive recipients of charity handouts, preferring to work in return for the assistance they received. Management of the evacuees appears to have been quite successful, not least because of a large low of donations in cash and in kind from individuals and organisations wishing to help them.21 Casual observation suggests that
Yogya-karta is characterised by a very strong community spirit, as a consequence of which the victims received a great deal of support from others more fortunate. In particular, faculty and students of Gajah Mada University (which is located very close to Merapi) played a signiicant role, both in volunteer work and in mobilis-ing and distributmobilis-ing donations.22
One spontaneous response to these events has been the emergence of ‘disaster tourism’, driven by outsiders curious to see the impact of the eruptions on the area and the local population. Although some residents understandably resent this, others, well aware that they need an income to keep themselves going, are more pragmatic. Such tourists are therefore required to pay a small fee to enter the disaster zone, where they can now also purchase drinks, snacks and video discs depicting the disaster, or take guided motor cycle tours to particular points of interest.23
One of the important policy questions that has arisen is whether villagers should be permitted to return to the same place, rebuild their houses and resume their normal economic activity. The inclination of the local and province govern-ments is that people should be relocated to safer areas, but a large proportion of villagers feel a strong attachment to their original location and wish to return to it despite the obvious risk in doing so. Looking at this dispassionately, one could argue that the number of deaths in this episode (roughly 400) is not large, com-pared with the population of about 320,000 evacuated from the affected areas (AFP, 8/11/2010). Such numbers suggest that, given a good early warning sys-tem, the risk of losing one’s life to volcanic activity is slight – although the same cannot be said about the risk of losing houses, livestock and crops. There is little doubt that Merapi will erupt again in the future, but an eruption as severe as this
21 Donations channelled through the Sleman district government are reported in ine de-tail on its website at <http://www.slemankab.go.id>.
22 No doubt other universities also played a role. Donations were received from all over Indonesia, and from other countries.