Paraguay
83'600; 12,080/1mSri Lanka
151,800; 7,080/1mSudan
Chile
985'300 displaced; 55'440/1m
Philippines
5.8m; 57,810/1mPakistan
770'600; 4,150/1mJapan
707'500; 5,570/1mMalaysia
255'700; 8,470/1m193'100; 4,980/1m
Cambodia
154'900; 10,050/1mBosnia and
Herzegovina
90'600; 23'680/1mCountries with new displacement in 2014
50,000 people or more displaced
India
Odisha floods (July)
1.07m
Jammu and Kashmir floods
812,000
Assam and Meghalaya floods Cyclone Hudhud
639,300
China
Typhoon Rammasun
628,000
Inland storm
447,000
Floods (July)
403,000
Floods (2nd half June)
337,000
Typhoon Matmo
289,000
Typhoon Kalmaegi
252,000
Floods (1st half June)
239,000
Ludian earthquake
236,900
Typhoon Halong
570,000
Floods (December)
247,100
Riverine floods (Sept)
740,150
Iquique earthquake and tsunami
972,500
19.3 million
people
newly displaced
worldwide
Bangladesh
Floods (August)542,000
Typhoon Rammasun
2.99m
Typhoon Hagupit
1.82m
Tropical storm Lingling
400,000
Displacement related to disasters worldwide in 2014
IDMC core project team
Coordinator/lead author: Michelle Yonetani Data modeller and statistician: Chris Lavell
Researchers: Erica Bower, Luisa Meneghetti, Kelly O’Connor
Co-authors
IDMC: Sebastián Albuja, Alexandra Bilak, Justin Ginnetti, Anne-Kathrin Glatz, Caroline Howard, Frederik Kok, Barbara McCallin, Marita Swain, Wesli Turner and Nadine Walicki
Partners: Marine Franck at UNHCR, Ana Mosneaga at the UN University in Tokyo, Anton Santanen at the UN Ofice for the Co-ordination of Humanitarian Affairs (OCHA) and Greta Zeender at OCHA/Ofice of the Special Rapporteur on the Human Rights of Internally Displaced Persons.
With special thanks to
The International Organisation for Migration (IOM): Nuno Nunes, global CCCM cluster coordinator, and Aaron Watts-Jones and Lorelle Yuen at Geneva headquarters, as well as country staff in Afghanistan, Angola, Bolivia, Bosnia and Herzegovina, Botswana, Cambodia, China, Colombia, Croatia, Dominican Republic, Haiti, India, Indonesia, Iran, Myanmar, Nepal, Nicaragua, Niger, Pakistan, Papua New Guinea, Philippines, Republic of Korea, Serbia, Sri Lanka, Sudan and Tanzania for displacement data contributions. And to Muhammad Abu Musa at the Nowabenki Gonomukhi Foundation and Sajid Raihan at ActionAid in Bangladesh; Carlos Arenas at Displacement Solutions and Juanita López at the Adaptation Fund in Colombia; Damien Jusselme at JIPS in Geneva; Samira Mouaci at the OHCHR Haiti and Peter Kioy at IOM Haiti; Martin Sökefeld at the University of Munich; Bradley Mellicker at IOM Philippines; David Rammler at Fair Share Housing and Timothy Tracey at the Monmouth Polling Institute in the US.
Contributors
IDMC: Dora Abdelghani, Martina Caterina, Guillaume Charron, Anne-Kathrin Glatz, Kristel Guyon, Melanie Kesmaecker-Wissing, Sarah Kilani, Johanna Klos, Anaïs Pagot, Elizabeth J. Rushing and Clare Spurrell.
NRC: Nina Birkeland, Arvinn Gadgil and staff of ofices in Afghanistan, Colombia, Somalia, Pakistan and Chad.
We would also like to thank the following individuals and organisations for their support for our research on protracted displace-ment: Roger Zetter at Oxford University; Walter Kälin, Hannah Entwisle and Atle Solberg at the Nansen Initiative; Jane Chun at UNICEF; Hollie Grant at the University of British Columbia; François Gemenne at The Paris Institute of Political Studies (Sciences Po); Elizabeth Ferris and Megan Bradley at the Brookings Institution; Susan Martin at Georgetown University; Mo Hamza at Copenhagen University; Alice Thomas at Refugees International; Megan Passey at REACH Impact Initiatives; Graham Saunders at IFRC/global shelter cluster; James Morrissey and Marc Cohen at Oxfam; Dina Ionesco, Mariam Traore, Daria Mokhnacheva and Sieun Lee at IOM’s Migration, Environment and Climate Change (MECC) and Migration, Environment and Climate Change: Evidence for Policy (MECLEP) projects; Ahmadi Gul Mohammad at IOM Afghanistan; Sarat Dash and Jahangir Md Khaled at IOM Bangladesh; Oudry Guenole at IOM Cambodia; Daniel Silva at IOM Madagascar; Stuart Simpson at IOM Micronesia; Camila Rivero at IOM Mozambique; Kieran Gorman-Best at IOM Myanmar; Prajwal Sharma at IOM Nepal; Katherine Smalley at IOM Pakistan; Conrad Navidad at IOM Philippines and Vedha Raniyam at IOM Sri Lanka.
Editor: Jeremy Lennard
Design and layout: Rachel Natali
With thanks
IDMC’s work would not be possible without the generous contributions of its funding partners. We would like to thank them for their continuous support in 2014, and we extend particular gratitude to the following contributors:
Australia’s Department of Foreign Affairs, EuropeAid, Liechtenstein’s Ministry of Foreign Affairs, Norway’s Ministry of Foreign Affairs, Sweden’s International Development Cooperation Agency, Switzerland’s Federal Department of Foreign Affairs, the UN Refugee Agency (UNHCR), the UK’s Department for International Development, the US Agency for International Development (USAID).
Internal Displacement Monitoring Centre
Norwegian Refugee Council Chemin de Balexert 7–9 CH-1219 Châtelaine (Geneva)
Tel: +41 22 799 0700, Fax: +41 22 799 0701 www.internal-displacement.org
Please note: The displacement estimates provided in this report are based on data recorded in our disaster-induced displacement database as of 1 June 2015. Our data is subject to revision and updating based on ongoing monitoring, research and feedback. Revisions to aggregate igures since the publication of the previous year’s report are relected here.
Unless otherwise stated, all igures of 10,000 and over have been rounded to the nearest 1,000; igures of less than 10,000 have been rounded to the nearest 100.
The dataset for 2014 events is available for download from our website: www.internal-displacement.org/global-igures
CONTENTS
Summary 8
1 Introduction 11
2 Conceptualising displacement in the context of disasters 13
2.1 Slow- versus rapid- onset disasters . . . 13
2.2 The continuum from voluntary migration to forced displacement. . . 14
2.3 Displacement risk. . . 14
2.4 Reducing displacement risk. . . 14
Box 2.1: Slow-onset hazards and gradual processes associated with climate change . . . 15
Box 2.2: Dynamics and evacuation patterns associated with rapid-onset hazards . . . 16
2.5 Patterns of movement . . . 16
3 The global picture: scale, patterns and trends 19
Key indings and messages 3.1 Latest estimates . . . 20
3.2 Displacement by hazard type . . . 20
3.3 Variance from year to year . . . 20
3.4 Displacement trend from 1970 to 2014 . . . 22
Box 3.1: “Super” El Niño and displacement in 1998 - a year of extremes . . . 23
3.5 Trends in exposure and vulnerability . . . 24
4 Geographical distribution and the biggest events 29
Key indings and messages 4.1 Regions. . . 30
4.2 Countries. . . 32
Spotlight: Bosnia and Herzegovina - Doubly displaced by conlict and disaster . . . 33
4.3 Events . . . 35
Box 4.1: The Iquique earthquake and tsunami in Chile . . . 35
4.4 The big three: China, India and the Philippines . . . 36
4.5 Small but signiicant: impacts on small island developing states (SIDS) . . . 41
4.6 Multiple hazards in fragile and conlict-affected states . . . 42
5 Mind your assumptions: Protracted displacement following disasters 47
Key indings and messages 5.1 Conceptualising protracted displacement . . . 48
5.2 The data and knowledge blind spot . . . 48
5.3 Checking common assumptions . . . 50
5.4 The problem with assumptions . . . 50
5.5 Evidence to the contrary . . . 51
5.6 Leaving no-one behind . . . 52
5.7 Spotlight cases . . . 53
Papua New Guinea: Manam islanders still displaced ten years after volcanic eruption Indonesia: Sidoarjo mudlow displacement unresolved after nine years Bangladesh: Six years after cyclone Aila, prolonged and repeated displacement continues Colombia: The long road to relocation for Gramalote’s IDPs Haiti: Chronic vulnerability and protracted displacement ive years after the earthquake Pakistan: Protracted displacement from looded land in Hunza valley Japan: Living in limbo four years after the Tohoku earthquake, tsunami and nuclear accident disaster US: Displaced people in New Jersey still seeking solutions after superstorm Sandy
6 The post-2015 global policy agenda 75
Key indings and messages 6.1 Sustainable development for all: Including those displaced by disasters . . . 76
6.2 Down to business: Implementing the Sendai framework . . . 76
6.3 Heading for Paris: Displacement in climate change negotiations . . . 77
6.4 Towards Istanbul: Transforming humanitarian action . . . 78
Annexes 79
Annex A: Methodology . . . 79
Annex B: The largest displacement events of 2014 . . . . 88
Annex C: Protracted cases ongoing in 2014/2015 . . . 92
ACRONYMS
AU African Union
BiH Bosnia and Herzegovina EM-DAT International disaster database
EU European Union
HDI Human Development Index IDP Internally displaced person
IFRC International Federation of Red Cross and Red Crescent Societies IOM International Organisation for Migration
ISO International Organisation for Standardisation LSE London School of Economics and Political Science NGO Non-governmental organisation
SDGs Sustainable Development Goals SIDS Small-island developing state
UN United Nations
UNFCCC UN Framework Convention on Climate Change UNHCR UN Refugee Agency
FIGURES, TABLES AND MAPS
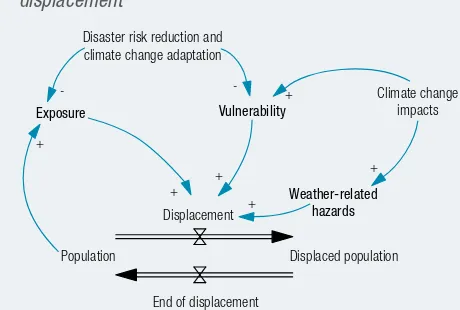
Figure 2.1: How climate change, disaster risk reduction and climate change adaptation can inluence displacement . . . 15
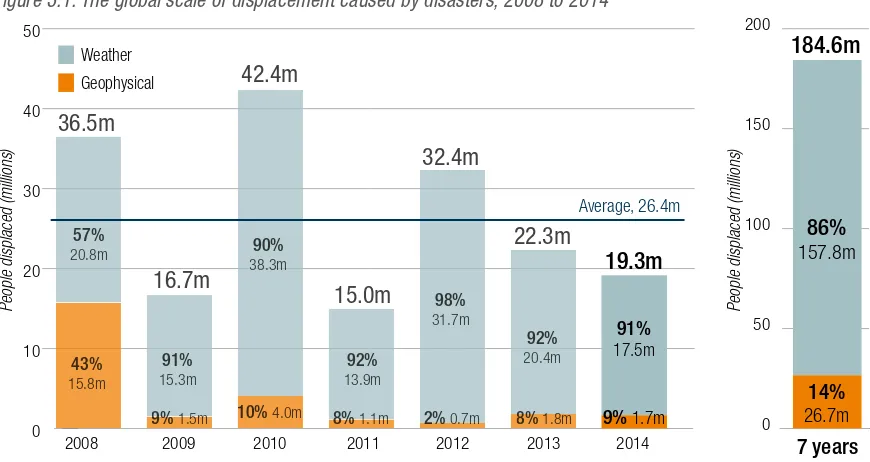
Figure 3.1: The global scale of displacement caused by disasters, 2008 to 2014 . . . 20
Figure 3.2: Global displacement by type of hazard . . . 21
Figure 3.3: Displacement by scale of event . . . 21
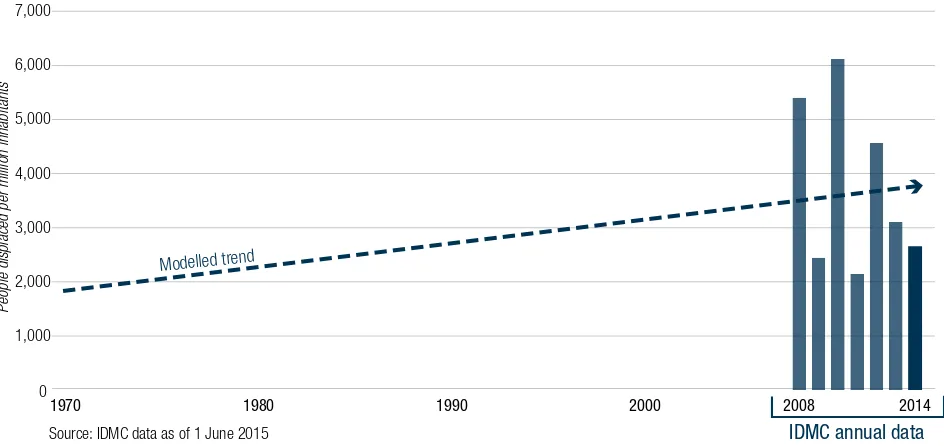
Figure 3.4: Modelled global displacement trend for 1970 to 2014 (relative to population). . . 22
Figure 3.5: Global displacement and population by World Bank income group. . . 25
Figure 3.6: Displacement by World Bank regions and income groups, 2008 to 2014. . . 26
Figure 3.7: Displacement in countries grouped by Human Development Index values . . . 27
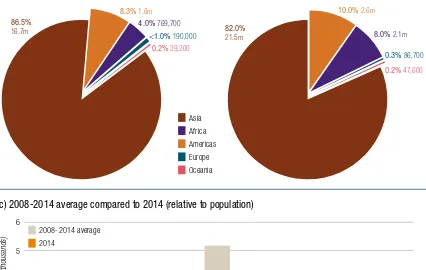
Figure 4.1: Displacement by macro-region, 2014 and 2008-2014 . . . 30
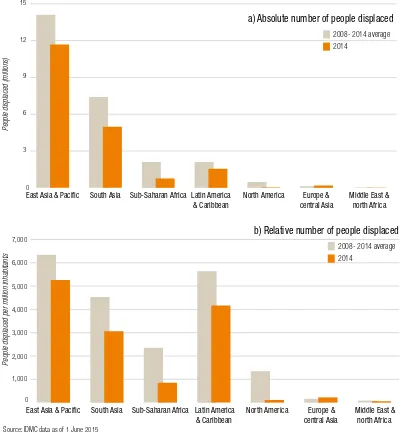
Figure 4.2: Displacement by region, as deined by the World Bank. . . 31
Figure 4.3: Countries with the highest levels of displacement, 2014 and 2008-2014 . . . 32
Figure 4.4: The 20 largest displacement events of 2014 . . . 35
Figure 4.5: Displacement in China, India and the Philippines, 2008 to 2014 . . . 36
Figure 4.6: Displacement by hazard type in China, India and the Philippines, 2008 to 2014. . . 36
Figure 4.7: Philippines - Timeline of displacement events in 2014 . . . 37
Figure 4.8: Displacement in SIDS relative to population size, 2008 to 2014 (per million inhabitants) . . . 41
Figure 4.9: Displacement in fragile and conlict-affected states, 2008-2014 . . . 42
Figure 4.10: Countries with new displacement associated with both natural hazards and conlict, 2014 and 2010-2014 . . . 43
Figure 4.11: Drivers of displacement in Herat and Helmand . . . 45
Figure 4.12: Settlement intentions of displaced households in Herat and Helmand . . . . 45
Figure 5.1: Eight cases of protracted displacement following disasters . . . 53
Figure 5.2: Displacement timeline following the Manam volcanic eruption in 2004 . . . 55
Figure 5.3: Displacement patterns and vulnerability in lood-prone areas . . . 59
Figure 5.4: Movement of IDPs from areas affected by cyclone Aila . . . 60
Figure 5.5: Total number of people displaced by the Haiti earthquake disaster from January 2010 to March 2015. . . . 63
Figure 5.6: IDPs’ reasons for leaving camps between July 2010 and March 2015 . . . 63
Figure 5.7: Comparing access to key goods and services pre- and post-earthquake (better or worse; % change) . . . 63
Figure 5.8: Displacement following the Tōhoku disaster from nuclear contaminated areas and earthquake/tsunami affected areas, 2011-2015. . . . 68
Figure 5.9: New Jersey families displaced following superstorm Sandy . . . 71
Figure 5.10: People hardest hit in New Jersey one and two years after superstorm Sandy . . . 71
Figure 5.11: Needs of the population hardest hit by superstorm Sandy by displacement status . . . 71
Figure 5.12: Financial assistance allocated for the repair of homes damaged by superstorm Sandy – owners compared to tenants. . . 72
Figure 5.13: Response to homeowner applications for inancial housing assistance - by applicants’ race and ethnicity . . . . 72
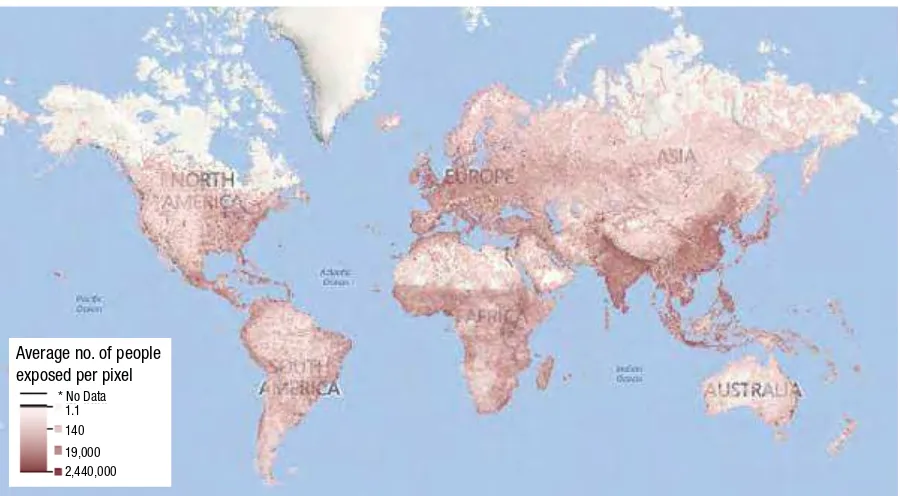
Map 3.1: Global population exposure to natural hazards . . . 24
Map 4.1: Philippines regions affected by disaster-related displacement in 2014 . . . 38
Map 4.2: Chinese provinces affected by disaster-related displacement in 2014 . . . 39
Map 4.3: Largest displacements in India and neighbouring countries, 2014 . . . 40
Map 5.1: Protracted displacement following disasters worldwide . . . 49
Map 5.2: Sidoarjo mudlow affected areas . . . 57
Map 5.3: Ongoing displacement in the Hunza valley following the 2010 Attabad landslide . . . 66
Map 5.4: Mandatory evacuation zones in Fukushima prefecture . . . 69
Table 3.1: Annual variance in disasters displacing more than a million people, 2008 to 2014 . . . 21
Table 3.2: Large displacement events in 1998. . . 23
Table 3.3: Global population trends . . . 24
Table 5.1: Checking and challenging common assumptions about protracted displacement . . . 48
Table 5.2: Number of Hunza valley IDPs . . . 65
SUMMARY
Since 2008, an average of 26.4 million people have been displaced from their homes each year by disasters brought on by natural hazards- equivalent to one person displaced every second.
The time is opportune to ensure the causes and conse-quences of this urgent issue are better addressed. Policy makers are pushing for concerted progress across humanitarian and sustainable development goals, including disaster risk reduction and action on climate change. This annual report, the sixth of its kind, aims to equip governments, local authorities, civil society organisations and international and regional institutions with evidence relevant to these key post-2015 agenda.
Our report draws on information from a wide range of sourc-es, including governments, UN and international organisations, NGOs and media, to provide up-to-date statistics on the inci-dence of displacement caused by disasters associated with geophysical and weather-related hazards such as earthquakes, volcanic eruptions, loods and storms.
The global data does not cover displacement related to drought and gradual processes of environmental degradation, nor does it relect the complexity and diversity of people’s indi-vidual situations or how they evolve over time.
This year, we have dedicated a section to protracted dis-placement in the aftermath of disasters - a signiicant knowl-edge blind spot that requires increased attention from govern-ments, the UN, the International Red Cross and Red Crescent Movement and other international and civil society organisations.
The key indings and messages from each section of the report are summarised below.
The global picture: scale, patterns and trends
Latest estimates
More than 19 3 million people were displaced by disasters in 100 countries in 2014
Since 2008, an average of 26 4 million people have been displaced by disasters each year - equivalent to one person every second.
Displacement by hazard type
17 5 million people were displaced by disasters brought on by weather-related hazards in 2014, and 1 7 million by geophysical hazards.
An average of 22 5 million people have been displaced each year by climate or weather-related disasters in the last seven years - equivalent to 62,000 people every day.
The largest increases in displacement are related to weather and climate-related hazards, and loods in particular. Climate change, in tandem with people’s increasing exposure and vulnerability, is expected to magnify this trend, as extreme weather events become more frequent and intense in the coming decades.
Variance from year to year
The signiicant luctuation from year to year in the number of people forced to lee their homes by disasters is driven by relatively infrequent but huge events that displace millions of people at a time.
Displacement trend from 1970 to 2014
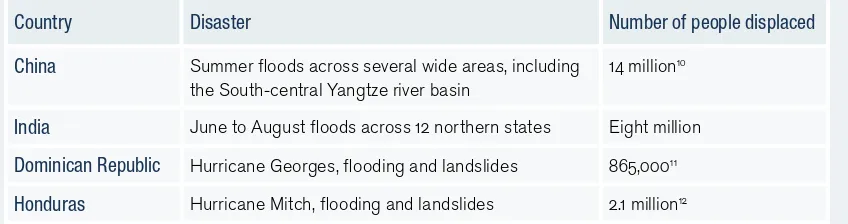
Latest historical models suggest that even after adjusting for population growth, the likelihood of being displaced by a dis-aster today is 60 per cent higher than it was four decades ago. 1998 was a peak year for displacement, which correlates with the strongest iteration of El Niño on record. Extreme weather events associated with it included hurricane Mitch, which devastated several countries in Central America.
Trends in exposure and vulnerability
The occurrence of displacement closely mirrors people’s ex-posure to hazards around the world. Exex-posure is increasing because ever growing numbers of vulnerable people live in areas prone to hazards
Two key drivers of exposure and vulnerability are urban popu-lation growth in developing countries, and economic growth The urban population in developing countries has increased by 326 per cent since 1970. This rapid growth has for the most part been unplanned and poorly governed, leading to high exposure and vulnerability. Middle-income countries bear the brunt of the phenomenon
People in low-income countries are more vulnerable still, but relatively fewer people are exposed to hazards. That said, population projections suggest that exposure will increase in many low-income countries over the coming decades. The relatively low vulnerability of high-income countries does
not mean that they are not affected. Around 1.8 million people were displaced in high-income countries in 2014, and this is explained by three factors:
»
All countries are vulnerable to the most extreme hazards»
Inequality within high-income countries makesdisplace-ment a particular concern for people less well off and those subject to discrimination and marginalisation
»
Effective early warning systems and disaster responsessave lives, but increase displacement among survivors as a protective measure
Geographical distribution and the biggest events
Displacement by region and country
9 People displaced by disasters
»
Eleven of the 20 countries worst affected by displacementover the last seven years are in Asia.
Europe experienced double its average level of displacement for the past seven years in 2014, with 190,000 people displaced, most of them by looding in the Balkans.
Displacement in Africa was three times lower than average in 2014 in absolute terms, but many African countries experi-enced high levels relative to their population size.
»
The highest level of displacement in relative terms in 2014 was in Sudan, where rainy season loods displaced 159,000 people.In Chile, one of the largest displacements of the year high-lighted the beneit of investment in disaster prevention and preparedness. Around 970,000 people led low-lying coastal areas in response to an 8.2 magnitude offshore earthquake and tsunami warning in April. Most people were able to return home the following day.
Developing countries are consistently the worst affected, with almost 175 million people displaced since 2008, account-ing for 95 per cent of the global total. The igure for 2014 was 17.4 million, or 91 per cent of the global total.
The big three: China, India and the Philippines
China, India and the Philippines experienced the highest levels of displacement in absolute terms, both in 2014 and for the 2008 to 2014 period.
Disasters related to loods, storms, earthquakes and volcanic eruptions in the three countries accounted for 15 of the 20 largest displacements in 2014.
Multiple and repeated displacements in the same parts of the three countries point to areas of particularly high exposure and vulnerability.
The Philippines was among the three worst-affected countries in relative and absolute terms, both in 2014 and over the 2008 to 2014 period.
Large-scale evacuations prompted by two category-three typhoons in the Philippines caused the largest displacements worldwide for the second year running in 2014.
Small but signiicant: impacts on small island developing
states (SIDS)
Their populations are relatively small, but SIDS are dispro-portionately affected by displacement associated with loods, storms and earthquakes.
Between 2008 and 2014, they experienced levels three times higher than the global average, relative to their population sizes.
Twelve per cent of the countries where we recorded displace-ment related to disasters in 2014 were SIDS, of which ive were among the 20 worst-affected countries worldwide in relative terms.
Cyclone Ian in Tonga caused the second largest displacement worldwide in relative terms in 2014. Only 5,300 people were forced to lee their homes, but they accounted for ive per cent of the island’s population.
Haiti and Cuba have had the highest levels of displacement among SIDS over the past seven years in both relative and absolute terms, caused by earthquakes, loods and storms.
Multiple hazards in fragile and conlict-affected states
A complex mix of overlapping hazards contribute to displace-ment and determine patterns of movedisplace-ment and needs in fragile and conlict-affected countries. This makes an integrated analysis particularly important as the basis for policymaking and planning.
Modelled global displacement trend for 1970 to 2014
(per million inhabitants)
People displaced per million inha
bitants
0 1,000 2,000 3,000 4,000 5,000 6,000
2014 2008 2000
1990 1980
1970
Modelled trend
IDMC annual data
Source: IDMC data as of 1 June 2015
The scale of global displacement by disasters, 2008-2014
People displaced (millions)
36.5
16.7
15.0 42.4
32.4
22.3 19.3 Average, 26.4m Related to weather hazards
Related to geophysical hazards
0 10 20 30 40 50
2014
2013 2012 2011 2010 2009 2008
Countries signiicantly affected by displacement related to both conlict and natural hazards in 2014 included India, Pakistan, the Philippines, South Sudan and Sudan Allfragile and conlict-affected states, as deined by the World
Bank, experienced displacement associated with natural haz-ards between 2008 and 2014. More than 750,000 people were displaced by disasters in these countries in 2014 alone
Mind your assumptions: Protracted displacement
following disasters
Relatively little is known about protracted displacement situ-ations following disasters They are poorly monitored and little reported on. A sample we have collated of 34 ongoing cases accounts for more than 715,000 people stuck in limbo, and points to the likelihood of hundreds of thousands more who have not yet been recorded.
The common assumption that displacement following disas-ters is short-term and temporary does not hold true in many cases The cases we identiied highlight the plight of people who have been living in protracted displacement for up to 26 years.
People in such situations receive little attention and are likely to be left behind in long-term recovery, disaster risk reduction and development processes. Better data and further research is needed to create a solid evidence base for policymakers’ and responders’ decisions.
Hazards are diverse in their nature and dynamics. Some persist for long periods and can become permanent barriers to return The repeated impacts of frequent short-lived hazards on vul-nerable communities can also lead to protracted displacement. Displacement following disasters is often fraught with complex
and political obstacles to solutions. Obstacles frequently encountered include access to land and discrimination against vulnerable and marginalised groups. Addressing the long-lasting social and psychological consequences of displace-ment is as important as the physical rebuilding of homes and infrastructure.
Most of the cases of protracted displacement we identiied are in low and middle-income developing countries, but there are also signiicant examples in rich countries, such as the US and Japan. Vulnerable and marginalised people in high-income countries also risk being excluded from solutions. Governments should prioritise measures to advance solutions
and strengthen the resilience of people whose displacement risks becoming protracted, or has already become so. They in-clude people whose former homes have become permanently inaccessible or unsafe, informal settlers, poor tenants and people who face discrimination based on their class, ethnicity, gender or age. Interventions should be adapted to their speciic needs.
When displaced people move on to another location during or after the emergency phase of a response, their situation should be veriied. They should not be allowed to drop off the radar as “residual caseloads” when humanitarian priorities shift towards longer-term recovery and development.
Local authorities, civil society networks and community-based organisations should be mobilised and supported to help iden-tify and monitor cases of protracted displacement. This is im-portant, given that many of those affected are all but invisible, because they are dispersed among wider populations and in urban areas.
The post-2015 global policy agenda
The time is opportune for displacement associated with dis-asters to be better addressed in major global policy agenda and their implementation in the post-2015 period They in-clude the Sustainable Development Goals, the Sendai Frame-work for Disaster Risk Reduction, action on climate change under the UNFCCC and preparatory work for the 2016 World Humanitarian Summit.
A comprehensive approach to displacement will help to forge strong links and continuity between these initiatives, and sup-port the implementation of global and national commitments. Displacement can no longer be considered as a primarily humanitarian issue, nor one that is speciic to conlict situa-tions. In most countries affected it has multiple and overlap-ping causes, and addressing it requires close coordination of humanitarian and development policy and action within and between governments.
The increasing number of people displaced and at risk of becoming trapped in protracted situations following disasters underscores the urgent need to include people displaced or at risk of becoming so in sustainable and inclusive develop-ment measures
Improved monitoring and data on displacement is needed to measure the achievement of national and global policy targets for inclusive and sustainable development, disaster risk reduction and management, and adaptation to climate change.
In order to prioritise resources and target responses to where they are most needed, a common framework for collecting, interpreting and comparing displacement data should be established between government and partner organisations and across different timeframes.
11 1 | Introduction
INTRODUCTION
Since 2008, an average of 26.4 millionpeople have been displaced from their homes each year by disasters brought on by natural hazards- equivalent to one person displaced every second.
The time is opportune to ensure the causes and consequences of this urgent issue are better addressed. Policy makers are pushing for concerted progress across humanitarian and sustainable develop-ment goals, including disaster risk reduc-tion and acreduc-tion on climate change. This annual report, the sixth of its kind, aims to equip governments, local authorities, civil society organisations and international and regional institutions with evidence relevant to these key post-2015 agenda.
Our report draws on information from a wide range of sources, including govern-ments, UN and international organisations, NGOs and media, to provide up-to-date statistics on the incidence of displace-ment caused by disasters associated with geophysical and weather-related hazards such as earthquakes, volcanic eruptions, loods and storms. The global data does not cover displacement related to drought and gradual processes of environmental degradation, nor does it relect the com-plexity and diversity of people’s individual situations or how they evolve over time.
This year, we have dedicated a sec-tion to long-lasting and protracted dis-placement in the aftermath of disasters - a signiicant knowledge blind spot that requires increased attention from gov-ernments, the UN, the International Red Cross and Red Crescent Movement and other international and civil society or-ganisations. Section ive of the report pre-sents our initial indings from a review of literature, interviews and other evidence as a starting point for further monitor-ing. We discuss the issue alongside eight case studies of current situations in Bangladesh, Colombia, Haiti, Indonesia, Japan, Pakistan, Papua New Guinea and the United States. These are summarised in annex C along with a broader sample of 34 ongoing displacement situations.
Section three presents the global picture today. We provide estimates and analyses of events in 2014 and over the 2008-2014 period, and include the disag-gregation of global data by hazard type, annual variance in displacement pat-terns, and the updating of our modelled historical estimates to show the trend in displacement over a 45-year period. The section also examines global trends in exposure and vulnerability, focusing on urban population and economic growth.
A girl stands on the outskirts of Belet Wayne IDP camp, Somalia. Belet Wayne, Somalia’s ifth largest city, is home to people displaced by loods that affected the region in late 2012. (Photo: UN Photo/Tobin Jones, February 2013) In October 2014, thousands more were rendered homeless by loods again.
The geographical distribution of dis-placement across regions and countries is presented in section four. It examines the largest events of 2014 and zooms in on the Iquique earthquake and tsunami in Chile as well as the lood disaster in Bosnia and Herzegovina. Country and regional data is further analysed in relation to the three countries most consistently affected by disaster displacement globally, China, India and the Philippines. The section also focuses on Small Island Developing States (SIDS) as countries disproportion-ately impacted by displacement, as well as multiple hazards in fragile and conlict-affected states, including a special spot-light on the case of Afghanistan.
In the concluding section of the report, we discuss the positioning of displacement associated with disasters in key global pol-icy agendas. These include a new global framework on disaster risk reduction for 2015-2030, which was adopted by UN member states in March as a successor to the Hyogo Framework for Action; negotia-tions ahead of the Paris conference on cli-mate change at the end the year (COP21); the inal stages of work on proposals for new Sustainable Development Goals to be presented for endorsement in Septem-ber; and preparations for the 2016 World Humanitarian Summit. A comprehensive approach to displacement will help to forge strong links and continuity between these initiatives, and support the implementation of global and national commitments.
The overall conceptual framework and the terms and deinitions that inform our analysis of displacement associated with disasters are presented in section two of the report. Our methodology for data col-lection, the development of displacement estimates, modelling and other qualita-tive research, as well as scope and limita-tions of the report are further explained in annex A1. A comprehensive list of the largest displacements in 2014 is provided in annex B. Our full 2014 dataset is avail-able for download from our website at www.internal-displacement.org.
The terms and concepts that inform IDMC’s collection and interpretation of quantitative and qualitative data on displacement associated with natural hazards and the disasters they trigger are discussed below. They represent evolving knowledge that draws on the wide range of sources we use for our monitoring and analysis generally, and for this global report in particular.
Standard or widely accepted interna-tional deinitions are available for some, and these are expanded upon from the perspective of different types of natu-ral hazards, disasters and displacement. Others are more luid and less speciic. All need to be carefully interpreted ac-cording to the contexts and perspectives from which they were developed and in which they are applied.
Disaster is deined as the “serious disruption of the functioning of a com-munity or a society causing widespread human, material, economic or environ-mental losses which exceed the ability of the affected community or society to cope using its own resources”.1 They are
the result of a combination of risk factors that can be summarised as the exposure of people and assets to hazards, and their pre-existing vulnerability to them.
Hazard refers to the potential oc-currence of a natural or human-induced physical event or trend or physical im-pacts2, that may pose a severe threat to
people and assets that are exposed to them. “Natural” hazards are time-bound
events or gradual processes and condi-tions that originate in the natural environ-ment. The intensity and predictability of hazards varies greatly.
Exposure refers to “[t]he presence of people, livelihoods, species or ecosys-tems, environmental functions, services, and resources, infrastructure, or eco-nomic, social, or cultural assets in places and settings that could be adversely af-fected.”3
Vulnerabilityrefers to “the propensity or predisposition to be adversely affect-ed”. It encompasses a variety of concepts and elements “including sensitivity or sus-ceptibility to harm and lack of capacity to cope and adapt”.4
Humanitarians tend to use the term “disaster”, or “natural disaster” in relation to crises triggered by or associated with hazards that originate in the natural en-vironment, as is the usage in this report. While they are more likely to be aware of very intensive hazard events, such as a major earthquake, less intense but more frequent events can result in localised disasters for vulnerable communities, particularly if the hazards are recurrent. Disaster also applies to contexts where multiple types of hazard contribute to a disaster. Examples include the reac-tor meltdown and radiation leak from the Fukushima Daiichi nuclear power plant in the aftermath of the 2011 Tohoku earthquake and tsunami, and numerous situations in which populations are also affected by conlict.
in the context of disasters
CONCEPTUALISING
DISPLACEMENT
Slow- versus rapid- onset
disasters
Disasters and related hazards are commonly categorised as either slow- or rapid-onset, but their dynamics are better understood as a continuum. At one end sit short-lived trigger events or hazards such as earthquakes that occur with little or no notice, and at the other gradually developing and long-lasting processes such as drought and river bank erosion, which act as stressors on people’s living conditions and means to survival. Some individual hazard types, such as loods, include events with different dynam-ics. Flash loods tend to occur with little prior warning and pass relatively quickly, while other riverine loods develop more slowly. Floodwaters may make areas in-accessible for months. Different types of explosive or effusive volcanic eruptions can occur with little or no notice, while others can be predicted ahead of time, producing ash, toxic gases, fast moving loods of hot water, debris and lava within hours to days. Eruptions may continue to threaten exposed areas over extended periods and require repeated evacuations. Other hazards may occur as a cascade, such as tsunamis, landslides, ires and aftershocks following a major earthquake, or looding made more extreme when it follows a period of drought. These dynam-ics have a bearing on how displacement occurs, as further discussed below.
Displacement is the forcedorobliged movement, evacuation or relocation of
in-2
dividuals or groups of people from their homes or places of habitual residence in order to avoid the threat or impact of a disaster.5 It refers to situations where
people are forced to move by other peo-ple and organisations, including local or national authorities, but also when people act of their own volition in response to the threats and severe conditions they face.
The continuum from voluntary
migration to forced displacement
In practice, displacement sits within a continuum including “(predominantly) forced displacement” and “(predomi-nantly) voluntary migration”, as well as “(voluntary or forced) planned reloca-tion” (Nansen Initiative, 2014).6
Displace-ment tends to emphasise “push” factors to leave and migration emphasises “pull” factors at the intended destination, while each is a mixture of both. Put another way, displacement is a more reactive measure of last resort or a survival response to severe and immediate threats. Migra-tion is a longer-term strategic decision to move to where there are safer condi-tions and better livelihood prospects (see igure 2.1). Movements at either end of the continuum may put vulnerable peo-ple in a more precarious situation than if they had stayed in their place of origin if they are not suficiently protected and supported. Well informed, prepared and managed movements, however, enable people to adapt to worsening conditions and save lives.
The difference between voluntary and forced population movements is particularly dificult to distinguish during slowly evolving disasters. In the face of rapidly developing hazards, people are often forced to lee their homes with lit-tle notice in response to the immediate threat. Others may be displaced later as the disaster develops and new threats evolve or initial coping strategies begin to fail. Their immediacy as shocks that trig-ger acute points of crisis make it easier to link them to any displacement caused. Large groups of people on the move soon before or after a hazard’s impact are also easier to identify.
Gradual and long-lasting hazards such as drought or processes of envi-ronmental degradation such as soil
ero-sion tend to act indirectly as stressors on living conditions, along with a range of other socio-economic, political and cultural drivers of exposure and vulner-ability. They allow people more time to consider and take steps to avoid, miti-gate and adapt to impacts on their homes, livelihoods and communities. They may choose to migrate well before they face an acute crisis, which blurs the distinc-tion between forced displacement and voluntary migration.
For the poorest and most vulnerable, whose survival options may be severely circumscribed by remaining in their homes, it could be argued that their de-cision to leave always constitutes a form of displacement regardless of the haz-ards that contributed to it. In slow-onset situations, people may flee in smaller numbers and over longer periods of time in response to a gradual change in con-ditions and are, therefore, less easy to identify and track. Slowly evolving dis-asters such as the Sidoarjo mud low in Indonesia (see section 5) may make return impossible even in the long-term, because they make land permanently ir-redeemable.
Displacement risk
As with disaster risk, the risk of dis-placement can be expressed in relation to hazards, exposure and vulnerability:
The likelihood, severity and nature of a hazard or combination of hazards oc-curring over time. According to the best scientiic evidence, climate change is expected to alter normal variability in the weather and make some hazards more severe and frequent7
The exposure of people and their homes, property and livelihoods to haz-ards before a disaster and both during and after their displacement as they move from one location to another People’s pre-existing and evolving
vul-nerability to the impact of hazards be-fore, during and after their displacement
These factors not only increase the likelihood of people becoming dis-placed. They also affect evolving threats to their security and human rights while displaced, the duration of their displace-ment and the obstacles displaced people
face in their efforts to achieve durable solutions. This is because displacement puts people at greater risk of impover-ishment and discrimination, and creates specific protection needs.16 Specific
problems they face include landlessness; joblessness; homelessness and worsen-ing housworsen-ing conditions; economic, social and psychological marginalisation; food insecurity; increased morbidity and mor-tality through trauma and vulnerability to insanitary conditions and disease; loss of access to common property; and the disruption or destruction of social and economic support networks.17 Many of
these challenges are illustrated through cases highlighted in sections three, four and ive of this report.
Reducing displacement risk
Exposure and vulnerability are largely the product of human activity and they can be reduced by government and community-based measures that reduce the risk of displacement. Such measures include the application of building stand-ards to make homes and infrastructure disaster resistant, and strengthening the resilience of communities and livelihoods so that they are better able to withstand or adapt to the hazards they face. Land zoning may also be enforced to minimise the development of settlements in areas that face frequent, severe and increas-ing exposure to hazards. As a last resort, after all other options have failed and community resilience has signiicantly eroded, measures may also include the permanent relocation of people’s homes away from areas where their exposure to hazards is high.18To be effective, approaches need to be tailored to the speciic contexts in which people are or may be displaced, and the different capacities and vulner-abilities of the communities, households and individuals concerned. Measures should also address the disproportionate level of risk faced by poor and marginal-ised communities and households, which have fewest resources both to mitigate displacement and recover from it through the achievement of durable solutions (see section ive).19
Box 2.1: Slow-onset hazards and gradual
processes associated with climate change
Even gradual and relatively modest changes in climate can affect the frequency and intensity of hazards and communi-ties’ vulnerability to them (see igure 2.1). Higher temperatures increase the risk of both drought and episodes of heavy rainfall, also known as “extreme precipitation events”, while rising sea levels make storm surges worse and increase the risk of coastal looding. Lower agricultural yields associated with gradual changes in climate undermine rural livelihoods and erode communities’ capacity to cope with shocks.
Sea level rise
Rising sea levels are expected to become a signiicant driver of future displacement, particularly in small island states and low-lying coastal areas. The Intergovernmental Panel on Climate Change (IPCC)’s Fifth Assessment Report notes that “it is virtually certain that global mean sea level rise rates are accelerating”, with projected increases by 2100 ranging from 0.35 to 0.70 metres.
Rising sea levels will aggravate the effects of swell waves, storm surges and other drivers of severe sea-lood and erosion risk. Wave over-wash is also conidently predicted to degrade fresh groundwater resources.8IPCC’s report notes that tens of
millions of people could ind themselves at risk of permanent displacement as their home areas become uninhabitable.
“Twelve million people could become displaced by sea level rise by 2030 in four major coastal areas in the U.S. Globally, and without investment in adaptation measures, a rise of 0.5m in sea level implies a likely land loss of 0.877 million km2 by 2100, displacing as many as 72 million peo-ple. A more extreme 2.0m change in sea level would result in the loss of 1.789 million km2, displacing 187 million peo-ple, or 2.4 per cent of global population, mostly in Asia.”9
Such scenarios are not foregone conclusions. The scale of displacement will also depend on the extent to which countries and communities adapt to the threats posed by rising sea levels. Making communities more resilient should
reduce, or at least delay the onset of such forced movements. That said, research published since the IPCC report has found that a section of the western Antarctic ice sheet has gone into “irreversible retreat”.10 This could mean sea
lev-els are rising more quickly than previously thought, making IPCC’s scenarios overly optimistic. For those unwilling to relocate, adaptation would not be a choice but a necessity.
Displacement in small island states
As with other hazards, the fact that sea level rise is one of a number of inter-related and dynamic processes that inlu-ence population movements makes it dificult to estimate future displacement associated with the phenomenon. The IPCC notes, for example, that climate change and its impacts are taking place at the same time as increases in rural to urban migration. This often results in squatter settlements in highly exposed locations that lack basic amenities, leaving inhabitants highly vulnerable to climate risks.11
In small island states, other gradual changes and process-es such as the warming of sea surface temperaturprocess-es, ocean acidiication and the depletion of oceanic oxygen also have the potential to inluence mobility patterns indirectly, given their im-pacts on livelihoods. Such processes are expected to contribute to coral bleaching, threatening both ish stocks and tourism.
Affected communities may also suffer the impacts on agricultural production of the salination of groundwater and soil associated with rising sea levels and climate variability in terms of drought and loods. This may force them to import more food and drinking water, which in turn increases their vulnerability to price spikes and pre-existing pressures to migrate for economic reasons.
The IPCC concludes that more research is needed on the impact of rising sea levels and other climate change impacts on small island displacement, and on the adaptation strate-gies appropriate for different types of island under different scenarios.12 More sophisticated approaches are required
to accommodate such complexity and respond to climate change in a multidimensional way as one of a number of stressors on small island states.
The impact of different adaptation strategies on displace-ment and migration will be inluenced by the scale of climate change and human factors such as their cultural and social acceptability and communities’ conidence in their effective-ness.13 Cultural attachment to place, economic opportunities
and other human factors have inluenced population mobility in small island states as much, if not more than environmental factors.14 In Kiribati and Fiji, spiritual beliefs, traditional
gov-ernance mechanisms and short-term approaches to planning have undermined adaptation measures.15
[image:17.595.62.292.258.413.2]Ultimately, future displacement will be inluenced by cli-mate change and environmental degradation and how hu-mans choose to address the processes. There is, however, still a great deal of uncertainty about the possible extent of climate change impacts, and even more about how humans will respond to them.
Figure 2.1: How climate change, disaster risk
reduction and climate change adaptation can inluence
displacement
+
+ +
+
+ +
-
-Exposure Vulnerability
Weather-related hazards
Displacement Disaster risk reduction and climate change adaptation
Climate change impacts
Population Displaced population
End of displacement
Box 2.2: Dynamics and evacuation patterns
associated with rapid-onset hazards
National and local authorities have the primary respon-sibility for implementing evacuations as a protective meas-ure. Given that leeing quickly from the dangers inherent in a rapidly unfolding disaster can be highly risky, especially when large numbers of people are involved, such evacua-tions should be well prepared for in advance, including the identiication of safe refuge areas.
People with limited mobility because of age, illness or disability or sickness, and children who become separated from their carers require particular attention to ensure that they are adequately protected.24
Evacuations are normally undertaken on the assumption that they will be short-lived, but return depends on the effects of a disaster in home areas and prospects for recovery. To respect human rights and be lawful, authorities must ensure the safety and health of those affected or at risk, and all measures must be taken to minimise the scale and duration of displacement and its adverse effects.25
Well-executed evacuations of people living in exposed ar-eas are a vital life-saving mar-easure.26 Governments worldwide
have recognised the importance of effective early warning systems to monitor threats and ensure that timely notice is given to all those potentially exposed.27 Evacuations must
also take into account the nature of different hazards, which do much to determine the timing and dynamics of initial displacement patterns.
In the case of tropical storms, evacuations tend to take place over the hours and sometimes days before they are
expected to make landfall, and/or over similar timescales afterwards. The onset of hurricanes and cyclones can be pre-dicted in time to allow for prior large-scale evacuations, but they may change strength and direction at the last minute.
Tornadoes often develop with little warning, so sheltering in situ, often underground, tends to be the safest option. In such cases, people can still become displaced in the storm’s aftermath if they lose their homes or the devastation to their communities is so widespread that they are forced to move elsewhere, at least temporarily.
Tsunami warnings provide exposed populations with vital time to lee to higher ground. This may be a matter of minutes to hours, depending on how close they are to an undersea earthquake’s epicentre.28 Earthquakes and lash loods give
little or no notice of their onset, meaning that evacuations take place during or after their initial impact. In contrast, early warnings of volcanic activity often allow people to evacuate under less time pressure, but the exact moment of an erup-tion is dificult to predict. This may mean that evacuees are displaced for weeks, or that they are allowed to return only to be evacuated again at a later date.
Periods of heavy seasonal rainfall and riverine and storm-related loods often affect heavily populated low-lying and coastal areas. As they evolve, they may prompt successive waves of evacuations over weeks and months, which also makes it dificult to distinguish between one disaster and the next. We identiied examples of all these dynamics among the displacements reported in 2014, the largest of which in both absolute and relative terms are discussed in section four.
question. The human exploitation and mismanagement of the planet’s natural resources is an important factor in many disasters. The decision to dam or divert water in response to heavy rainfall and lood risk may have immediate impacts on displacement, for example. In slowly devel-oping and long-lasting situations, it is less likely that a speciic hazard can be singled out as the main driver of displacement (see Afghanistan spotlight in section four). Models developed by IDMC and Climate Interactive also show that the frequency of drought in the Horn of Africa is a less signiicant factor in undermining pastoral-ists’ livelihoods and driving their displace-ment than other issues, such as changes in government policy.20 Emphasising the
natural aspect of hazards distracts from the role of human activity in the disasters and displacement they cause.21 As such,
an over-emphasis on hazards themselves can be politically, practically and methodo-logically problematic.
At the same time, anthropogenic cli-mate change is expected to increase the intensity and frequency of certain weather-related hazards and the vulner-ability of some populations as their land and livelihoods become uninhabitable.22
The best scientiic knowledge available makes clear the urgency of action to both mitigate global warming and adapt to its human impacts, including displacement.23
The complex relationship between slow-onset hazards and displacement as-sociated with climate change is discussed further in box 2.1.
Patterns of movement
Following their initial displacement, people’s trajectories are often com-plex, a fact seen at both the individual and community level, and within and among households. It is not unusual for displaced people to move a number of times, whether in response to threats or
opportunities that arise over time as they seek to end the insecurity and uncertainty of their displacement and re-establish their homes and livelihoods. The ability to move to where assistance is available may indicate resilience. Governments and humanitarian organisations may relocate people from initial shelter sites or evacua-tion centres to more secure shelter when it becomes clearer that displacement is likely to last longer than expected.
Repeated and frequent displacement
Repeated cycles of displacement are frequently observed in countries and areas exposed to natural hazards (see maps in section 3 for example). Contrary to common assumptions, the early return of people to their homes does not neces-sarily indicate the end of their displace-ment. If recovery is beyond the means of displaced families and the risk of further disaster and displacement is not reduced, it does not constitute a safe and sustain-able solution.Long-lasting and protracted
displacement
Long-lasting and protracted displace-ment following disasters, especially rapid-onset disasters, is more prevalent than commonly assumed30 as shown by
evi-dence presented in section 5 and annex C of this report. At the same time, the global data presented in this report does not fol-low the hundreds of new displacements identiied each year to track how long people remain displaced for, what their needs are during displacement nor what obstacles they face to achieving durable solutions. Knowledge about the duration of displacement following disasters is ad hoc and unconsolidated, as is more de-tailed identiication and analysis of cases of particular concern.31 This constitutes
an important gap that we have started to address more systematically as discussed in section 5.
Deinitions of protracted displacement vary across different organisations and perspectives and depend on the purpose and context in which the term is applied. They commonly include an element of time as well as a notion of limbo or un-certainty for people facing significant obstacles to achieving solutions to their displacement and for whom progress is slow or stalled.32 The length of time that
people remain displaced can vary greatly according to the speciic context, and thresholds applied for the purpose of sta-tistical analysis or research will tend to be arbitrary.33UNHCR data on displacement
related to conlict applies the term to situ-ations that have been ongoing for at least ive years,34 though it may be argued that
many situations become protracted be-fore that point. Length of time displaced is insuficient in itself as an indicator of the
their displacement or how many settle abroad. Evidence gathered by the Nansen Initiative on cross-border displacement is strongest for people displaced across borders in Africa in relation to drought and loods, and in the Americas in re-lation to earthquakes and hurricanes in particular. Examples from Asia are more rare, though disasters and environmental degradation have been linked to people migrating abroad (see the case in sec-tion 5 from Bangladesh). Little evidence has been found of such displacement or migration from Europe.39 As sea
lev-els continue to rise it is expected that a signiicant portion of the populations of small island countries and low-lying countries with extensive coastlines will be forced to move abroad also.40
A durable solution to displacement is achieved a) when IDPs have found a settlement option through re-establishing their homes where they lived before the disaster, through integrating locally in the areas where they have been displaced to, or through relocating and integrating elsewhere in the country, b) when they no longer have speciic assistance and protection needs linked to their displace-ment, and c) when they can exercise their human rights without discrimination.41
Whichever settlement option dis-placed people choose to pursue, they often face continuing problems and risks that require support beyond the acute phase of a disaster. Achieving a durable solution is a gradual and complex process that needs timely and coordinated efforts to address humanitarian, development and human rights concerns.
As such, an effective response to displacement requires IDPs’ basic needs for immediate protection and assistance to be met in tandem with longer-term processes to ensure that solutions are durable. Such an approach should in-clude measures that reduce the risk of further disaster and repeated displace-ment, wherever people choose and are able to settle.42
Further explanation of terms can be found in the methodological notes in an-nex A.
severity of the situation. For the purpose of the preliminary research presented in this report, we have used a temporal value to set the parameters of our analysis. The minimum duration of one year was ap-plied as a timeframe commonly assumed for the emergency response phase fol-lowing rapid-onset disaster, and within which displaced people are expected to have returned to their homes. This and other assumptions are also discussed in section 5.
Displacement in terms of distance
moved
The distance people lee from their homes should not be taken as an indica-tor of the severity of people’s situations while displaced. How far they move is de-termined by a variety of factors, including whether areas near their homes are safe and accessible, and best able to access assistance, be it from family and friends, the government or other providers.
Staying as close to their homes as possible is a common strategy that ena-bles displaced people to maintain their social networks, protect their property and register their need for emergency assistance. It may also, however, be the result of a lack of better options or be-cause physical, inancial, social or political obstacles prevent them from moving fur-ther aield.35 People in such situations are
in essence both displaced and trapped,36
and as such they should be among those included for humanitarian assistance and protection, particularly in the aftermath of a disaster that has caused signiicant destruction.
Internal and cross-border displacement
The vast majority of people who lee disasters remain within their country of residence. As set out in the Guiding Prin-ciples on Internal Displacement, they are described as internally displaced people (IDPs).37 At the same time, in somere-gions substantial numbers of displaced people seek protection and assistance abroad.38 The global data on which this
report is based covers only the incidence of displacement, and not where displaced people lee to or where they eventually settle. As such, it does not allow us to quantify how many people may have crossed an international border during
Variance from year to year
The signiicant luctuation from year to year in the number of people forced to lee their homes by disasters is driven by relatively infrequent but huge events that displace millions of people at a time.
Displacement trend from 1970 to 2014
Latest historical models suggest thateven after adjusting for population growth, the likelihood of being displaced by a disaster today is 60 per cent higher than it was four decades ago.
1998 was a peak year for displacement, which correlates with the strongest it-eration of El Niño on record. Extreme weather events associated with it in-cluded hurricane Mitch, which devastat-ed several countries in Central America.
Trends in exposure and vulnerability
The occurrence of displacement closely mirrors people’s exposure to hazards around the world. Exposure is increas-ing because ever growing numbers of vulnerable people live in areas prone to hazards
Two key drivers of exposure and vulner-ability are urban population growth in developing countries, and economic growth
The urban population in developing countries has increased by 326 per cent since 1970. This rapid growth has for the most part been unplanned and poorly governed, leading to high exposure and vulnerability. Middle-income countries bear the brunt of the phenomenon People in low-income countries are
more vulnerable still, but relatively fewer people are exposed to hazards. That said, population projections sug-gest that exposure will increase in many low-income countries over the coming decades.
The relatively low vulnerability of high-income countries does not mean that they are not affected. Around 1.8 million people were displaced in high-income countries in 2014, and this is explained by three factors:
»
All countries are vulnerable to the most extreme hazards»
Inequality within high-incomecoun-tries makes displacement a particu-lar concern for people less well off and those subject to discrimination and marginalisation
»
Effective early warning systems anddisaster responses save lives, but in-crease displacement among survivors as a protective measure
Scale, pa
tterns and trends
THE GLOBAL PICTURE
Key indings and messages
Latest estimates
More than 19 3 million people were dis-placed by disasters in 100 countries in 2014
Since 2008, an average of 26 4 million people have been displaced by disas-ters each year - equivalent to one per-son every second.
Displacement by hazard type
17 5 million people were displaced by disasters brought on by weather-related hazards in 2014, and 1 7 million by geo-physical hazards.
An average of 22 5 million people have been displaced each year by climate or weather-related disasters in the last seven years - equivalent to 62,000 peo-ple every day.
The largest increases in displacement are related to weather and climate-re-lated hazards, and loods in particular. Climate change, in tandem with peo-ple’s increasing exposure and vulner-ability, is expected to magnify this trend, as extreme weather events become more frequent and intense in the com-ing decades.
3
3.1 The latest estimates
Disasters brought on by weather-related and geophysical hazards forced more than 19.3 million people to leave their homes in 2014 (see igure 3.1). This estimate is based on 695 new displace-ment events in 100 countries (see global map on the inside cover).
Since 2008, an average of 26.4 million people have been displaced by disasters each year - equivalent to one person dis-placed every second.
3.2 Displacement by type of
hazard
In 2014, disasters associated with weather hazards, mostly floods and storms, displaced more than 17.5 million people, or 92 per cent of the global to-tal. Storms were responsible for a higher than average share of total displacement (see igure 3.2). The Atlantic hurricane season was relatively quiet, but the Pa-ciic produced the highest ever number of storms ranked category four or higher, and equalled the modern record for the number of storms overall in a single sea-son.1
Most of the largest displacements in 2014 were associated with weather-related hazards. The three largest were caused by typhoons and loods in the Philippines and India (see table 3.1). Eight of the 20 largest disasters of the year were triggered by typhoons or tropical storms in Asia (see igure 4.4).
Since 2008, an average of 22.5 million people have been displaced by climate- or weather-related disasters. This is equiva-lent to 62,000 people every day.
Climate change, on top of increasing exposure and vulnerability, is expected to exacerbate this trend further as the inten-sity and frequency of extreme weather hazards increases in coming decades.2
[image:22.595.60.495.72.303.2]Disasters related to geophysical haz-ards, primarily earthquakes and volcanic eruptions, displaced more than 1.7 million people, or nine per cent of the 2014 total (see igure 3.2). Between 2008 and 2014, only three of the 37 disasters to displace more than a million people were related to geophysical hazards - the 2008 Sichuan earthquake in China and the 2010 earth-quakes in Haiti and Chile.
Figure 3.1: The global scale of displacement caused by disasters, 2008 to 2014
0 10 20 30 40 50
2014 2013
2012 2011
2010 2009
2008
0 50 100 150 200
7 years
WeatherGeophysical
43%
15.8m
9%1.5m 10% 4.0m 8% 1.1m 2% 0.7m 8% 1.8m
14%
26.7m 57%
20.8m
91%
15.3m
90% 38.3m
92% 13.9m
98% 31.7m
92%
20.4m
9% 1.7m 91% 17.5m
19.3m
36.5m
16.7m
42.4m
15.0m
32.4m
22.3m
184.6m
86%
157.8m
People displaced (millions)
People displaced (millions)
Average, 26.4m
Note: Differences in totals are due to rounding of figures to the nearest decimal point. Source: IDMC data as of 1 June 2015
Displacements of fewer than 100,000 people made up 95.4 per cent of the events recorded in 2014, but only 17 per cent of the total number displaced (see igure 3.3b). A third of all events were very small, displacing fewer than 100 people each, and their contribution to the global total was negligible. At the same time, it should be noted that small events tend to be poorly reported in most countries and their true number is probably much higher.
3.3 Variance from year to year
As can be seen in table 3.1, the total number of people displaced varies greatly from year to year, depending on the fre-quency and size of the largest disasters.
Figure 3.2: Global displacement by type of hazard
Earthquakes 8%1.5m
Floods 43% 8.3m
Extreme temperatures 1% 958,000 Volcanic eruptions 1%245,000
Storms 48% 9.1m Storms 48% 9.1m
Floods 55% 102m
Storms 29% 53.9m Earthquakes
14%25.8m
Storms Floods Wildfires Earthquakes Volcanic
eruptions
Extreme temperatures
Dry mass movements Wet mass
movements
2014 2008 - 2014
[image:23.595.61.535.356.518.2]Note: figures rounded to nearest 1,000 or 100,000 Source: IDMC data as of 1 June 2015
Table 3.1: Annual variance in disasters displacing more than a million people, 2008 to 2014
Year
Very large and
mega events
Displaced
(millions)
Hazard
Country
2008
8 1.7 - 15.0 Earthquake, loods (4), storms (3) China (2) India (3), Myanmar, Philippines, US2009
3 1.6 - 2.5 Flood, cyclones (2) China, India (2)2010
7 1.0 - 15.2 Floods (5), earthquakes (2) Chile, China, Colombia (2), Haiti, Pakistan, Thailand2011
2 1.5 - 3.5 Floods (2) China, Thailand2012
8 1.4 - 6.9 Floods (5), storms (3) China (2), India (2), Nigeria, Pakistan, Philippines (2)2013
6 1.0 - 4.1 Floods (2), storms (4) Bangladesh, China, India (2), Philippines (2) [image:23.595.63.281.565.770.2]2014
3 1.1 - 3.0 Storms (2), lood India, Philippines (2)Figure 3.3: Displacement by scale of event
0 20 40 60 80 100
2014 2013 2012 2011 2010 2009 2008
Percenta
ges
Note: All percentages are rounded. Source: IDMC data as of 1 June 2015
a)
2008-2014:
Proportion of total displaced per year by event size41% 39% 7%
13%
40% 53% 1% 6%
88% 11% 1%
23% 65% 1%
11%
18% 71% 2%
9%
31% 17%
52%
62% 33% 5%
Large events
(100,000 - 999,999 displaced)
Very large events (1 - 3 million displaced)
Mega events (>3 million displaced) Very small to medium events
(fewer than 100,000 displaced)
b)
2014:
Displacement by event size compared with number of events at different scalesii. Events i. People displaced
31% 5.9m 52% 10.0m 17% 3.3m
0.4% 3 events 4.2% 29 events
95.4% 663 events
Meanwhile, its latest iteration already provides a reasonable approximation of the general historical trend and some vali-dation of expected displacement patterns that are also relected in our data for 2008 to 2014 (see annex A.2).
Latest indings show that the total number of people displaced in 2014, though lower than the average for the past seven years, is part of a longer-term upward trend in displacement since 1970. Even adjusting for population growth, the average amount of displacement as-sociated with disasters has increased by 60 per cent in a little over four decades. (see igure 3.4.a).3
This is driven mostly by the increas-ing concentration of people in exposed locations, combined with their growing
3.4 Displacement trend from 1970
to 2014
IDMC has used probabilistic model-ling to generate coarse-grained displace-ment estimates going back to 1970. We continue to develop the model, with a recent focus on increasing the size of our data sample for the calibration of the estimates.
[image:24.595.61.533.369.592.2]The model is dependent on the quality and availability of global data. A number of important caveats should be kept in mind. Firstly, the sample sizes are too small to make inferences about individual coun-tries. Secondly, extreme hazards occur rel-atively infrequently. Those that occur once every 100, 500 or 1,000 years are unlikely to be captured in four decades of data and by their very nature, they are hard to quantify.
Figure 3.4: Modelled global displacement trend for 1970 to 2014 (per million inhabitants)
People displaced per million inha
bitants
0 1,000 2,000 3,000 4,000 5,000 6,000 7,000
2014 2008
2000 1990
1980 1970
Modelled trend
IDMC annual data
Source: IDMC data as of 1 June 2015
vulnerability.4 More frequent and intense
extreme weather events associated with climate change are expected to accentu-ate the trend.5
Box 3.1: “Super” El Niño and displacement in 1998 - a year of extremes
This year, the planet has entered a new climatic period characterised by above average sea surface temperatures in the eastern and east-central Paciic Ocean. This natural phenomenon is known as the El Niño Southern Oscillation. It occurs at irregular intervals of two to seven years and lasts for nine months to two years, and it has a signiicant effect on patterns of extreme weather and climate-related disasters.6 There is no consensus on how iterations of El Niño will change as the
global climate warms, but studies suggest that they are becoming more intense.7
The strongest El Niño ever reco