FINAL PROJECT
–
TI 141501
VALUATING INDONESIAN UPSTREAM OIL MANAGEMENT
SCENARIO THROUGH SYSTEM DYNAMIC MODELLING
FARIZA AULIA PUTRI
Student ID 2513 100 058
Supervisor
Dr. Ir. I Ketut Gunarta, M.T.
NIP
196802181993031002
INDUSTRIAL ENGINEERING DEPARTMENT
Faculty of Industrial Technology
TUGAS AKHIR
–
TI 141501
VALUASI SKENARIO TATA KELOLA HULU MINYAK BUMI
DENGAN PEMODELAN SISTEM DINAMIK
FARIZA AULIA PUTRI
NRP 2513 100 058
Dosen Pembimbing
Dr. Ir. I Ketut Gunarta, M.T.
NIP
196802181993031002
DEPARTEMEN TEKNIK INDUSTRI
Fakultas Teknologi Industri
[i]
VALUATING INDONESIAN UPSTREAM OIL
MANAGEMENT SCENARIO THROUGH SYSTEM DYNAMIC
MODELLING
Student Name : Fariza Aulia Putri Student ID : 2513100058
Supervisor : Dr. Ir. I Ketut Gunarta, M. T.
ABSTRACT
Under the existing regulation in Constitution Number 22 Year 2001 (UU No 22 Tahun 2001), Production Sharing Contract (PSC) continues to be the scenario in conducting oil and gas upstream mining activities as the previous regulation (UU No. 8 Tahun 1971). Because of the high costs and risks in upstream mining activities, the contractors are dominated by foreign companies, meanwhile National Oil Company (NOC) doesn’t act much. The domination of foreign contractor companies also warned Indonesia in several issues addressing to energy independence and energy security.
Therefore, to achieve the goals of energy which is independence and security, there need to be a revision in upstream oil activities regulating scenario. The scenarios will be comparing the current scenario, which is PSC, with the “full concession” scenario for National Oil Company (NOC) in managing oil upstream mining activities. Both scenario will be modelled using System Dynamics methodology and assessed furthermore using financial valuation method of income approach. Under the 2 scenarios, the author will compare which scenario is better for upstream oil management in reaching the goals mentioned before and more profitable in financial aspect. From the simulation, it is gathered that concession scenario offers better option than PSC in reaching energy independence and energy security.
Keywords: Upstream Oil Management, Energy Independence, Energy
[ii]
[iii]
VALUASI SKENARIO TATA KELOLA HULU MINYAK BUMI
DENGAN PEMODELAN SISTEM DINAMIK
Nama Mahasiswa : Fariza Aulia Putri
NRP : 2513100058
Dosen Pembimbing : Dr. Ir. I Ketut Gunarta, M. T.
ABSTRAK
Dibawah regulasi UU Nomor 22 Tahun 2001, Production Sharing Contract
(PSC) tetap menjadi skenario dalam pengelolaan sektor hulu minyak bumi dan gas seperti yang terdapat pada UU Nomor 8 Tahun 1971. Tingginya biaya yang diperlukan dalam melakukan aktivitas hulu minyak dan gas serta tingginya risiko yang ada, kontraktor didominasi oleh perusahaan – perusahaan asing, sedangkan perusahaan minyak nasional (NOC) tidak melakukan banyak aktivitas di sektor ini. Dominasi kontraktor asing menyebabkan Indonesia rentan terhadap isu – isu kemandirian energi dan ketahanan energi.
Oleh karena itu, untuk mencapai tujuan kemandirian energi dan ketahanan energi, perlu adanya perbaikan terhadap skenario tata kelola hulu minyak. Dalam penelitian ini, akan dibandingkan skenario saat ini yaitu PSC dengan skenario konsesi bagi NOC untuk pengelolaan sektor hulu minyak. Kedua skenario akan dimodelkan dengan pendekatan Sistem Dinamik dan akan dinilai dengan metode valuasi menggunakan pendekatan pendapatan. Dari kedua skenario, akan dipilih skenario yang lebih baik untuk mencapai tujuan tata kelola hulu minyak. Hasil simulasi menunjukkan bahwa skenario konsesi menawarkan sistem tata kelola yang lebih baik dibandingkan PSC dalam mencapai kemandirian energi dan ketahanan energi.
Kata Kunci: Tata Kelola Hulu Minyak, Kemandirian Energi, Ketahanan
[iv]
[v]
PREFACE
Alhamdulillah, the author would like to praise Allah SWT for all His mercy, blessings, and guidance given to the author therefore this final project report can be finished on time. Shalawat and salaam also delivered for our beloved Prophet Muhammad SAW.
This final project is written to fulfill the requirement in obtaining Bachelor Degree in Bachelor Program of Industrial Engineering. It can’t be finished without the help of other people. Therefore, the author would also like to express gratitude and thankful feelings for these people who have helped the author in finishing this final project:
1. Author’s beloved family; Father (Ir. Akhmad Masurkan), Mother (Afriana Herlinawati), Brother (Risyad Alauddin Zaidan), Sister (Nadin Almira Yasmin), Grandmothers, and big family for all the prayers, support, care, and attention.
2. Dr. Ir. I Ketut Gunarta, M.T. as the author’s supervisor for his guidance, knowledge, time, patience, and valuable experiences so this final project can be completed.
3. Dr. Ir. Bambang Syairudin, M.T.; Naning Aranti Wessiani, S.T., M.M.; and Mar’atus Sholihah, S.T., M.T as the author’s final project test examiner for their guidance, critics, and recommendation in order to make this final project. 4. Mr. Akhmad Ramadhani (TI – 25) and Mr. Felix Andrian who have assisted
the author in doing this final project.
5. Author’s beloved TI – 29 (CYPRIUM) who have shared knowledge and experience, prayers, and spirit in doing this final project.
[vi]
parties, to make this final project better. With the release of this final project, the author wished that it can be useful and beneficial for the development of knowledge.
Surabaya, July 2017
[vii]
TABLE OF CONTENTS
ABSTRACT ... i
ABSTRAK ... iii
PREFACE ... v
TABLE OF CONTENTS ... vii
LIST OF FIGURES ... xi
LIST OF TABLES ... xiii
CHAPTER 1 INTRODUCTION ... 1
1.1 Background ... 1
1.2 Problem Formulation ... 5
1.3 Research Objective ... 6
1.4 Research Benefits ... 6
1.5 Research Scope ... 6
1.5.1 Limitations ... 6
1.5.2 Assumptions ... 7
1.6 Writing Systematics ... 7
CHAPTER 2 THEORETICAL FRAMEWORK ... 9
2.1 Oil and Gas Management ... 9
2.1.1 History of Oil and Gas Management in Indonesia ... 9
2.2 Oil Industry ... 14
2.2.1 Indonesia’s Oil Reserves ... 14
2.2.2 Indonesia’s Oil Consumption and Production ... 15
2.3 National Oil Company ... 16
2.4 System Approach ... 20
2.5 System Dynamics Methodology ... 21
[viii]
2.6 Modelling and Simulation ... 23
2.7 Model Verification and Validation Testing ... 25
2.8 Financial Valuation ... 26
2.8.1 Discounted Cash Flow (DCF) Method ... 27
2.8.2 Direct Capitalization Method ... 28
2.9 Previous Researches ... 29
CHAPTER 3 RESEARCH METHODOLOGY ... 31
3.1 Flowchart of Research Methodology ... 31
3.2 Introduction Phase ... 32
3.2.1 Literature Study ... 32
3.2.2 Early Data Collection ... 32
3.2.3 Problem Formulation ... 33
3.3 Data Collection and Processing Phase ... 33
3.3.1 Dynamic Hypothesis ... 33
3.4 System Modelling Phase ... 33
3.4.1 Model Formulation ... 33
3.4.2 Model Testing ... 34
3.4.3 Scenario Development and Financial Valuation ... 34
3.5 Data Analysis and Interpretation Phase ... 34
3.5.1 Output Analysis and Interpretation ... 34
3.6 Conclusion and Recommendation Phase ... 35
3.6.1 Conclusion and Recommendation ... 35
CHAPTER 4 SIMULATION MODEL DESIGN ... 37
4.1 Current System Identification ... 37
4.1.1 Upstream Oil Mining Activity (Production) ... 37
[ix]
4.1.3 Crude Oil Consumption ... 39
4.1.4 Investment in Upstream Oil Mining ... 42
4.1.5 Revenue Stream of Upstream Oil Mining ... 43
4.2 Dynamic Hypothesis ... 45
4.2.1 Variable Identification ... 45
4.2.2 Causal – Loop Diagram ... 56
4.3 Stock and Flow Diagram ... 58
4.3.1 Main Model ... 58
4.3.2 Submodel Production ... 59
4.3.3 Submodel Consumption ... 60
4.3.4 Submodel Oil Market ... 61
4.3.5 Submodel Investment ... 62
4.3.6 Submodel Income... 64
4.4 Verification and Validation ... 66
4.4.1 Model Verification ... 66
4.4.2 Model Validation ... 69
CHAPTER 5 SIMULATION OUTPUT ANALYSIS & SCENARIO DEVELOPMENT ... 75
5.1 Before Concession Scenario (As-Is) ... 75
5.1.1 Amount of Oil Reserves ... 75
5.1.2 Oil Supply and Demand ... 78
5.1.3 Net Present Value ... 80
5.2 After Concession Scenario ... 84
5.2.1 Amount of Oil Reserves ... 84
5.2.2 Oil Supply and Demand ... 88
[x]
5.3 Comparison between Both Scenario ... 94
CHAPTER 6 CONCLUSION AND RECOMMENDATION ... 95
6.1 Conclusion ... 95
6.2 Recommendation ... 96
REFERENCES ... 97
APPENDIX ... 101
[xi]
LIST OF FIGURES
Figure 1.1 World Energy Consumption ... 1
Figure 1. 2 Indonesia’s Energy Consumption ... 2
Figure 2. 1 Reserve and Resource Classification Framework in PRMS 2011 ... 14
Figure 2. 2 Indonesia’s Oil Reserves Chart 2010 – 2015 ... 15
Figure 2. 3 Indonesia’s Oil Consumption and Production Chart 2010 – 2015 ... 16
Figure 2. 4 Major Indonesian Oil Producers as of January 2016 ... 19
Figure 2. 5 Illustration of System ... 20
Figure 2. 6 Causal Loop Diagram of Adoption... 22
Figure 2. 7 Simulation Procedure... 24
Figure 2. 8 Symbols in Stock and Flow Diagram ... 25
Figure 3. 1 Flowchart of Research Methodology... 32
Figure 4. 1 Subsidiary Companies of NOC ... 17
Figure 4. 2 Oil Consumption of Each Category (2005 – 2015) ... 40
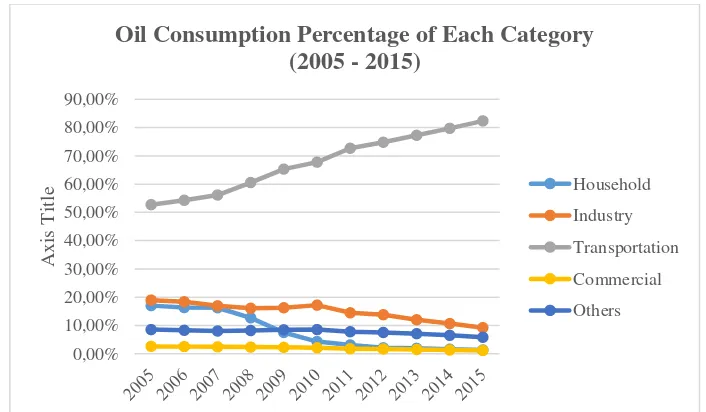
Figure 4. 3 Oil Consumption Percentage of Each Category (2005 – 2015) ... 40
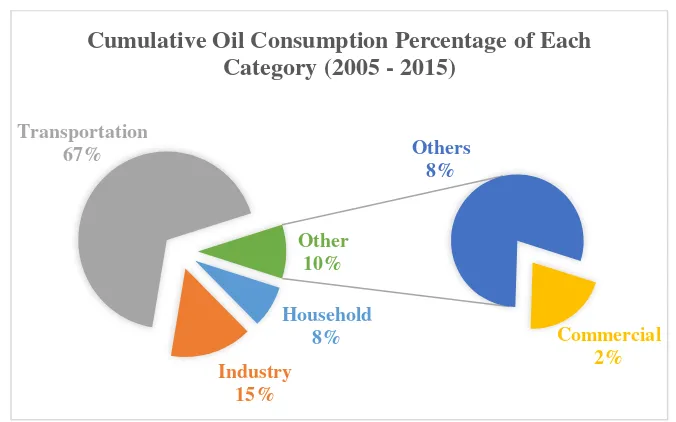
Figure 4. 4 Cumulative Oil Consumption Percentage of Each Category (2005 – 2015) ... 41
Figure 4. 5 Revenue Stream in Upstream Oil Mining ... 44
Figure 4. 6 Causal Loop Diagram of Indonesian Oil Management ... 57
Figure 4. 7 Main Model of Indonesian Oil Management... 58
Figure 4. 8 Submodel Production ... 60
Figure 4. 9 Submodel Consumption... 61
Figure 4. 10 Submodel Oil Market ... 62
Figure 4. 11 Submodel Investments ... 63
Figure 4. 12 Submodel Income ... 65
Figure 4. 13 Check Unit Menu ... 67
[xii]
Figure 4. 15 Verify/Repair Model Menu ... 68
Figure 4. 16 Model Verification ... 69
Figure 4. 17 Simulation Output of Submodel Production ... 70
Figure 4. 18 Simulation Output of Submodel Consumption ... 71
Figure 4. 19 Simulation Output of Submodel Oil Market ... 72
Figure 4. 20 Extreme Condition Testing Result of Submodel Production ... 73
Figure 5. 1 Simulation Output of Oil Reserves Before Concession ... 75
Figure 5. 2 Simulation Output of Oil Supply and Demand Before Concession .... 78
Figure 5. 3 Simulation Output of Net Present Value Before Concession ... 80
Figure 5. 4 Variables in Submodel Production After Concession ... 84
Figure 5. 5 Simulation Output of Oil Reserves After Concession ... 85
Figure 5. 6 Simulation Output of Oil Supply and Demand After Concession ... 88
[xiii]
LIST OF TABLES
Table 2. 1 Comparison of PSC Generations ... 13
Table 2. 2 Previous Researches ... 29
Table 4. 1 Oil Field Managed by NOC ... 18
Table 4. 2 Number of Household ... 39
Table 4. 3 Oil Consumption per Capita (barrel) ... 41
Table 4. 4 Amount of Investment in Upstream Oil Mining ... 42
Table 4. 5 Variables in Submodel Production ... 45
Table 4. 6 Variables in Submodel Consumption ... 48
Table 4. 7 Variables in Submodel Oil Market ... 50
Table 4. 8 Variables in Submodel Investments ... 50
Table 4. 9 Variables in Submodel Income ... 53
Table 5. 1 Numerical Output of Oil Reserves Before Concession ... 76
Table 5. 2 Numerical Output of Oil Supply and Demand Before Concession ... 78
Table 5. 3 Numerical Output of Income Before Concession ... 81
Table 5. 4 Numerical Output of NPV Before Concession ... 82
Table 5. 5 Numerical Output of Oil Reserves After Concession ... 86
Table 5. 6 Numerical Output of Oil Supply and Demand After Concession ... 88
Table 5. 7 Numerical Output of Income After Concession ... 91
Table 5. 8 Numerical Output of NPV After Concession ... 92
[xiv]
[1]
CHAPTER 1
INTRODUCTION
This chapter contains the background in doing this final project, the problems formulation that will be solved, the objective in conducting final project, the benefits of doing final project for both author and the company, research scope in form of limitations and assumptions, and final project writing systematics.
1.1 Background
Energy has become the main supporter of human life, such as oil and gas. Oil has become the major energy resource in the world since 1990s with the highest consumption, followed by coal and gas, as shown in the figure below.
Figure 1.1 World Energy Consumption
Source: BP Statistical Review of World Energy, 2016
Since the 1990s until 2015, oil has been consumed for more than 4000 million tons/year in the world. Coal became the 2nd largest consumption, which is
[2]
The domination of oil, coal, and gas also happened in Asia – Pacific region, including Indonesia, which still mainly rely on those resources. Oil dominates the usage of energy in Indonesia for around 32%, followed by coal for 23% and natural gas for 13% in 2014. Industrial sectors dominated the energy usage for 48%, followed by transportation sectors for 35%, household sectors for 11%, commercial sectors 4% and other sectors 2%.
Figure 1. 2 Indonesia’s Energy Consumption Source: BPPT Energy Outlook, 2016
All the energy needs are projected to be rising for the years ahead due to the growth of Indonesian Gross Domestic Product (GDP) which is composed by the energy user sectors. With the basic scenario that there will be 6% increase in GDP per year since 2014, energy needs will increase for 5.8 times in 2050. The needs of oil will increase up to 40.7% in 2050 due to the high usage especially in transportation sector. Meanwhile, the needs of natural gas will only increase up to 13.8% in 2050. The certain increase in energy needs, especially oil and gas, unfortunately not followed by Indonesia’s ability in fully supplying both oil and gas. Indonesia has been facing the supply deficit.
[3]
caused by the high production amount of oil, is also caused by the energy needs which is not as high as nowadays. Aside from the peak oil era, Indonesia’s oil production continues to decline seriously. Since 2008, Indonesia could only produce oil and gas for 977 thousand oil barrels/day and continues to decline until 786 thousand oil barrels/day in 2015 (SKK Migas, 2015). Indonesia’s oil production declined for 3.9% annually since 2009.
To fulfill the oil demand, Indonesia had to import both oil both in crude and refined forms, from several countries. In 2013, Indonesia imported 355.61 million barrels of crude oil, 237.41 million barrels refined oil, and 41.11 million barrels of gas. Indonesia, which became the 30th country with great oil reserves, even imported oil from South Korea and Taiwan which became the 94th country with
great oil reserves (Indirasardjana, 2014). With the increase in oil and gas demand, as the consequences, the amount of oil and gas import also increases from 122 million barrels in 2014 to 1.235 million barrels in 2050 (BPPT, 2015). Indonesia has turned to the net importer of oil and gas since 2004, even Indonesia used to be the net exporter of oil and became one of OPEC (Organization of Petroleum Exporter Countries) members. Not only become an irony for Indonesia, oil import also drained Indonesia’s revenue due to the unstable exchange rate against the US Dollar.
Besides the fact that Indonesia imported oil, Indonesia actually has great reserves of oil (both conventional and non-conventional reserves) which is remain undiscovered. Geologically, Indonesia has various potential oil basins as the conventional oil reserves. From 128 potential oil basins, 38 of them has been explored (Indirasardjana, 2014). Shale oil and gas reserves, which is the non-conventional reserves, haven’t been explored yet, whereas the other countries such as the USA and Canada have commercially produced them while China, Argentina, and Russia are hunting for these new oil reserves. Indonesia mainly focused on exploring oil from western Indonesia’s oil basins, which actually only produce a few amounts.
[4]
on those fields using the water injection or Enhanced Oil Recovery (EOR). The most contributing factor is the lack of exploration activities of new oil and gas reserve in Indonesia. The new fact that 60% Indonesia’s potential oil reserves located in Indonesian offshore deep-water and requires an advanced technology with high investment costs also caused the low rate of oil exploration and furthermore other upstream mining activities.
Since 1971, the upstream oil and gas mining activities are regulated by Constitution Number 8 Year 1971 (UU No 8 Tahun 1971) using Production Sharing Contract (PSC) scheme. Indonesian government act as the owner of all oil fields in Indonesia. National Oil Company (NOC) own the oil fields but doesn’t do the upstream mining activities. The upstream mining activities are done by the contractors who signed the contract (Kontrak Kerja Sama/KKS) with SKK Migas as the regulator of oil and gas mining activities in Indonesia. Under the KKS, the ownership of oil fields held by Indonesian government from the beginning until the end of upstream mining activities. The production could only occur when the oil fields are proven economically-produced by the government. After production, there will be result sharing between the contractor and the government with specified percentage as stated in KKS. The KKS contractor must provide the whole initial investment costs for upstream mining activities but there is cost recovery scheme that will reimburse the “costs of oil” after the fields produce economically. When the fields can’t produce economically, or even the exploration fails, the risks of loss will be owned by the contractors. Under the existing regulation in Constitution Number 22 Year 2001 (UU No 22 Tahun 2001), PSC continues to be the scheme in conducting oil and gas upstream mining activities. Because of the high costs and risks in upstream mining activities, the contractors are dominated by foreign companies, meanwhile NOC doesn’t act much. The domination of foreign contractor companies also warned Indonesia in several issues addressing to energy independence and energy security.
[5]
activities. Both scenario will be modelled using System Dynamics methodology and assessed furthermore using financial valuation method of income approach.
System dynamics has been known as the systemic thinking discipline in system science. This methodology was firstly introduced by Jay Forrester from Massachusetts Institute of Technology (MIT) in 1963 and has been improved continuously. In its development, system dynamics has been used for analyzing and solving social, economic, managerial, political, and environmental issues which is complex, dynamic (fast-changing), and uncertain. System dynamics is important in studying system, offering comprehensive and integrated thinking which can simplify complexity without losing the essential object and also suitable in analyzing mechanisms, pattern, and system tendency based on analysis of system’s complex, dynamic, and uncertain structure and behavior.
Value means the sum of economic benefits expected in the future by the owner, where each benefit is discounted to the present value with the adequate discount rate (Prawoto, 2004). Financial valuation method is used in this research to measure the value that will be got be the company before implementing the concession and after implementing the concession scenario.
Using the System Dynamics methodology and financial valuation, the author will compare which scenario is better for oil and gas management in reaching the goals mentioned before and more profitable in financial aspect. The chosen scenario will furthermore be the recommendation for the regulator in oil and gas management in Indonesia.
1.2 Problem Formulation
[6]
1.3 Research Objective
The objective of conducting this research are as follows:
1. Finding the better upstream oil management scenario for National Oil Company to bring Indonesia to energy independence and energy security. 2. Valuating both the existing and the new oil management schenario using
method in valuation.
1.4 Research Benefits
The benefits that can be attained from this research for the author are: 1. Understanding the application of knowledge gained from lecture in the real
world.
2. Understanding the function of system dynamics methodology in evaluating a policy.
3. Sharing knowledge that the author had to the reader of this research.
The benefits that can be attained from this research for National Oil Company (NOC) are:
1. Receiving recommendation about the best oil and gas management scenario based on valid scientific research.
1.5 Research Scope
The scope of this research includes the limitations of this research and the assumptions that are used in conducting the research.
1.5.1 Limitations
The limitations applied in this research are:
1. The research will be conducted only for upstream oil mining activity. 2. Secondary data is used in conducting this research.
3. The method used for this research are limited to system dynamics and financial valuation.
[7]
1.5.2 Assumptions
The assumptions that are used in this research are:
1. There’s no structural change in National Oil Company (NOC) and also no change in any governmental law and constitution regarding to oil and gas. 2. Value of USD and other foreign currency are assumed stable during the
making of financial model in this research.
3. Model is simplified by assuming that not all variables are dynamic.
4. Operational method in upstream oil mining activity is gathered from the expert.
1.6 Writing Systematics
This subchapter will explain the systematical writing used in this research. The systematics of this research are as follows:
CHAPTER I INTRODUCTION
This chapter explains the background of this research, the problems that are solved through this research, the objective of conducting this research, benefits of conducting research for both the author and the company, the research scope in the form of limitations and assumptions, and the writing systematics of this research.
CHAPTER II THEORETICAL FRAMEWORK
This chapter contains the fundamental theories and formulas that underlie this research. Literature review helped the author in determining which method that is useful to solve the problems in this research. Literature review in this research are taken from the trusted source such as books, journals, previous research, and others.
CHAPTER III RESEARCH METHODOLOGY
[8]
CHAPTER IV SIMULATION MODEL DESIGN
This chapter contains the current system identification, collection of secondary data that is used for conducting the research, variable identification, conceptual modelling using causal loop diagram, simulation modelling using stock and flow diagram, and model testing through verification and validation.
CHAPTER V SIMULATION OUTPUT ANALYSIS & SCENARIO
DEVELOPMENT
This chapter contains the analysis of simulation result for both before concession and after concession scenario. Both of the scenarios will be compared and valuated to select the best scheme for managing upstream oil mining activity.
CHAPTER VI CONCLUSION AND RECOMMENDATIONS
[9]
CHAPTER 2
THEORETICAL FRAMEWORK
This chapter contains the basic theories and methods that will be used in solving the problems formulated. The literature review consists of oil and gas management overview, oil and gas industry, system dynamics modelling, and financial analysis.
2.1 Oil and Gas Management
Oil and gas management review will explain more about the history of oil and gas management in Indonesia, the regulations for oil and gas activity in Indonesia, and oil and gas management model in other oil-producing countries.
2.1.1 History of Oil and Gas Management in Indonesia
Oil and gas management in Indonesia have existed for more than 130 years, started since the first discovery of oil in North Sumatra in 1885. The first oil discovery happened in Dutch colonialism era, making the management of oil and gas industry done by Dutch companies. As the long history of oil and gas, Indonesia has been running various management model to accommodate oil and gas consumption and production for all Indonesian people. The history of oil and gas management in Indonesia will be divided into 3 eras, which is colonialism era, post-independenceera, and modern industrial era.
2.1.1.1 Colonialism Era
[10]
constitution, changing the concession holder only limited to the Dutch, legal entity, or companies built in the Netherlands. Further amendment was done in 1918 by adding new clauses named Contract 5A. The Contract 5A stated that oil and gas mining activities can be done by the Netherland-Indies government. When the activities done by other party, the Netherland-Indies government will receive income from the concession holder. The foreign companies (not owned by the Netherland-Indies government) that held concession right were Standard of New Jersey (STANVAC) in 1925 and Standard of California (CALTEX) in 1936.
2.1.1.2 Post-Independence Era
After the independence of Indonesia in August 17th, 1945, the government
released a constitution “UU No. 40 Tahun 1960” about oil and gas mining. UU No. 40 Tahun 1960, that became the extension of UUD 1945 Pasal 33 ayat 2, not only deleting the previous concession system but also holding the sovereignty of oil and gas resources. Some of the regulations in this constitution are:
• All oil, gas, and minerals located in Indonesian legal mining area are the national wealth managed by country.
• Oil and gas mining only undertaken by country and only conducted by national company.
As UU No. 40 Tahun 1960 applied in Indonesia, the existing foreign oil companies (Caltex, Stanvac, and Shell) are asked to adjust their operational activity with the new regulation. To implement this regulation, the government established three national companies, named Permina, Pertamin, and Permigas. Besides doing oil and gas mining activity, those companies also supervise the foreign oil companies operation.
[11]
• Caltex, Stanvac, and Shell discharging the concession right 5A and operating as the contractor of national company.
• Operational and managerial risk are on behalf of the contractors.
• Fund and expert human resources for operations are provided by the contractors.
• Kontrak Karya lasts for 20 years.
• Marketing and distribution facilities handed-over in 5 years.
• Oil refinery is handed – over in 10 – 15 years.
• Profit sharing between the government and contractor is 60% : 40%. The government will receive at least 20% of annual gross oil production.
• Contractor will hand 25% of its wealth as Domestic Market Obligation (DMO) and gained 0.2 $/barrel as fee.
As the foreign companies no longer holding the status as concession holder, the management is still held by them. In the implementation of this contract, there’s almost no significant changes as the government role only limited to supervision and the foreign companies still doing operation as the previous system (concession). After G30S/PKI occurred in Indonesia in 1965, new regime ruled in Indonesia and led by Soeharto, changing the previous regime that was ruled by Soekarno. Permina then ruled by Dr. Ibnu Sutowo who criticized Kontrak Karya and stating that Kontrak Karya has no difference with concession. The system then continued to change to other system.
2.1.1.3 Modern Era
[12]
industry. Japan Petroleum Exploration Company (Japex), Refining Associates Ltd. Canada (REFICAN), Kyushu Oil Development Company Ltd., and Asamera Oil Indonesia Ltd. moreover following IIAPCO’s footstep in signing PSC contract.
Behind the great achievement of PSC, the legality of PSC was still questioned due to the absence of regulation stating about PSC, since UU No. 44 Tahun 1960 only recognizing Kontrak Karya. Meanwhile, the other regulation, UU No. 1 Tahun 1967 about foreign investment (Penanaman Modal Asing/PMA), only regulating foreign investment about mining sector except oil and gas. Then in 1971, the government released UU No. 8 Tahun 1971 about Pertamina which become the legal foundation of PSC. PSC was stated in article 12 verse 1 and verse 2.
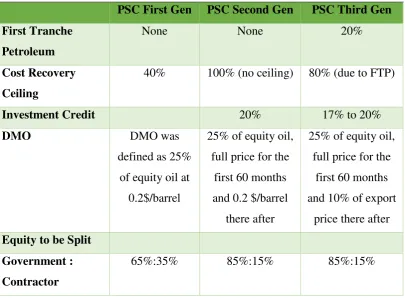
PSC development is divided into 3 phases as follows: 1. PSC First Generation (1966 – 1975)
• Oil and gas company work as contractor of Pertamina
• Pertamina holds all contractor's activity management
• Cost Recovery limited to 40% of annual income
• The difference between annual gross income and cost recovery (60%) is shared between Pertamina and contractor as much as 65%:35%. Government’s take can increase up to 67.5% for certain bigger production rate.
• Contractor must supply 25% of production rate for domestic demand (DMO) for 0.2$/barel.
2. PSC Second Generation (1976 – 1988)
• Cost recovery isn’t limited and based on Generally Accepted Accounting Principle (GAAP).
• The difference between gross income and cost recovery shared between Pertamina and contractor for each 65.91%:34.09% (oil) and 31.82%:68.18% (gas).
[13]
• With the existence of tax constitution year 1984, where the tax rate decrease from 56% to 48%, to defend the sharing percentage as mentioned before, production sharing before taxed is changed to 71.15%:28.85% (oil) and 42.31%:57.69% (gas).
• For the new field, contractor is given the investment credit for 20% of capital expenditure for production facility.
• Capital expenditure can be depreciated for 7 years using Double Declining Balance (DDB) method.
3. PSC Third Generation (1988 – now)
The 2ndPSC generation didn’t provide cost recovery ceiling that can ensure government’s income. Since the government needed income warranty, PSC 2nd generation was updated and First Tranche Petroleum (FTP) term was introduced. 20% of FTP amount (before subtracted by cost recovery) will be shared first between government and contractor. The difference between all generations of PSC is provided in the table below.
Table 2. 1 Comparison of PSC Generations
PSC First Gen PSC Second Gen PSC Third Gen full price for the
first 60 months and 0.2 $/barrel
there after
25% of equity oil, full price for the
first 60 months and 10% of export
price there after
Equity to be Split
Government :
Contractor
[14] Table 2. 1 Comparison of PSC Generations
PSC First Gen PSC Second Gen PSC Third Gen
Oil : Gas NA 70%:30% or
65%:35%
70%:30% or 65%:35%
2.2 Oil Industry
This subchapter will furthermore review about Indonesia’s oil reserves, Indonesia’s oil consumption, and Indonesia’s oil production.
2.2.1 Indonesia’s Oil Reserves
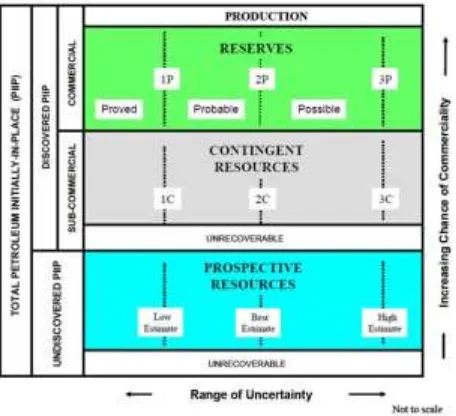
Oil and gas industrial activities have produced various vocabularies related to reserves. Collaboration of several oil and gas institutions in the world (SPE, AAGP, WPC, SPEE, and SEG) releases oil and gas resource management system called Petroleum Resources Management System (PRMS) with the latest edition released in November, 2011. PRMS is the integrated system for basic classification and categorization of petroleum reserves and resources. PRMS divided each project to 3 main classes called Reserves (satisfied commerciality), Contingent Resources (satisfied sub-commerciality), and Prospective Resources (undiscovered). The illustration of PRMS is provided below.
[15]
To fulfill the commerciality terms, the amount of project reserves can be estimated. Based on this classification, reserves are classified into 3 kinds, those are proved (1P), probable (2P), and possible or potential (3P). Where the uncertainty ranges from low estimation (1C), best estimation (2C), and highest estimation (3C). The amount of oil and gas reserves can be shown in the figure below.
Figure 2. 2 Indonesia’s Oil Reserves Chart 2010 – 2015 Source: SKK Migas Annual Report, 2015
Indonesian potential oil reserves have been decreasing slightly each year from 2010 to 2015. While the proven oil reserves declined gradually since 2010 to 2015. This phenomenon caused the almost stable total oil reserves from 2010 to 2015.
2.2.2 Indonesia’s Oil Consumption and Production
Oil and gas are needed as the energy that fueled many sectors in our life. In 2010, Indonesian oil consumption was 1402 thousand barrels/day and it exceeds the production ability which was only 1003 thousand barrels/day (British Petroleum, 2016). Oil consumption, instead of align with the production capacity, raised gradually since 2010. In 2011, oil consumption raised to 1589 thousand barrels/day until 1676 thousand barrels/day in 2014. The condition turned when in 2015, oil consumption decreased slightly to 1628 thousand barrels/day.
Despite the rising demand of oil, the oil production showed conversely performance. Oil production has never exceeded oil consumption since 2010, which
[16]
was only 1003 thousand barrels/day. Oil production continued to decrease until it reached 852 thousand barrels/day in 2014 with the decease rate of 5% per year (BPPT, 2016). Production raised slightly to 876 thousand barrels/day in 2015, yet it still couldn’t fulfill the oil demand in 2015. The dynamics of Indonesian oil consumption and production can be seen in the graph below.
Figure 2. 3 Indonesia’s Oil Consumption and Production Chart 2010 – 2015 Source: BP Statistical Review of World Energy, 2016
For several years coming, the demand of oil is projected to increase. The demand of oil will increase 3 times compared to 2014 (BPPT, 2016). Meanwhile, oil production is projected to decrease continuously until 52 million barrels in 2050.
As the consequence of declining production and demand of oil, the government allowed importing oil. Amount of oil import is projected to increase to 933 million barrels in 2050 (basic scenario) and 1,235 million barrels (high scenario).
2.3 National Oil Company
The term NOC refers to National Oil Company which is the oil company owned by a country or mostly owned by the country. There is only 1 NOC that operates in Indonesia and 100% owned by Indonesian government which is PT Pertamina (Persero). According to Peraturan Pemerintah Nomor 31 Tahun 2003,
Perusahaan Pertambangan Minyak dan Gas Bumi Negara transformed to PT
1402 1589
1631 1643 1676 1628
1003 952 918
INDONESIAN OIL CONSUMPTION
AND PRODUCTION
[17]
Pertamina (Persero) that doing upstream to downstream oil and gas mining. Indonesian NOC has the vision “to be world class national energy company” and brings the mission “to carry out integrated core business in oil, gas, renewable, and new energy based on strong commercial principles”. NOC has 2 main goals as follows:
1. Implementing and supporting Government’s policies and programs in Economic and National Development in general particularly in the Organization of Oil and Gas Business both domestic and overseas as well as other activities which are related to or support business activities in the oil and gas sectors, and
2. Development on the resource optimization owned by the Company to produce high-quality goods and/or services and strong competitive as well as to pursue profit in order to improve company’s value by applying the Limited Liability Company principles.
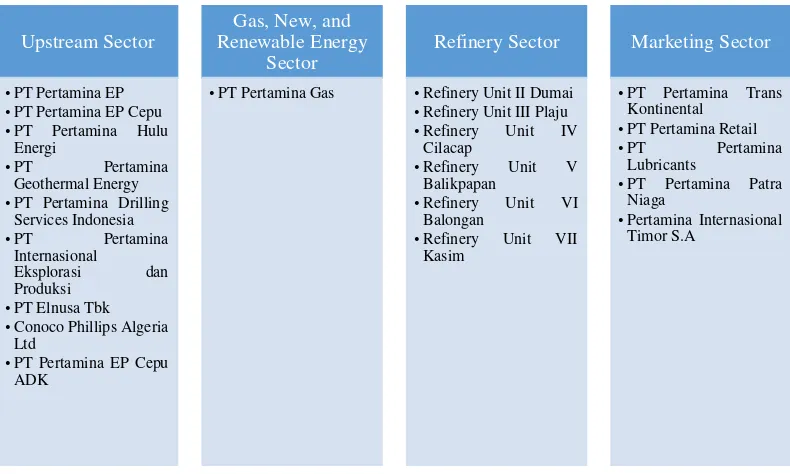
As a limited liability company, NOC main business can be divided into 4 sectors, those are upstream sector; gas, new, and renewable energy sector; refinery sector; and marketing sector. The subsidiary companies of NOC which is involved in those sectors are presented in the figure below.
Figure 4. 1 Subsidiary Companies of NOC Source: Annual Report PT Pertamina (Persero) 2015
Upstream Sector
•PT Pertamina EP
•PT Pertamina EP Cepu
•PT Pertamina Hulu Energi
•PT Pertamina Geothermal Energy
•PT Pertamina Drilling Services Indonesia
•Conoco Phillips Algeria Ltd
•PT Pertamina EP Cepu ADK
Gas, New, and Renewable Energy
Sector •PT Pertamina Gas
Refinery Sector
•Refinery Unit II Dumai
•Refinery Unit III Plaju
•Refinery Unit IV Cilacap
•Refinery Unit V Balikpapan
•Refinery Unit VI Balongan
•Refinery Unit VII Kasim
Marketing Sector
•PT Pertamina Trans Kontinental
•PT Pertamina Retail
•PT Pertamina Lubricants
•PT Pertamina Patra Niaga
[18]
Since the focus in this final project is upstream sector, therefore the data collection will be limited to the activities conducted in upstream sector. Currently, the subsidiary companies of NOC managing oil field across Indonesia and also overseas, conducting upstream oil and gas mining activities such as exploration of new oil reserves onshore and offshore. Not only exploration, the subsidiary companies also do exploitation of oil from the proven reserves. The list of oil field managed by NOC’s subsidiary companies and also the capacity of each field (in million barrels/year unit) is provided in the table below.
Table 4. 1 Oil Field Managed by NOC
Subsidiary Companies Oil field capacity 2015
(MBBLs)
SUBTOTAL 1.324.937
SUBTOTAL 198.199
Pertamina EP Cepu
Cepu Block 120.073
ConocoPhillips Algeria
Algeria 77.230
Pertamina Internasional
Pertamina Iraq 193.150
[19]
Table 4. 1 Oil Field Managed by NOC
Subsidiary Companies Oil field capacity 2015
(MBBLs)
SUBTOTAL 297.404
TOTAL 2.017.843
According to Lubiantara (2012), 80% of Indonesian oil production is generated by International Oil Company (IOC) and the rest 20% is generated by NOC, which is relatively small compared to the participation of NOC in other country such as Algeria (minimum 51%), Venezuela (minimum 50 – 60%), United Arab Emirates (minimum 60%), Malaysia (minimum 60%), and Saudi Arabia (100% production by Saudi Aramco). The portion of Indonesian oil producer is shown in the figure below.
Figure 2. 4 Major Indonesian Oil Producers as of January 2016 Source: PWC Indonesia Oil and Gas Survey, 2016
[20]
could earn more reserves, produce more oil and gas, fulfill the domestic and international demand, generate income, and be the stronger and valuable energy company.
2.4 System Approach
As the object observed in this research, system must be approached with systemic approach. System is the whole interaction of elements in an object bounded in an environment to reach a goal (Muhammadi, 2001). Interaction defined as the connector of elements that differ one object to other object and affecting the behavior of object. Element defined as things (either physical or non-physical) that compose the object of system. Elements are also called as sub-system. Object defined as the system that becomes the focus in a particular boundary so the viewer could differ between system and environment. All the things outside the system boundary are called as environment.
Boundary between the system and environment created the property of system. There are basically 2 types of system, closed system and open system. In open system, the boundary could be affected by the environment and do interaction with the environment. Meanwhile, in closed system the boundary couldn’t be affected by environment and assumed doesn’t do interaction with the environment. The illustration of system can be seen in the figure below.
[21]
To understand systemic thinking, the viewer must see an event as a system (systemic approach). Systemic approach can be done through several steps, those are:
1. Identifying the Transformation Process that produce Actual State 2. Identifying the Desired State
3. Identifying the Gap between Actual and Desire State 4. Identifying the Mechanism that Covers the Gap 5. Policy Analysis
2.5 System Dynamics Methodology
System dynamics has been known as the systemic thinking discipline in system science. This methodology was firstly introduced by Jay Forrester from Massachusetts Institute of Technology (MIT) in 1963 and has been improved continuously. System dynamics was used limitedly as industrial problem-solving tool in its early emergence. In its development, system dynamics has been used for analyzing and solving social, economic, managerial, political, and environmental issues which is complex, dynamic (fast-changing), and uncertain.
[22]
2.5.1 Causal Loop Diagram
A system which has causal loops can’t be analyzed partially and this causes system dynamics better than partial analysis in analyzing system that has causal loops. Causal loop diagram illustrates the causal relationships between elements using inter-related arrows so it creates causal loop where the beginning of arrow means the cause and the end of arrow means the effect. The illustration of causal loop diagram can be seen in the figure below.
Figure 2. 6 Causal Loop Diagram of Adoption Source: Timreview.ca, 2016
As seen in the figure above, adoption rate negatively affects the potential adopters. Higher adoption rate decreases the number of potential adopters. Otherwise, potential adopters positively affect the adoption rate. Higher number of potential adopters increase the adoption rate. This causal relation creates the causal loop between those variables.
There are two types of causal loop, those are positive loop and negative loop. To determine the type of loop, the viewer must see whether the whole interaction producing one-way process or opposite direction. One-way process [(+) * (+)] will result in positive loop, showing accelerating or decelerating behavior. Meanwhile the opposite direction [(-) * (+)] will result in negative loop and show approaching limit behavior.
[23]
conceptual mapping of the system to simplify complexity. Causal loop diagram must be made as real as it could be to illustrate the nature of the studied system.
2.6 Modelling and Simulation
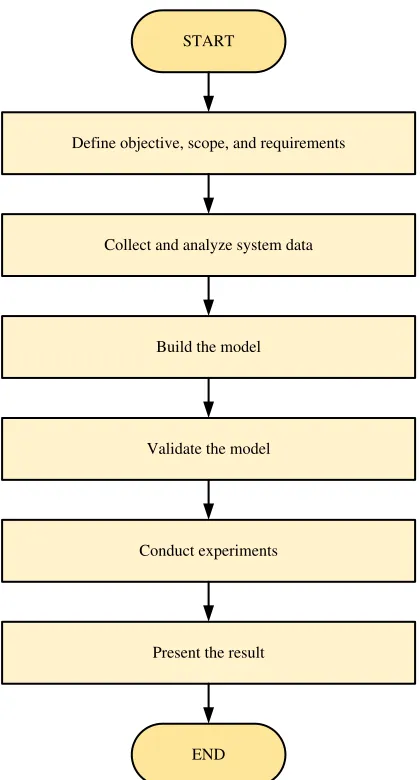
To understand the behavior of system, the viewer could make a model instead of doing trial-and-error research. Model is the representation of system in the real world by emphasizing the main elements of the system. Building a model could be cheaper and time-saving rather than doing trial-and-error study in the real system. Model can be made in conceptual form and simulation form. Conceptual model is a non-software specific description of the simulation model that is to be developed, describing the objectives, inputs, outputs, content, assumptions and simplifications of the model. Meanwhile, simulation model can be made through system dynamics software, such as Vensim, Powersim, and Stella © (iSee System). Stella © (iSee System) could build the simulation model visually using computer and could see the behavior of system quickly.
[24]
START
Define objective, scope, and requirements
Collect and analyze system data
Build the model
Validate the model
Conduct experiments
Present the result
END
Figure 2. 7 Simulation Procedure
Source: Industrial System Simulation Lecture Note, 2016
[25]
Figure 2. 8 Symbols in Stock and Flow Diagram Source: Nwsystems.files.wordpress.com, 2016
Stock and Flow Diagram illustrates the structure of model and the simulation will produce graph that shows the behavior of system.
2.7 Model Verification and Validation Testing
Model verification is the process to determine whether the simulation model correctly reflects the conceptual model. Testing is conducted to verify whether the simulation results absolutely predictable outcomes based on test data. Simulation models often generate slightly different result depending on configuration and input data. Verification is the process of debugging the model, seeking for the bug-free model.
Meanwhile model validation is the process of establishing confidence in the soundness and usefulness of a model (Forrester in Richardson, 2016). Verification and validation must be conducted simultaneously throughout the model development process (Forrester and Senge in Richardson, 2016). Several testing methods are required for validating the simulation model, including the usage of statistical testing techniques. Some of the testing methods by Forrester and Senge (1980) are as follows:
1. Structure Testing
[26]
the process of iteratively making model adjustments suitable to the behavior in real world.
2. Parameter Testing
Parameter testing can be done by comparing model parameters to knowledge of the real system to determine if parameters correspond conceptually and numerically to real life.
3. Boundary Adequacy Testing
Boundary adequacy is conducted by developing a convincing hypothesis relating proposed model structure to a particular issue addressed by the model. This test requires an evaluator to be able to unify criticisms of model boundary with criticisms of model purpose.
4. Sensitivity Testing
Sensitivity testing aims to find which variable most affective to the main purpose of the research. Sensitivity testing is conducted to check whether rational shifts in model parameter can cause a model to fail the previously passed behavior test.
5. Extreme Conditions Testing
The structure of system dynamics model should permit extreme combinations of levels in the system being represented. To conduct extreme conditions testing, the evaluator must examine each rate equation in a model, trace it back through any auxiliary equations to the level on which the rate depends, and consider the implications of imaginary maximum and minimum values of each state variable and combinations of state variables to determine the rational of the resulting rate equation.
2.8 Financial Valuation
[27]
valuation to 3 approaches, those are market approach, asset-based approach, and income approach.
Market approach is conducted based on relative valuation where the value of business interest defined as the market value of similar business interests which is compatible and proportional. There are 3 methods in market approach valuation, those are guideline publicly traded company method, guideline merger and acquisition method and prior transaction, and offers and buy-sell agreement method.
The next approach in valuation is asset-based approach. Asset-based principle’s valuation is based on accounting principle where the value of business interests defined as same as the costs incurred to gather that business interests at the time valuation happened and the equity value defined as same as the net company value of basic adjusted value. There are 2 methods in asset-based approach valuation, those are adjusted net asset method and excess earning method.
Income approach is conducted based on anticipation principle where business interest defined as the sum of economic benefits generated by that business interest in the future. Company value is estimated by quantifying income flow generated by investments and converted to present value by opportunity cost of capital. Income approach is divided into Discounted Cash Flow (DCF) method and Capitalization method. Income approach is used in this research.
2.8.1 Discounted Cash Flow (DCF) Method
Discounted cash flow uses projection of all economic benefits in the future such as free cash flows or other income variable and discounting each benefit to present value with a particular discount rate that reflects the cost of investment capital. DCF method uses time value of money theory. DCF method also based on principles that the value of investment determined by its ability in generating future cash flows, a new investment is valuable if that investment could give bigger return than the costs incurred for that investment, and the value of assets is present value of expected cash flows from that asset investment in the future. To determine the value of company, there are 3 things that needed to do, such as:
1. Future stream of economic income
[28] 3. Continuing value of company
The basic formula used in DCF is shown below PV=∑ Ei
(1+k)i n
i=1 ... (2.1)
where PV = present value
𝐸𝑖 = economic income expected in period-i
k = discount rate
i = period in the future where the economic income will be received Economic benefit meaning can be various depending on the valuation object and purpose of valuation. Generally, economic benefits are dividends, net profit, Earnings Before Interests and Taxes (EBIT), Earnings Before Interests Taxes Depreciation and Amortization (EBITDA), Net Income After Tax (NIAT), and net cash flow to equity. Net cash flow to equity’s formula is shown below.
NCFe = NIAT + NCC − CAPEX − NCWC + NCLTD ... (2.2)
where NIAT = Net Income After Tax
NCC = Non-Cash Charges (Depreciation, Amortization, and Retained Tax)
CAPEX = Capital Expenditures
NCWC = Changes in Net Working Capital NCLTD = Net Changes in Long-Term Debt
Discount rate defined as the return percentage to convert the amount of money that is expected in the future to present value. Discount rate can be in the form of Minimum Attractive Rate of Return (MARR) or Weighted Average Cost of Capital (WACC).
2.8.2 Direct Capitalization Method
[29]
present value. The formula of Present Value in direct capitalization method can be seen below.
PV=𝐸𝑐 ... (2.3)
where E = Expected economic income (constant) c = Capitalization rate
Constant expected economic income happened in perpetuity period where the discount rate and capitalization rate will be in the same amount. There’s no additional CAPEX or working capital in perpetuity period so there’s no growth in perpetuity period. When using this method, capitalization rate can’t be used to discount the prospective cash flows or expected economic income to present value.
2.9 Previous Researches
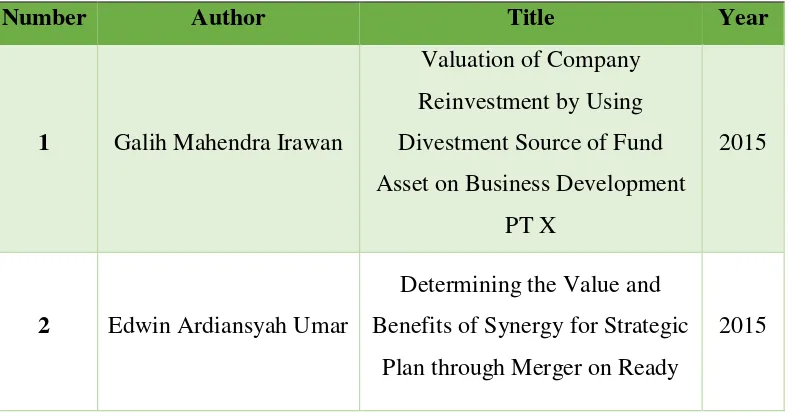
Research related to oil and gas management scheme using system dynamics modelling and financial valuation tools is rarely conducted due to differences of oil and gas management policy in every country. However, the author found similar researches that used system dynamics modelling as tool for different object (not oil and gas). Researches that used financial valuation method are also used as reference. The lists are provided in the table below.
Table 2. 2 Previous Researches
Number Author Title Year
1 Galih Mahendra Irawan
Valuation of Company Reinvestment by Using Divestment Source of Fund Asset on Business Development
PT X
2015
2 Edwin Ardiansyah Umar
Determining the Value and Benefits of Synergy for Strategic
Plan through Merger on Ready
[30] Table 2. 2 Previous Researches
Number Author Title Year
Mix Concrete Industry PT X and PT Y
3 M. Caesario Baruza
System Dynamic Approach for Transportation Sector Development based on Calculation of Investment of Surabaya Mass Rapid Transit
(SMART)
2015
4 Atikah Aghdhi Pratiwi
Selection of Strategy Scenario to Enhance the Competitive Advantage of Surabaya, East Java’s Shipbuilding Industrial
Cluster (KIKAS)
[31]
CHAPTER 3
RESEARCH METHODOLOGY
This chapter contains the methodology that is used in conducting the research in form of flowchart and also the explanation of methodology flowchart.
3.1 Flowchart of Research Methodology
START
Literature Study:
1. Oil and Gas Management 2. System Dynamics 3. System Approach 4. Financial Valuation
Early Data Collection:
1. Company Profile 2. Indonesian Oil Demand,
Production, and Reserves
Problem Formulation
Purpose: Determining final project topic, variables, time horizon, and historical reference
Dynamic Hypothesis
Purpose: Mapping the problem and related stakeholders using Causal Loop Diagram and Determining alternative scenario for oil and gas
management in Indonesia
Model Formulation
Purpose: Creating simulation model in Stock and Flow Diagram using STELLA
Model Testing
Purpose: Verification and Validation of Simulation Result by Comparing with Existing System
Valid?
Yes No
Introduction Phase
Data Collection and Processing Phase
[32]
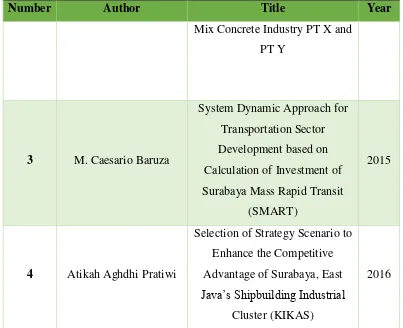
END
Scenario Development and Financial Valuation
Purpose: Getting the simulation result and assessing financial valuation of each scenario
Output Analysis and Interpretation
Conclusion and Recommendation
System Modelling Phase
Data Analysis and Interpretation Phase
Conclusion and Recommendation
Phase A
Figure 3. 1 Flowchart of Research Methodology Source: Author’s Documentation
3.2 Introduction Phase
Introduction phase becomes the early stage in this research. Introduction phase consists of literature study, early data collection, and problem formulation. The explanations of introduction phase are as follows.
3.2.1 Literature Study
Literature study is the early phase of this research. Literature study is conducted through finding trusted and credible resources such as books, journals, lecture materials, and etc. to find theoretical framework about oil and gas management in Indonesia, system dynamics methodology for problem solving, and financial valuation theories and methods. The theoretical framework is used to support the research with valid theories.
3.2.2 Early Data Collection
[33]
are collected from NOC and other supportive resources such as books, journals, and internet.
3.2.3 Problem Formulation
After gathering data, the problem must be formulated to figure out what is actually wrong with the system that needs to be fixed through research. The final project topic must be determined in this phase, as well as the variables related in the system, the time horizon for study, and historical reference for the problem.
3.3 Data Collection and Processing Phase
After the introduction phase, the research continues to data collection and processing phase. In this phase, dynamic hypothesis is conducted to conceptually modelling the system using Causal Loop Diagram. The explanation of this phase is shown below.
3.3.1 Dynamic Hypothesis
After formulating the problem, the existing system of upstream oil management in Indonesia must be modelled using Causal Loop Diagram to map the problem and understanding the relation between stakeholders. Furthermore, the alternative scenarios for upstream oil management in Indonesia must be determined as comparison for the system improvement.
3.4 System Modelling Phase
Following the data collection and processing phase is system modelling phase using System Dynamics software such as Stella © (iSee System). The explanation of this phase are as follows.
3.4.1 Model Formulation
[34]
Diagram furthermore needs to be simulated to gain the result. The result furthermore will be collected and tested.
3.4.2 Model Testing
Simulation model must be credible in order to represent the real system correctly. Every model used in simulation must be verified and validated to test the credibility of the model. Verification is the process to check whether the operational logic of the model compatible with the logic in flow diagram. Verification can be done by the software. Meanwhile validation is the process to determine whether the model is the accurate representation of the real world. Validation is done through 5 methods, those are model structure testing, boundary sufficiency testing, model parameter testing, mean comparison testing, and extreme condition testing.
3.4.3 Scenario Development and Financial Valuation
After verifying and validating the simulation model, as the improvement of the system, the scenario must be developed. There will be only 1 scenario as the comparison of the current system, which is concession scheme for upstream oil management. The new scenario will also be simulated. After getting the results, both scenario will be analyzed and valuated to find which scenario that will be more valuable for NOC (which represents the government’s interest).
3.5 Data Analysis and Interpretation Phase
The output of system simulation is furthermore analyzed and interpreted in this phase as explained in the paragraph below.
3.5.1 Output Analysis and Interpretation
[35]
scenario will be determined as the new scheme for upstream oil management in Indonesia.
3.6 Conclusion and Recommendation Phase
The final phase of this research is conclusion and recommendation phase which is explained in the paragraph below.
3.6.1 Conclusion and Recommendation
[36]
[37]
CHAPTER 4
SIMULATION MODEL DESIGN
This chapter contains the steps needed in conducting system dynamics simulation modelling. Before conducting the simulation, the current system which is needed in the simulation must be identified. The current system then will be the input in formulating dynamic hypothesis which consists of variable identification, conceptual model, and the simulation model. Furthermore, verification and validation will be conducted to the simulation and the simulation result will be provided as the closing of this chapter.
4.1 Current System Identification
This subchapter will explain about the current upstream oil management system in Indonesia, including the upstream oil mining activity, oil consumption pattern, oil market, investment made for upstream oil mining, and the revenue gathered from upstream oil mining.
4.1.1 Upstream Oil Mining Activity (Production)
[38]
there will be “dry hole”. After exploration is done, if it’s successful, there will be potential oil wells with random amount, depends on the condition of the reserves. In the current upstream oil management scheme, exploration can be done either by the company who undertakes the project or other company that has been selected.
Potential oil wells still can’t produce crude oil. It must be developed through “exploitation” to technically prove the existence of oil or gas. After the exploitation process, the oil wells turn into proven oil wells that are ready to be drilled and crude oil can be lifted from the earth’s surface.
Oil production depends on several parameters, including the age of the oil wells, primary recovery factor, and after-production effect. New proven oil wells will produce more oil until its peak amount and after it reached 12% of total amount, the production will decline. As the wells are aging, the production amount will also decline. Oil wells can’t be drained until there’s no oil left. Until the left amount of oil reached 26% of the total amount, the oil can’t be lifted anymore so there will be no more oil production. The company needs to look for new reserves through exploration if it wants to keep producing oil.
4.1.2 Oil Market
[39]
4.1.3 Crude Oil Consumption
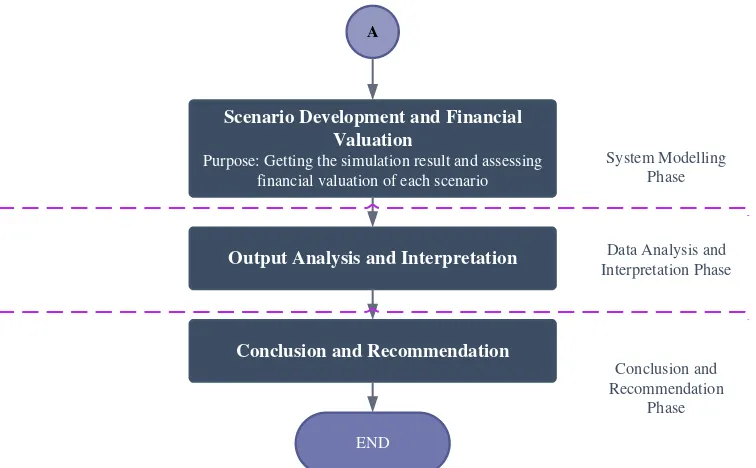
Indonesia currently becomes the 4th largest population country in the world. Following the amount of population which is around 250 million people, Indonesian energy consumption is also high (as previously showed in chapter 2). The energy consumer is classified into 4 categories which is household, industry, vehicles, and others. The historical data of each category (shown in unit) and also the year-to-year growth is provided in the table below.
Table 4. 2 Number of Household
Year Population
Household
[40]
Figure 4. 2 Oil Consumption of Each Category (2005 – 2015) Source: Handbook of Energy & Economic Statistics of Indonesia 2015
Figure 4. 3 Oil Consumption Percentage of Each Category (2005 – 2015) Source: Author’s Documentation
Oil Consumption of Each Category (2005 - 2015)
Household
[41]
Figure 4. 4 Cumulative Oil Consumption Percentage of Each Category (2005 – 2015)
Source: Author’s Documentation
From the figures above, it can be concluded that transportation mostly consumes oil than the other categories. Transportation, which consists of vehicles such as cars, trucks, motorcycles, airplanes, ships, dominated the oil consumption due to the fuel usage (Bahan Bakar Motor/BBM). The oil consumption by transportation is also rising from 2005 – 2015, meanwhile the other category consumption is falling. The oil consumption per capita is shown in the table below.
Table 4. 3 Oil Consumption per Capita (barrel)
Year Household Industry Transportation
2005 1,047 3098,99 4,741
[42]
Table 4. 3 Oil Consumption per Capita (barrel)
Year Household Industry Transportation
2016 0,056 1580,80 2,269
4.1.4 Investment in Upstream Oil Mining
Upstream oil mining activity requires high investments for both capital expenditure and operational expenditure in order to be able to do the whole activity and oil production. The activity in upstream oil investment is triggered by suitable production volume of oil which is defined by NOC and the ability of investing to find new potential resource of oil. Available fund furthermore determined the ability to invest. The amount of investment activity is provided in the table below.
Table 4. 4 Amount of Investment in Upstream Oil Mining
Year
Suitable Production Volume Investment for Each Barrel of Oil
[43]
Table 4. 4 Amount of Investment in Upstream Oil Mining
Year
Suitable Production Volume Investment for Each Barrel of Oil
Domestic (MMBOE)
Overseas (MMBOE)
Offshore (USD/barrel)
Onshore (USD/barrel)
2017 214,09 214,09 266,20 266,20
2018 214,09 214,09 266,20 266,20
2019 214,09 214,09 266,20 266,20
2020 214,09 214,09 266,20 266,20
2021 348,34 348,34 266,20 266,20
2022 348,34 348,34 266,20 266,20
2023 348,34 348,34 266,20 266,20
2024 348,34 348,34 266,20 266,20
2025 370,11 370,11 266,20 266,20
The suitable production volume for both domestic and overseas are assumed to be same as well as the investment data.
4.1.5 Revenue Stream of Upstream Oil Mining
[44]
Gross Income
First Tranche Petroleum
Recoverable Costs Oil
Production Costs
Start
Equity to be Split
Contractor Share Governmentr Share
Crude Oil Production
Crude Oil Price
Domestic Maret Obligation Fee
Tax Paid
Government Take Contractor Take
Retained Earning
End Value
(-) (+)
(+)
(-)
[45]
The amount of retained earnings will contribute to both investment activity and capital structure strengthening.
4.2 Dynamic Hypothesis
To understand the dynamics of the system, the historical data that related to the system are collected. This final project set time horizon for 20 years, which consists of 10 years historical data (since 2005 – 2015) and 10 years future projection (started from 2015 – 2025). The data then led to theory development, called dynamic hypothesis, to account for the problematic behavior of the system. Dynamic hypothesis consists of variable identification of the system and conceptual modelling using Causal-Loop Diagram to show the intercorrelation of the system elements.
4.2.1 Variable Identification
Before creating the conceptual model of the system, all variables that are related to oil management system must be identified to understand the function and relation of each variable in affecting the work of the system. Oil management system, in this case, will be divided into 5 submodels to understand the role of the variables in the system. The submodels are Production, Consumption, Oil Market, Investments, and Income. List of all the variables used in the submodel Production is provided in the table below.
Table 4. 5 Variables in Submodel Production
No Entity Description Unit Variable
1
Randomized oil field average capacity
The average capacity
of newly found oil field barrels Converter
2
Randomized oil field standard deviation
Standard deviation of
[46] Table 4. 5 Variables in Submodel Production
No Entity Description Unit Variable
3 Randomized oil
field capacity
Normal distribution of oil field capacity, consists of mean and standard deviation of oil field capacity
barrels Converter
4 Exploration Rate of oil field
exploration activity barrels/year Flow
5 Potential oil
found
Number of potential oil
reserves found on land barrels Stock
6 Randomized oil
wells age average
The average age of oil
wells years Converter
7
Randomized oil wells age
standard deviation
Standard deviation of
oil wells age years Converter
8 Randomized oil
wells age
Normal distribution of oil wells age, consists of average and standard deviation of oil wells age
years Converter
9 Produced capacity Ability of producing oil barrels Converter
(ghost)
10 Exploitation Rate of exploitation
activity barrels/year Flow
11 Proven oil found
Number of proven oil field ready to be produced
barrels Stock
12 Average end life
of all oil wells
Stock of average end life of all oil wells in Indonesia