1
The property sector in Indonesia has experienced attractive growth and some companies in the sector enjoy a significant increase in their revenue and net income. However, other property and real estate companies cannot make use of the growth in the sector and even experienced losses. Companies efficiencies in managing their assets to generate profits will determine their performance. This paper aims to evaluate perfomance of property and real estate companies listed in Indonesia Stock Exchange using the Data Envelopment Analysis (DEA) method. There are 23 property and real estate companies listed on Indonesian Stock Exchange used as sample in this research with the period of study from 2009 to 2012. DEA method is employed and results show that some companies are relatively efficient compared to other companies in each year. However, only one company consistently had technical efficiency equal to 1 during the period of study. The main cause of inefficiency from the period of 2009-2011 is more on scale inefficiency while inefficiency happened in 2012 is pure technical inefficiency. Overall the property and real estate companies operate efficiently under constant returns to scale is showing an increase from 17.39% to 39.13%.
Keywords: company performance, technical efficiency, property and real estate, DEA
ABSTRAK
2
Kata kunci: kinerja perusahaan, technical efficiency, properti dan real estat, DEA
INTRODUCTION
The property market in Indonesia has experienced attractive growth in the past few years. Compared to other sector indexes in the Indonesian stock market, the property stock index has benefit from higher growth during 2012. The Indonesia property sector index grew profoundly, exceeding the growth in the Indonesia stock market index which is known as Indeks Harga Saham Gabungan (IHSG). On 12 October 2012, IHSG reached 4,331 which shows increase of 489.4 points or increased 12.8% compared to 2011 while on the same date, property stock index increased 34.37% (“Saham Properti Incaran Investor”, 2012).
3
Although many publicly listed companies in the property and real estate sector encountered significant growth in revenue and net income, not all companies in that sector enjoyed the same experience. For example, during 2012, PT Bakrieland Development Tbk experienced a loss of Rp1.269 trillion (PT Bakrieland Tbk, 2012). It shows that growth in the property sectors are not automatically shared by all companies in that sector. How well companies managed their assets to maximize profit will determine their performance. Investors need to allocate the money in the companies that perform well to ensure they receive added value from their investments. Therefore, evaluating companies’ performance is essential for investors.
4
dimensions of company activity, evaluated by several key performance indicators (KPIs), into a single summary measure of performance”. Therefore, this research employs DEA method to analyze firm performance.
To the best knowledge of authors, there is no research previously has ever measured the performance of property companies listed on the Indonesian Stock Exchange using DEA method. Hence, this research can potentially contribute to the literature and provide valuable information on the technical efficiency of property companies listed in Indonesia Stock Exchange in particular and property sector in Indonesia in general.
The remainder of this research paper is organized as follows. Section 2 provides brief literature review. Section 3 describes the research methods employed in this research. Section 4 presents the results and provides discussions of the results. The final section concludes.
LITERATURE REVIEW
Data Envelopment Analysis (DEA) is commonly used as a measure to examine the performance of the organizations in various of industry such as banks (Pasiouras, 2007; Saad and Moussawi, 2009; Suzuki and Sastrosuwito, 2011; Soetanto and Ricky, 2011), shipping industry (Lin et al., 2005), investment companies (Zohdi et.al, 2012; Zhao et al., 2011), and hospitality and tourism (Chen, 2009; Sigala, 2004).
5
number of employees while the output variables were annual total sales and on operating income. It was found that score of technical efficiency ranged from 0.61-1.00 and only 6 out of 26 semiconductor companies listed on Taiwan Stock Exchange were relative efficient.
Memon and Tahir (2012) measured and evaluated the relative efficiency of 49 manufacturing companies in Pakistan from 2008-2010 using DEA and categorized them based on the DEA efficiency and profitability index (ROA) to form the performance matrix. It employed both Charnes, Cooper, Rhodes (CCR) and Banker, Charnes, Cooper (BCC) models of DEA to find the overall technical efficiency (OTE), pure technical efficiency (PTE) and scale efficiency (SE) and found that eight companies were considered technically efficient while the source of inefficiency is pure technical efficiency rather than scale inefficiency. Through the performance matrix, there were 13 out of 49 companies in the super-start quadrant characterized by high efficiency and high profitability. Further, there were 20 companies in the problem-child quadrant characterized by low efficiency and low profitability.
6
0.84, and 0.92 respectively and about 69% of the inefficient companies were categorized as having increasing returns to scale.
Nanka-Bruce (2006) investigated the technical efficiency in the real estate sector of Spain for the period 1998-2003 and related the findings to the ownership structure of the firms using DEA. There were 530 firms being analyzed and the variables being used for inputs were fixed assets, material costs, employee costs and other costs while the output variable was operating turnover. The analysis was adopting input-oriented radial DEA under variable returns to scale (VRS) technology to measure technical efficiency. It was revealed that firms were only 69% efficient in their productive efficiency and experienced a downward trend in technical efficiency from 1998 to 2002 attributable to the increasing demand for new property. The most inefficient firms were state-owned compared with industrial companies as the ultimate owners.
To date, there has been relatively limited research conducted in evaluating the efficiency of property and real estate industry listed publicly in Indonesia. Most of the research being conducted to analyze the performance of the companies has been based on financial ratios and price of the stock as in Saskia (2013) dan Amalia (2012). Other research by Septyo (2013) was evaluating the performance of property and real estate companies listed on the Indonesia Stock Exchange from 2009-2011 using Public-Value Added Intellectual Coefficients (VAIC) while Nugroho (2012) used Economic Value Added to measure the financial performance in property industry from 2004-2010.
7
RESEARCH METHOD
The nonparametric method of Data Envelopment Analysis (DEA), initially introduced by Charnes et al. (1978), to evaluate the efficiency of decision-making units (DMU) particularly in terms of efficiency. The DEA model forms a relative efficiency score by converting the multiple-input/multiple-output variables to a single measure of performance for each DMU (Horta et al., 2010). This happens by establishing an empirically based “best-practice” or efficient frontier as a result of classifying a set of
efficient DMUs which lies on the frontier and inefficient DMUs which do not lie on the frontier (Wagner and Shimshak, 2007).
There are several of advantages of DEA compared to other methods such as Stochastic Frontier Analysis (SFA), Thick Frontier Approach, Distribution Free Approach (DFA) and etc. It does not have any assumption of frontier functional form, considers various inputs and outputs simultaneously, no prior specific behavioural assumptions of relationship needed and able to have different measurement units between inputs and outputs (Cooper et al, 2004, Charnes et al., 1978). Another advantages of DEA is no assumption related to the distribution of efficiencies and no prior information related to prices (Mohammadi & Ranaei, 2011).
8
the j = 1,2,…,n DMU. This basic DEA model implies the assumption of Constant Returns to Scale (CRS). Using Charnes-Cooper transformation and dual formulation under CRS, then:
θ* = Minimum θ
Subject to (1)
λj ≥0
The optimal solution, θ*, yields an efficiency score for a certain DMU. The process is repeated for each DMUj. DMUs for which θ* < 1 are inefficient, while DMUs for which θ*=1 are boundary points or efficient. This model is sometimes referred to as the “Farrell model” (Cooper et al., 2004). In the CRS version, it is
assumed that an increase in the amount of inputs would directly be proportional to an increase in the amount of outputs. During the process, however, there may be increasing or decreasing returns to scale, particularly for an inefficient DMU, which may occur from the different returns to scale of the operation (Boussofiane et al., 1991).
9
Due to imperfect competition or constraints in finance, not all companies are able to operate at the optimal scale. In that condition, Banker et al. (1984) suggested the use of Variable Return to Scale (VRS), denoted as BCC hereafter, that allows the calculation of efficiency leads to decomposition of technical efficiency into scale (SE) and pure technical efficiency (PTE) components. The BCC model is (1) together with additional constraint that captures returns to scale characteristics
Then, the efficiency estimates obtained in the BCC model is net of the contribution of scale economies and therefore is referred to as ‘pure’ technical efficiency and also as the
managerial efficiency. In the VRS version, the amount of outputs is considered to increase more or less than proportionally than the increase in the inputs.
10
Both CCR and BCC models will result of efficiency scores between 0.0 and 1.0. It implies that DMUs are either on the efficiency frontier or below it. A company is efficient if it has an efficiency score of 1.0 or can be said that it lies on the efficient frontier, and otherwise if it has an efficiency score below 1.0.
Data and Variables
The data used in the analysis were collected from Annual Reports of company websites and the Indonesian Stock Exchange database. This research used property and real estate companies listed on the Indonesian Stock Exchange from the period of 2009-2012. Companies which experienced delisting during the period and those that lack data on selected variables for at least one year are eliminated, leading to 23 companies for further analysis.
A crucial phase in DEA measurement is classification of the input/output variables related to the units being measured (Boussofiane et al., 1991). DEA calculates efficiency directly from the input/output data, then the results will depend on the input/output adoption for analysis and the homogeneity of the DMUs to be assessed (Boussofiane et al., 1991). As stated by Sigala (2004), one primary drawback of DEA model is the difficulty in defining and classifying the measurement of inputs/outputs.
11
Memon and Tahir, 2012; Yu and Han, 2012). However, since net income is subject to revenue, there is potential of endogeneity bias in DEA as pointed out by Orme and Smith (1996). Moreover, in the presence of relatively small number of DMUs, having more output than are necessary will lead to loss of discriminatory power of DEA which result in higher overall efficiency score (Hughes and Yaisawarng, 2004). Therefore, this research only use one output which is net income.
According to Chen (2009), some guidelines have been proposed by previous research to limit the number of variables relative to the number of DMUs to achieve a rational level of discernments. Dyson et al. (2001), as cited by Chen (2009), stated that the number of DMUs should be at least two times of the number of inputs and outputs (i.e. n ≥ 2ms). This research use 3 input variables (m=3) and 2 output variables (s=2)
hence the number of DMUs should be more than 12 (2x3x2). The guideline is fulfilled since there are 23 property and real estate companies being analyzed in this research.
RESULTS AND ANALYSIS
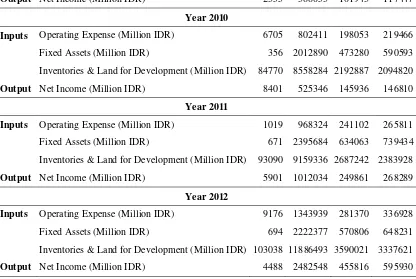
Table 1 below shows descriptive statistics for inputs and outputs variable of 23 publicly listed property and real estate companies for 4 year-period (2009-2012). The values are given in million Rupiah.
Table 1 Descriptive Statistics for the Data
Factors Min Max Mean Std. Dev.
Year 2009
Inputs Operating Expense (Million IDR) 4096 705861 171239 189219 Fixed Assets (Million IDR) 729 1559360 432230 534168
12
Output Net Income (Million IDR) 2355 388053 101943 117447
Year 2010
Inputs Operating Expense (Million IDR) 6705 802411 198053 219466 Fixed Assets (Million IDR) 356 2012890 473280 590593
Inventories & Land for Development (Million IDR) 84770 8558284 2192887 2094820
Output Net Income (Million IDR) 8401 525346 145936 146810
Year 2011
Inputs Operating Expense (Million IDR) 1019 968324 241102 265811
Fixed Assets (Million IDR) 671 2395684 634063 739434 Inventories & Land for Development (Million IDR) 93090 9159336 2687242 2383928
Output Net Income (Million IDR) 5901 1012034 249861 268289
Year 2012
Inputs Operating Expense (Million IDR) 9176 1343939 281370 336928
Fixed Assets (Million IDR) 694 2222377 570806 648231
Inventories & Land for Development (Million IDR) 103038 11886493 3590021 3337621
Output Net Income (Million IDR) 4488 2482548 455816 595930
Table 1 displays that for input variables, the highest operating expenses and inventories & land for development happened in 2012 while the highest fixed assets is in 2011. During 2009 to 2012, the highest operating expenses amount is Rp1,343,939 million or Rp1.34 trillion spent by PT Lippo Karawaci Tbk in 2012 while the highest inventories and land for development value is Rp11.886 trillion, owned by PT Lippo Karawaci Tbk. PT Ciputra Development Tbk has highest fixed asset during the period of investigation. For output variable, mean of the net income is increasing from 2009 to 2012. Highest reported net income is Rp2,482,548 million or Rp2.48 trillion is earned by PT Lippo Karawaci Tbk in 2012.
13
(TE). The technical efficiency of 23 publicly listed property and real estate companies per year during 2009-2012 are shown in Table 2 below.
Table 2. Technical Efficiency of 23 Publicly Listed Property & Real Estate Companies
DMU No. DMU Name Technical Efficiency
Year 2009 Year 2010 Year 2011 Year 2012
1 Alam Sutra Realty 1.00000 1.00000 1.00000 1.00000
2 Bekasi Asri Pemula 1.00000 1.00000 0.79529 0.61387
3 Bumi Serpong Damai 0.51946 0.54463 0.78449 0.77190
4 Ciputra Development 0.37591 0.57658 0.58347 0.68147
5 Ciputra Property 0.38848 1.00000 0.65921 0.46615
6 Ciputra Surya 0.35201 1.00000 0.59496 0.70940
7 Cowell Development 1.00000 0.97509 1.00000 1.00000
8 Danayasa Arthatama 0.85226 0.54369 0.37935 1.00000
9 Duta Anggada Realty 0.65491 0.76883 0.30309 0.92657
10 Gowa Makassar Tourism 0.65890 0.65420 1.00000 1.00000
11 Indonesia Prima Property 0.49609 1.00000 1.00000 0.94474
12 Intiland Development 0.42025 0.95843 0.48723 0.54987
13 Jakarta Inter Hotel 0.80389 0.60827 0.42524 0.46213
14 Jaya Real Property 1.00000 0.91717 1.00000 1.00000
15 Kawasan Jababeka 0.28737 0.51809 0.63351 0.64749
16 Lamicitra Nusantara 0.39968 0.47501 0.20067 0.19089
17 Lippo Cikarang 0.72974 0.68758 1.00000 1.00000
18 Lippo Karawaci 0.46460 0.52744 0.70364 1.00000
19 Modernland 0.45000 0.49516 0.40790 0.48010
20 Pakuwon Jati 0.75137 1.00000 0.90173 1.00000
21 Perdana Gapuraprima 0.42855 0.46624 0.61504 0.63498
22 Sentul City 0.33248 0.68826 0.47757 0.59962
23 Summarecon Agung 0.51564 0.64319 0.70468 1.00000
From Table 2 above, it can be seen that each year from 2009 until 2012, some
14
However, companies having technical efficiency equal to 1.0 are not the same each year. In 2009, there are four companies that have technical efficiency equal 1.0 which are PT Alam Sutera Realty Tbk, PT Bekasi Asri Pemula Tbk, PT Cowell Development Tbk, and PT Jaya Real Property Tbk. In 2010, there are six companies which have technical efficiency equal 1.0. They are PT Alam Sutera Realty Tbk, PT Bekasi Asri Pemula Tbk, PT Ciputra Property Tbk, PT Ciputra Surya Tbk, PT Indonesia Prima Property Tbk, and PT Pakuwon Jati Tbk. In 2011, there are six companies having technical efficiency equal 1.0 which are PT Alam Sutera Realty Tbk, PT Cowell Development Tbk, PT Gowa Makassar Tourism Development Tbk, PT Indonesia Prima Property Tbk, PT Jaya Real Property Tbk, and PT Lippo Cikarang Tbk. In 2012, nine companies are having technical efficiency equal 1.0. Those companies are PT Alam Sutera Realty Tbk, PT Cowell Development Tbk, PT Danayasa Arthatama Tbk, PT Gowa Makassar Tourism Development Tbk, PT Jaya Real Property Tbk, PT Lippo Cikarang Tbk, PT Lippo Karawaci Tbk, PT Pakuwon Jati Tbk, and PT Summarecon Agung Tbk. From the table, it also can be seen that there is only one publicly listed company that consistently had technical efficiency equal to 1.0 during 2009 to 2012, which is PT Alam Sutera Realty Tbk.
15
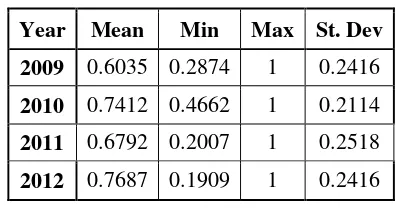
Table 3. DEA Result: Technical Efficiency (TE)
Year Mean Min Max St. Dev
2009 0.6035 0.2874 1 0.2416
2010 0.7412 0.4662 1 0.2114
2011 0.6792 0.2007 1 0.2518
2012 0.7687 0.1909 1 0.2416
Table 4. DEA Result: Pure Technical Efficiency (PTE) and Scale Efficiency (SE)
Year Pure Technical Efficiency (PTE) Scale Efficiency (SE)
Mean Min Max St. Dev Mean Min Max St. Dev
2009 0.8038 0.3931 1 0.2194 0.7478 0.4323 1 0.1798
2010 0.9296 0.4826 1 0.1459 0.8002 0.4662 1 0.1847
2011 0.7925 0.3195 1 0.2301 0.6792 0.2007 1 0.2518
2012 0.8410 0.4714 1 0.1969 0.9178 0.2088 1 0.1829
According to the CCR-DEA model, the average technical efficiency of property and real estate companies in Indonesia as shown in Table 3 is experiencing fluctuation starting from 60.35% to 74.12% from 2009 to 2010 and in 2011 is declining to 67.92% before it is improving to 76.87% in 2012. It indicates that the companies could further reduce their factor of production by 39.65% in 2009 to 23.13% in 2012 by maintaining the same output level. Table 3 also shows that the minimum technical efficiency keeps decreasing from year to year, except from 2009 to 2010. However in every period of analysis, there are some companies that can achieve technical efficiency as shown by the maximum score equal to 1.0.
Table 4 exhibits the decomposition of technical efficiency into pure technical
efficiency and scale efficiency from the year 2009-2011. From Table 4, it can be seen
that the average score of pure technical efficiency outweighs the average score of scale
16
results imply that during these years, the companies in property and real estate sector
has been more efficient in controlling their operating costs rather than operating at an
optimal scale of operations.
On the other hand, pure technical inefficiency seem to dominate during 2012
compared to scale inefficiency, suggesting that property and real estate sector has been
relatively less managerially efficient in controlling their costs and operating at an
optimal scale of operations. As in 2012, there is increasing demand of residential
houses and apartments as people were more positive about the Indonesian economic
circumstances and mortgage loans were more affordable, which was 10.62% in average
based on data of Bank Indonesia (Property and Bank, 2012) compared to the previous
years which was 14% (Finesso, 2009). Moreover, it is supported by the fact that the
amount of mortgage loan in February 2012 was increasing 33% compared to February
2011 (Property and Bank, 2012).
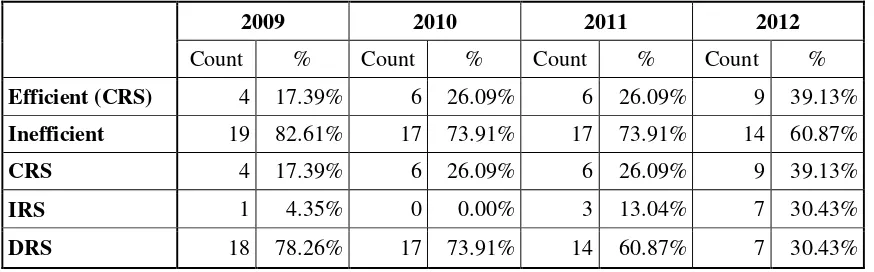
Table 5. Summary of Overall Efficiency and Return to Scale
2009 2010 2011 2012
Count % Count % Count % Count %
Efficient (CRS) 4 17.39% 6 26.09% 6 26.09% 9 39.13%
Inefficient 19 82.61% 17 73.91% 17 73.91% 14 60.87%
CRS 4 17.39% 6 26.09% 6 26.09% 9 39.13%
IRS 1 4.35% 0 0.00% 3 13.04% 7 30.43%
DRS 18 78.26% 17 73.91% 14 60.87% 7 30.43%
17
while the companies that are not efficient are mostly having decreasing returns to scale. The percentage of companies who experience the decreasing returns to scale is 78.26% in 2009 and decline to 30.43% in 2012.
CONCLUSION
The positive and attractive performance of property companies has driven the Indonesian property sector’s growth significantly as can be seen by the increasing
revenues of some property and real estate companies listed in Indonesian Stock Exchange. However not all companies enjoyed the same condition and evaluating the performance of companies is necessary to know their sustainability. Besides it is helping investors to seek the right choice in doing investment.
18
companies are not controlling their costs efficiently and are operating at optimal scale of operation as the increasing demand of residential houses and apartments in 2012. Overall the percentage of companies operating under constant returns to scale is increasing from 17.39% to 39.13% during 2009-2012.
REFERENCES
Alam Sutera. (2012). PT. Alam Sutera Realty Tbk and Subsidiaries Consolidated Financial Statements. Retrieved April 8, 2013 from http://www.idx.co.id
Amalia, T. (2012). Pengaruh Kinerja Keuangan Terhadap Harga Saham (Studi pada Perusahaan Properti dan Real Estate yang Terdaftar di Bursa Efek Indonesia Periode 2006-2010). Unpublished Thesis (S.E), Fakultas Ekonomi, Universitas Gunadarma. Bakrieland. (2012). PT. Bakrieland Development Tbk and Subsidiaries Financial Report. Retrieved April 8, 2013 from http://www.idx.co.id
Banker R.D., Charnes A., and Cooper W.W. (1984). Some Models for Estimating Technical and Scale Inefficiencies in Data Envelopment Analysis. Management Science, 30, pp. 1078-1092.
Boussofiane, A., Dyson, G. and Thanassoulis, E. (1991). Applied Data Envelopment Analysis. European Journal of Operational Research, 52, pp. 1-15.
Charnes, A., Cooper, W. W., and Rhodes, E. (1978). Measuring the efficiency of decision making units. European Journal of Operational Research, 2, pp. 429-444. Chen, T. H. (2009). Performance Measurement of an Enterprise and Business Units with an Application to a Taiwanese Hotel Chain. International Journal of Hospitality Management, 28, pp. 415–422.
Ciputra Property. (2012). PT. Ciputra Property Tbk and Subsidiaries Consolidated Financial Statements. Retrieved April 8, 2013 from http://www.idx.co.id
Cooper, W.W., Seiford, L.M. and Zhu, J. (2004). Data envelopment analysis: History, Models and Interpretations, in Handbook on Data Envelopment Analysis, eds W.W. Cooper, L.M. Seiford and J. Zhu, Chapter 1, 1-39, Kluwer Academic Publishers, Boston.
Feroz, E.H., Kim, S. and Raab, R.L. (2003), Financial statement analysis: A data envelopment analysis approach. Journal of the Operational Research Society, 54(1), pp. 48-58.
19
Gumus, Y. and Celikkol, H. (2011). Data Envelopment Analysis: An Augmented Method for the Analysis of Firm Performance. International Research Journal of Finance and Economics, 79, pp. 137-142.
Horta, I.M., Camanho, A.S. and Da Costa, J.M. (2010). Performance Assessment of Construction Companies Integrating Key Performance Indicators and Data Envelopment Analysis. Journal of Construction Engineering and Management, pp. 581-594.
Hughes, A. and Yaisawarng, S. (2004). Sensitivity and Dimensionality Tests of DEA Efficiency Scores. European Journal of Operational Research, 154, pp. 410-422.
Lin, W.C., Liu, C. F., and Chu, C. W. (2005). Performance Efficiency Evaluation of the Taiwan's Shipping Industry: An Application of Data Envelopment Analysis. Eastern Asia Society for Transportation Studies, 5, pp. 467-476.
Lippo Karawaci. (2012). PT. Lippo Karawaci Tbk dan Entitas Anak Laporan Keuangan Konsolidasi. Retrieved April 8, 2013 from http://www.idx.co.id
Martic, M.M, Novakovic, M.S. and Baggia, A. (2009). Data Envelopment Analysis-Basic Models and Their Utilization. Organizacija, 42 (2), pp. 37-43.
Mohammad, A. and Ranaei, H. (2011). The Application of DEA based Malmquist Productivity Index in Organizational Performance Analysis. International Journal of Finance and Economics, 62, pp. 67-76.
Nanka-Bruce, D. (2006). Corporate Ownership and Technical Efficiency Analysis in The Spanish Real Estate Sector. Corporate Ownership & Control, 4, pp. 100-113. Nugroho, B.W. (2012). Analisis Kinerja Keuangan dengan Menggunakan Metode Economic Value Added pada Industri Properti. Unpublished Thesis (M.M), Fakultas Ekonomika dan Bisnis, Universitas Gajah Mada.
Orme, C. and Smith, P. (1996). The Potential for Endogeneity Bias in Data Envelopment Analysis. Journal of the Operational Research Society, 47, pp. 73-83. Pakuwon Jati. (2012). PT. Pakuwon Jati Tbk and Subsidiaries Consolidated Financial Statements. Retrieved April 8, 2013 from http://www.idx.co.id
Pasiouras, F., Sifodaskalakis, E., and Zopounidis, C. (2007). Estimating and Analysing The Cost Efficiency of Greek Cooperative Banks : An Application of Two Stage Data Envelopment Analysis. University of Bath School of Management Working Paper Series No. 2007.12.
Property and Bank, (2012). Saatnya Belanja Mumpung Bunga Murah. 9th May. retrieved from: http://propertynbank.com.
20
Saham Properti Incaran Investor. (2012, November 1). Jawa Pos, pp. 7.
Saskia, F.R. (2013). Analisis Pengaruh Kinerja Perusahaan dan Kinerja Pasar Terhadap Harga Saham pada Perusahaan Real Estate dan Property yang Terdaftar di Bursa Efek Indonesia. Unpublished Thesis (S.E), University of Sumatra Utara.
Septyo, L.B. (2013). Modal Intelektual dan Kinerja Perusahaan (Bukti Empiris di Indonesia). Jurnal Ilmiah Universitas Bakrie, 1(2).
Sigala, M. (2004). Using data envelopment analysis for measuring and benchmarking productivity in the hotel sector. Journal of Travel and Tourism Marketing, 16 (2/3), pp. 39-60.
Suzuki, Y. and Sastrosuwito, S. (2011). Efficiency and Productivity Change of the Indonesian Commercial Banks. IPEDR vol.7, IACSIT Press, Singapore, pp. 10-14. Wagner, J.M. and Shimshak, D.G. (2007). Stepwise Selection of Variables in Data Envelopment Analysis : Procedures and Managerial Perspectives. European Journal of Operational Research, 180(1), pp. 57-67.
Yusof, K.N.C.K., Razali, A.R. and Tahir, I. M. (2010). An Evaluation of Company Operation Performance Using Data Envelopment Analysis (DEA) Approach: A study on Malaysian Public Listed Companies. International Business Management, 4(2), pp. 47-52.
Zhao, X., Wang, S., and Lai, K.K. (2011). Mutual Funds Performance Evaluation Based on Endogenous Benchmarks. Expert Systems with Applications, 38(4), pp. 3663–3670. Zheng, X., Zhao, K.W. and Hui, E.C.M. (2011). Efficiency Assessment of Listed Real Estate Companies: An empirical study of China. International Journal of Strategic Property Management, 15(2), pp. 91-104.
Zhu, J. (2009). Quantitative Models for Performance Evaluation and Benchmarking: Data Envelopment Analysis with Spreadsheets. 2nd edition. International Series in Operations Research & Management Science. Springer Science and Business Media. Zhu, J., (2000). Multi-factor performance measure model with an application to Fortune 500 companies. European Journal of Operational Research, 123, pp.105-124.
Zohdi, M. et.al. (2012). Data Envelopment Analysis (DEA) Based Performance Evaluation System for Investment Companies : Case Study of Tehran Stock Exchange.