INTRODUCTION
The stainless steels in the austenite group are known as the chrome nickel series. They contain up to 0.25 % carbon, 7 % to 30 % chromium and 6 % to 36 % nickel. Their microstructure is austenitic they are not hardenable by heat treatment and are non magnetic. Hardness is accomplished by cold working, and this might cause them to be slightly magnetic. Their corrosion resistance is higher than the straight chromium groups.
These steels are more ductile and tougher than ordinary steels. Included in this group are AISI types 301, 302, 303, 304, 316, 321, 347 and most all 300 series alloys.
Typical application may include steel balls in micro spray pump for example deodorant spray pump, viscous liquid spray pump (for liquid soap and detergent), spray pump for metal container (without gas pressure) and insecticide spray pumps, for automotive sub
Akreditasi LIPI Nomor : 536/D/2007 Tanggal 26 Juni 2007
EFFECTS OF Ti ADDITION ON THE DIELECTRIC
PROPERTIES OF A NEW AUSTENITE ALLOY
Aziz K. Jahja dan Nurdin Effendi
Center for Technology of Nuclear Industry Materials (PTBIN) - BATAN Kawasan Puspiptek Serpong 15314, Tanggerang
ABSTRACT
EFFECTS OF Ti ADDITION ON THE DIELECTRICAL PROPERTIES OFA NEW AUSTENITE ALLOY. Preparation of alloys has been carried out leading to a new type of austenite alloys designated A-1 with a composition of Fe 52.22 wt%, Ni 24.2 wt%, Cr 20.0 wt%, Si 1.0 wt%, Mn 2.0 wt%, C 0.08 wt% and Ti 0.5 wt%. The main difference compared to commercial alloys (e.g. A347) is that Ti is added as an alloying element, but no P and S. The frequency-dependent conductivity and dielectric response of this novel material have been investigated by RLC bridge impedance spectroscopy method. It was verified that the real
dielectric constantof these new A-1 materials show a well defined dielectric behavior and shows a considerable
improvement over the commercial A-347 alloy with similar composition. Both dielectric response and dielectric loss curves show frequency dispersive relaxation peaks, indicating different conduction process in the surface and in the bulk of the materials. Therefore the substitution of P and S with Ti resulting in a new austenite with different dielectric properties. These improved dielectric properties should make this new material a good candidate for use as electrical connector, but with a reduced corrosion, so the lifetime or duration of application could be extended.
Key words: Austenite alloys, Novel materials, Dielectric properties
ABSTRAK
PENGARUH PENAMBAHAN Ti PADA SIFAT DIELEKTRIK LOGAM PADUAN AUSTENIT BARU.Telah dilakukan pembuatan bahan aloi austenit baru yang dinamakan dengan A-1, dengan komposisi 52,22 %berat Fe, 24,218.0 %berat Ni, 20,0 %berat Cr, 1,0 %berat Si, 2,0 %berat Mn, 0,08 %berat C dan
0,5 %berat Ti. Perbedaan utama denganalloy/paduan komersia (contohnya A-347) pada penambahan unsur Ti
sebagai unsur paduan, tapi unsur-unsur P dan S tidak ditambahkan. Telah dilakukan pengukuran karakteristik
konduktivitas dan dielektrikum bahan baru ini, menggunakan tehnik spektroskopi jembatan impedansiRLC.
Dapat diverifikasi bahwa konstanta dielektrikum relatif riilbahan baru A-1 menunjukkan perilaku yang lebih
menonjol dan menunjukkan perbaikan yang signifikan bila dibandingkan dengan sampel austenit standar A-347 yang memiliki komposisi yang mirip. Baik kurva respons dielektrikum maupun konstanta rugi dielektrikum (dielectric loss) menunjukkan puncak-puncak relaksasi yang berubah-ubah menurut frekuensi. Hal ini menandakan
kehadiran proses-proses konduksi yang berbeda-beda padabulkdan permukaan bahan. Substitusi P dan S
dengan unsur Ti menghasilkan suatu material austenit dengan sifat dielektrikum baru. Dengan demikian material ini dapat menjadi calon yang potensial sebagai sebuah konektor listrik namun dengan ketahanan korosi yang baik, sehingga umur pemakaian bahan diharapkan bisa lebih tahan lama.
Jurnal Sains Materi Indonesia
Indonesian Journal of Materials Science ISSN : 1411-1098
assemblies, machine bearings, valves and also electrical connectors especially in such device as fuel-cell Proton Exchange Membrane (PEM) and electrical uses as a substrate for hybrid circuits, additive printed wiring, and packaging for example [1, 2]. Although austenite in general are only slightly magnetic or even non-magnetic, however, in the manufacture of steel balls and media during the sintering slight magnetism is induced in all the stainless steel types, as mentioned previously [3].
Much interest has been shown to investigate the dielectric properties in steels and alloys, and in previous work dielectric properties of ferritic steel have been measured and discussed [4]. To complement investigation on the ferritic steel, especially to obtain data not available before in scientific literature, in this work, a series of new austenite samples labeled A-1 with a composition given in Table 1 have been prepared. This type of composition is not available before in the free market [5]. In this work the alloying elements of P and S, which are present in commercial A-347, have been substituted by Ti. Because both P and S caused air to permeate the sample and causes corrosion. Therefore this new austenite will be less prone to corrosion, but also at the same time its frequency response will be improved, since now substitution of two atoms (P and S) by a single atom with atomic radius larger than either S or P, will respond better to an external applied electric field [6].
In conventional austenite, no Ti is added as an alloying element. Therefore measurements on commercial A-347 austenite steel are also performed and the results compared to the synthesized A-1 samples. It is expected that the A-1 sample would project a more well-defined dielectric characteristics compared to the commercial A-347 austenite. Therefore these samples and their properties represent a state of the art new development in materials technology.
In view of the importance of these alloys in various sandwiched structures in devices mentioned above and to investigate the electronic processes in the materials, a.c. impedance spectroscopy has been used. Previous studies on a novel ferritic sample shows that the dielectric behavior of these new ferritic A-1 materials is considerably different compared to commercial ferritic materials, and represent a new finding in a new (novel) materials [4].
Because this method is very successful among other things for characterizing the electrochemical properties of electrodes, coating materials, mechanism of chemical reactions, measuring sensing characteristics of capacitance or conductance based sensors, and mechanism of electric conduction and dielectric polarization in austenite [7]. In the present work, results of dielectric and dielectric loss factor (tan)
room-temperature measurements on commercial A-347 and new A-01 austenite materials are presented and discussed.
Principles of Impedance Spectroscopy (IS)
Impedance spectroscopy (IS) is an electrical technique for characterizing the microstructure and physical properties of materials. The measured parameters could include electrical parameters such as complex impedance (Z), admittance (Y), complex capacitance (C*) and modulus (M). In most materials, these quantities are frequency dispersive or dependent. By studying how these parameters, vary with frequency, substantial information could be gained about dielectric, dipolar characteristics of the materials, and many behaviors of interest in these materials, such as charge layer formation could be studied.
IS experiments are conducted by applying a small amplitude a.c. voltage to the material and measuring the resultant current. By sweeping the frequency of the applied signal impedance over a wide range of frequencies could be determined. The other electrical parameters could be calculated via processor once the impedance is obtained. An appropriate electrode is used to apply the electric field to the material of interest.
EXPERIMENTAL METHOD
Materials
In this work, the new alloy codenamed A-1 has been prepared. The alloy is comprised of six different elements, iron, chrome, titanium, manganese, silicon, carbon each with a specified weight-percentage tabulated in Table 1.
Sample Preparation
The samples are prepared in the form of discs of thickness h and cross-sectional area A using powder metallurgy method described briefly below. The elemental components are determined according to their weight-percentages using the digital micro-balance; all alloying materials are then blended by constant stirring in a special-purpose plastic container; the process is continued by refined-stirring using the ball milling machine for 48 hours (2 days).
Each sample is synthesized from a powder-mixture (of about five grams each) poured into a dies of 5.0 cm outer diameter and 2.0 cm inner diameter. The compaction of the powder-mixture used pressures slightly above 8000 psi, with 10 minutes holding time [3]. The compacting pressure is determined by a previous preliminary pressure
Table 1. Chemical composition of new A-1 Austenite Fe52.22Cr24.2Ti0.05Si1.0Mn2.0C0.08steel [1].
Element Fe Cr Ti Mn Si C Ni
experiment carried out on several samples to obtain an optimum pressure magnitude yielding the best compaction results [3]. After compaction process the samples were sintered, and it was carried out at 1250oC for 45 minutes covered by argon inert gas, and then forged and continued to homogenization by heating it to 1250oC.
In this work several equipments and instruments were used. For sample preparation spatula, light-resistant plastic container, ball milling machine, dies, press-machine, furnace BIPs 395204 ball milling machine fabricated in 1996. Further, quenching hardened NKL steel-dies in cylindrical form with an outside diameter of 7 cm, and an inside diameter of 1,5 cm was used. For sintering, a furnace of the type thermoline model F47920-26-80. Press machine with a maximum pressure of 20.000 psi, is a Carver model 3912 S/N; 40.000-LOG 10785 constructed by Fred S. Carver Inc. are also used.
Characterization
Difraction intensity for phase verification are obtained using the Shimadzu X-ray diffractometer XD 610. Analysis of diffraction pattern indicates that A-1 austenite samples prepared and studied here have a single phase cubic structure [8]. Dielectric and dielectric loss factor data is measured using the computerized RLC spectrometer located at the BKAN-PTBIN laboratory. The disc-shaped samples (radius 1.50 cm and thickness 0.5 cm) are placed between two electrodes. An ac signal ofV= 1 V with various frequencies from 100 Hz to 100 kHz is applied. The values of the capacitance (Cp) and resistance (Rp) in parallel configuration are measured simultaneously [7]. The phase angletan (for the parallel configuration) is expressed as,
tan=2f RpCp ... (1)
fis the frequency and the dielectric loss factor is
D=tan= (tan)-1... (2)
The relative dielectric permittivity is calculated from the measured capacitance by the relationship = Ch/o A. With the absolute vacuum dielectric permittivity o is given by 8.85 x 10⁻⁸ F/m. The real component of the relative dielectric permittivity,, is then calculated using the relationship,
=/(1+D2)½ ... (2)
The imaginary component is given by the expression,
= D* ... (3)
RESULTS AND DISCUSSION
Crystal Structure Investigation
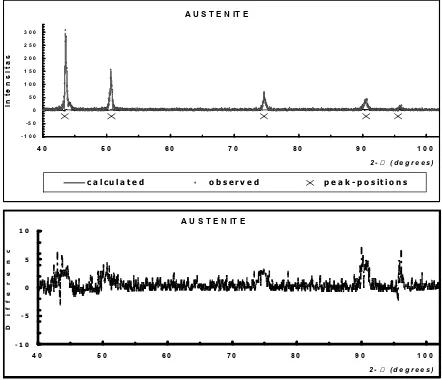
In Figure 1, the refined step counting diffraction pattern of A-1 sample is presented. From Figure 1 the unit cell parameters are calculated using the nominal wavelength of the X-ray diffraction and the results compared to the literature [8]. The experimental parameters will be used as the initial (guessed) input parameters in the Rietveld refinement procedures. It was evident from the initial (manual) analysis of the cell parameters that the crystal structure of the sample phase is based on a body centered cubic (bcc) unit cell. In Table 2. Structural parameters of the prepared A-1 samples is presented.
Dielectric Measurement
Results of the capacitance and electrical resistivity measurements as function of frequency are given in Figures 2, 3 and 4 below, each for the standard A-347 sample, for the protosample austenite A-1.
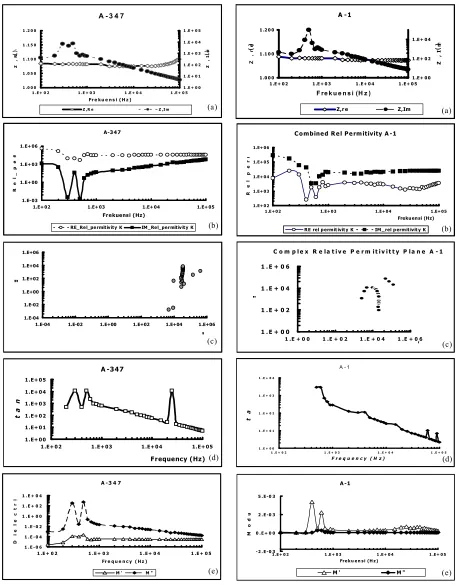
In Figure 2, the frequency dependent curves measured complex impedance (Z,reandZ,im), measured real and imaginary relative permittivity (, ), complex relative permittivity plane, dielectric loss factor tan versus frequency and measured real and imaginary dielectric modulus M(1/) of the standard
Figure 1.Refined diffraction pattern of synthesized A-1 steel sample (upper figure). For clarity the difference between the experimental and the observed intensity is presented separately (lower figure)
A U S T E N IT E
Table 2.Refined structural parameters of A-1
Lattice
Jurnal Sains Materi Indonesia
Indonesian Journal of Materials Science ISSN : 1411-1098
Figure 2.Standard sample A-347 a. Measured complex
impedance (real part Z,re() andimaginary part Z,im())
versus frequency b. Measured real relative permittivity
(
○
) and imaginary relative permittivity(■
) versusfrequency c. Complex relative permittivity plane d. Tan
versus frequency e. Measured real part (∆) and
imaginary part (
♦
) of the dielectric modulus MandM (1/).
RE_Re l_pe rmitiv ity K IM_Re l_per mit iv it y K (b)
1.E-04
1.E-04 1.E-02 1.E+00 1.E+02 1.E+04 1.E+06
'
Figure 3. Proto sample A-01 a. Measured complex
impedance (real part Z,re() andimaginary part Z,im())
versus frequency b. Measured real relative permittivity
(
○
) and imaginary relative permittivity (∆) versusfrequency c. Complex relative permittivity plane
d. Tanversus frequency e. Measured real part (
■
) andimaginary part (♦) of the dielectric modulusM and
sample A-347 are presented. Starting from Figure 2a, the real part of the impedance is almost insensitive to frequency. In contrast, the imaginary part of the complex impedance is very frequency dependent, with a broad peak centered around frequency of 400 Hz, and then starts to decrease monotonically.
In Figure 2b, the frequency dependence of the real and imaginary relative dielectric permittivity are shown, the real part () is not very sensitive to frequency, but the imaginary part shows some low frequency effect which is brought about by electrode polarization [8], and then starts to increase monotonically at 600 Hz, after dips at 300 Hz and 500 Hz respectively.
In Figure 2c, the dielectric loss factortanshows two relatively narrow peaks at lower frequencies, and after a decrease another peak at 25 kHz and the curve starts to monotonically decrease. The Argand diagram for the complex relative permittivity in Figure 2d ( versus complex plane plot) shows a highly distorted diagram at lower frequencies because of the electrode polarization effect, but then a quarter circle starts to form at higher frequencies. The dielectric modulus (M= 1/) are shown in Figure 2e, as function
of frequency. The imaginary part M, shows two peaks but no dips, and then a monotonically decreasing pattern starting from 600 Hz. The real part Mis almost frequency independent except for a small and broad peak centered at 400 Hz.
In Figure 3, the frequency-dependent curves measured complex impedance (Z,reandZ,im), measured real and imaginary relative permittivity (,), complex relative permittivity plane, dielectric loss factor tan versus frequency and measured real and imaginary dielectric modulusM(1/) of the austenite
proto sample A-1 are presented. The data for each sample differ only very slightly (1% or less) from one another. Therefore, the three samples could be analyzed as one, and no need to present separate analysis for each sample, which is also an experimental indication that sample preparation was carried out in a uniform and consistent manner.
Starting from Figure 3a, the real part of the impedance is almost insensitive to frequency. In contrast, the imaginary part of the complex impedance is very frequency dependent, with a broad peak centered around frequency of 500 Hz, a shift of about 100 Hz toward higher frequency when compared to the data of standard A-347 alloy, and then starts to decrease monotonically.
In Figure 3b, the frequency dependence of the real and imaginary relative dielectric permittivity are shown, both the real part () and the imaginary part () are relatively sensitive to frequency, with the usual electrode polarization effect pattern at low frequency [10]. The real partexhibit some peaks at 500- and 800 Hz respectively, and several semi-circles, centered around 4.0 kHz and 35 kHz. The imaginary partshows
a dip at 500 Hz, before rising and forming a very depressed semicircle centered around 15 kHz.
In Figure 3c, the dielectric loss factortan shows abnormal dielectric behaviour where relaxation processes consisting of several peaks are observed at 0.60, 4.0 and 15.0 kHz (diffuse peaks) followed by sharper peaks at 60.0- and 90.0 kHz.Here, the two narrow peaks observed at lower frequencies in Figure 2c, almost disappeared and shifted to the semicircles 4.o- and 15.0 kHz. The Argand diagram for the complex relative permittivity in Figure 3d (versus complex plane plot) shows a distorted but well defined semicircles and no electrode polarization effect at lower frequencies and this is in contrast to the A-347 sample. The dielectric modulus (M= 1/) are shown in Figure 3e, as function
of frequency. The imaginary part M, is almost frequency-independent except for a small and broad peak centered at 600 Hz. The real part Mis far more frequency sensitive, and shows two sharp peaks at 400 and 600 Hz, and a semicircle electric loss peak centered around 35 kHz.
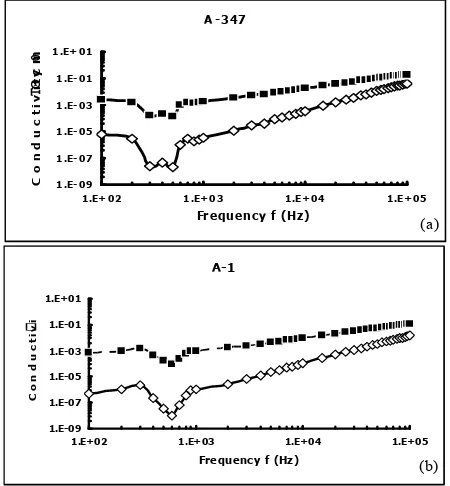
In Figures 4 above, the frequency dependent conductivity of both the standard A-347 alloy and the prepared protosample A-01 are presented. The only significant difference between the A-347 and the A-01 data is that the dip in the A-01 data is sharper and shallower than the A-347 data. In the A-01 data, the minimum occurs for both the real and the imaginary conductivity at 600 Hz and at 400 Hz for the A-347 data, which means there is a shift toward the higher frequency.
Figure 4. Frequency dependent conductivity of the standard A-347 steel sample (a) and the new austenite
protosample A-1 (b). (Note: The real part (◊) of the
complex conductivity and (
■
) the imaginary part of thecomplex conductivity).
1.E+02 1.E+03 1.E+04 1.E+05
Jurnal Sains Materi Indonesia
Indonesian Journal of Materials Science ISSN : 1411-1098
CONCLUSIONS
As is obvious from Figure 3 (A-01 samples), the relative dielectric permittivity show a relatively large value (up to 2.5 x 10³) and a wide range of variation (102to 106). Comparing Figure 2 and Figure 3, especially the relative permittivity and the dielectric loss curves, the absence of abnormal dielectric patterns or peaks in Figure 2, such as well defined quarter- and or semi-circles indicate that the dielectric properties of the standard A-347 sample is not as well established as that of the austenite A-01 protosamples. In Figure 3b, the dielectric response of consists of a space charge relaxation followed by a permanent dipole relaxation pattern plus a non-Debye relaxation pattern in the form of semicircles.
The semicircles in the frequency-dependent plot of the dielectric loss (tan) of A-1 samples indicate
that there is an electron exchange interaction mechanism between defects in the crystal [11]. The existence of maxima in the medium frequency range in the dielectric loss frequency dependence plot could be connected to the domain wall motion, because during the sintering process a slight magnetism is induced in the sample [3]. These semicircles are not observed in the A-347 sample, therefore this mechanism is absent in A-347 sample. Furthermore, in comparison with Figure 2c, the relaxation frequencies (corresponding to the peaks of the semicircles) have shifted to higher frequencies (4 kHz and 15 kHz respectively) indicating an increase in the jumping frequency of electrical carriers. In the real part of the conductivity versus frequency plots in Figure 4 reveals that the d.c. conductivity ( 0) for the A-347 sample is about 5.874 x 10⁻⁶/cm and is about 5.085 x 10⁻⁷/cm for the A-1 sample. So it is higher by an order of magnitude in the A-347 sample. This somehow explains the more dielectric characteristics of the new A-01 sample. The well defined Argand diagram ((versuscomplex plane plot) of figure 3c, shows that the grain- and grain-boundaries contributions to conductivity in the A-01 samples are separable, as opposed to the conventional A-347 sample. Based upon the above results, the substitution of P and S with Ti resulting in a new austenite with different dielectric properties. These improved dielectric properties should make this new material a good candidate for use as electrical connector or anode component for examples in fuel-cells, but without the danger of corrosion, so the lifetime or duration of application could be extended.
ACKNOWLEDGEMENT
The authors would like to express their gratitude to Dr. Ridwan, head of PTBIN-BATAN, for the valuable financial support for this research project, so that this programme could be carried out in the fiscal year 2006-2007. Gratitude is also due to
Dr. Ing. Pudji Untoro, head of BBIN-PTBIN such that this programme also could be continued in this 2007 fiscal year at PTBIN-BATAN. Also our thank is due to Dr. Setyo Purwanto head of BKAN-PTBIN and Mr. S. Purnama and Mr. P. Purwanto operators of the Hioki RLC spectrometer at BKAN.
REFERENCES
[1]. R. BARLOW,HomePower,72 (1999) 20-29 [2]. S. J. STEIN, C. HUANG, and A. S. GELB,Electro
Component Science and Technology, 7 (1980)
5-62
[3]. www.Key-to-Steel.com, (2005), www.knight-group.co.uk, (2005)
[4]. AZIZ K. JAHJA, M. SILALAHI, TRI DARWINTO and NURDIN EFFENDI, Jurnal Sains Materi
Indonesia,8(1) (2006)18-22
[5]. S.F. CASTRO, J. GALLEGO, F.J.G. LANDGRAFand H.-J. KESTENBACH, Materials Science and
Engineering, A427(1,2) (2006) 301-305
[6]. Q. ZOU, H. E. RUDA, and B. G. YACOBI, App.
Phys. Lett., 78(2001) 1282-1284
[7]. TEOH WAH TZU, ZAINALARIFIN AHMAD and AHMAD FAUZI MOHD NOOR,Adv. Tech. Mat.
Proc. Jou.,8[2] (2006) 274-277
[8]. P. VILLARS and L.D. CALVERT, Pearsons Handbook of Crystallographic Data for
Intermetallic Phases 2nd Ed., 2B, ASM
International (1991)
[9]. htt p :/ / ie e exp lo r e. i ee e . or g/i e l5 / 19 / 26 7 00 / 01191417.pdf?arnumber=119141, 2007-09-20 paper: iterp_20.pdf
[10]. D. D. KHALYAVIN, A.M.R. SENOS and P.Q. MANTAS, Materials Science Forum, 514-516 (2006) 255-258