Efek Hidrokoloid pada Sifat Rheologi Adonan dan
Fisikokimia Roti pada Roti Non Gluten dengan
Formulasi Tepung Singkong (Manihot esculenta
Crantz)
The Effects of Hodrocolloids on Dough Rheological and Bread with
Cassava Flour (Manihot esculenta Crantz) Formulation
SKRIPSI
Diajukan untuk memenuhi sebagian dari syarat-syarat guna memperoleh gelar Sarjana Teknologi Pertanian
Oleh :
Angelina Rosita Puspaningtyas
05.70.0044
PROGRAM STUDI TEKNOLOGI PANGAN
FAKULTAS TEKNOLOGI PERTANIAN
UNIVERSITAS KATOLIK SOEGIJAPRANATA
SEMARANG
2009
1
1.
INTRODUCTION
1.1. Gluten Free Bread
Nowadays, the consumption pattern is referring to practical food product, like bread, snacks, and noodles. This pattern leads to the increasing demand of flour based food product (Subagio, 2006). The most popular yeast leavened product is bread. Bread has the various size, shape, texture, taste, color, and flavor (Bennion & Hughes, 1975). A number of reports have appeared that bread can be produced in the absence of gluten (Ćuric et al., 2007; Selomulyo & Zhou, 2007; López et al., 2004; Hoseney, 1986). Clearly, gluten free bread has different texture from what we expected from wheat flour. The common problem is that they slow the diffusion of gas (Hoseney, 1986).
Gluten free bread is the bread that free from gluten protein. The bread is made based on naturally gluten free flours from rice, maize, soya, cassava, guar or amaranth (Olexová
et al., 2006). In recent years the demand of gluten free product has been on the rise and so interest in gluten free bread production. Gluten free bread was produced as the diet alternative for gluten enteropathy patient (coeliac disease patient). Most toxic for coeliacs are wheat proteins: α-, β-, and γ- gliadin, low molecular weight and high molecular weight glutenins. Coeliac disease is a condition in which the mucous membrane of the small intestine of gluten intolerance person is damaged by gluten. The villi, which line the inside of the bowel, are flattened and their normal function to break down and absorb nutrients is depleted. This leads to deficiencies in vitamins, minerals, and sometime protein, carbohydrates, and fats; then results weight loss, diarrhea, anemia, fatigue, flatulence, deficiency of folate and osteopenia. The only treatment for this coeliac disease patient is lifelong gluten free diet (Ćuric et al., 2007; Olexová et al., 2006; López et al., 2004).
Currently, starch dairy proteins and hydrocolloids are added to naturally gluten free flour to mimic viscoelastics properties of gluten and to improve structure, sensory attributes, and shelf life (Ćuric et al., 2007). Due to the lack of gluten network in rice flour, hydrocolloids such as xanthan gum, guar gum, and Hydroxypropylmethylcellulose (HPMC) have been applied to increase the dough’s
2
water absorption, induce dough strengthening and increase the dough’s ability to retain gas (Therdthai et al., 2006). Addition of hydrocolloids affects the swelling of granules, suggesting that swelling is enhanced in their presence (Babićet al., 2006).
1.2. Bread Making Process
The most popular yeast leavened product is bread (Bennion & Hughes, 1975). The minimum formula for bread is flour, yeast, salt, and water. The flour is the main component and it is responsible for the structure of the bread. It allows the formation of viscoelastics dough that able to retain gas. Yeast is one of the fundamental ingredients that play the roles on the fermentation process of carbohydrates into carbon dioxide and ethanol. The gases that result from that conversion provide the lift that produces leavened loaf of bread, then effect on the rheological properties of dough. Salt is generally used at the level of 1-2% based on the flour weight (Hoseney, 1986). Yeast is the monocellular microscopic organism. Commonly, there are two kinds of instant yeast products: compressed yeast and dry yeast. Compressed yeast has to be stored in freezer. The liquid yeast product usually made from potato liquid, sugar, and yeast (Bennion & Hughes, 1975).
There are two functions in salt addition. Firstly, salt gives taste and the secondly, salt affects the dough’s rheological properties too. Salt makes dough stronger, presumably by shielding charges on the dough protein. The last fundamental ingredient is water, that acts as plasticizer and solvent. Water result the viscous flow properties of dough. As a solvent, water supports many reactions that take place during fermentation process (Hoseney, 1986).
Bread has the various size, shape, texture, taste, color, and flavor. Actually, formulation on bread making process affects the characteristics of bread. By product of fermentation process like organic acids or amino acids results the specific flavors of the product (Bennion & Hughes, 1975). Good characteristics of bread typically present an appealing golden brown crust; pleasant roasted aromas, fine slicing characteristics, a soft and elastic crumb texture and a moist mouth feel (Selomulyo & Zhou, 2004).
3
Fermentation process is the most important part in the bread making process. Bread volume is affected by CO2 during the dough formation and protein characteristics to
retain gas in the fermentation process. This process is affected by three factors; they are yeast’s substrate, humidity, and temperature that suitable for yeast growing. Temperature for the optimal yeast fermentation process is 35 – 380C. Flour and sugar are the source of fermentable carbohydrate for the yeast (Matz, 1992; Hoseney, 1986). Sugar also provides a sweet taste of bread. The humidity can be achieved from the addition of water (Hoseney, 1986).
An egg is constructing by the albumin and yolk part. The protein of white egg, albumin plays in improving dough’s volume, and then the yellow one, the yolk, plays as emulsifier (Matz, 1992; Bennion & Hughes, 1975). Fat or shortening also acts as a plasticizer in dough. In the bakery industry, improver usually added to improve the dough structure to retain gas during fermentation process. Improver usually adds in fewer amounts than yeast and salt. Improver can be formed from mixing starch, amylase, salt and ascorbic acid. Ascorbic acid affects the raising of dough ability to retain CO2 gas and to produce small porosity of bread crumb that affect to the crumb
texture. Amylase content in improver affects the bread volume improvement. During dough making process amylase degrades the carbohydrates to the simply form that used as yeast’s substrate in the fermentation process that contribute to dough volume improvement (Cauvain & Young, 2000).
The processing of bread can be divided into three basics operations: mixing or dough formation, fermentation and baking (Hoseney, 1986). During baking process the gas production by yeast is still continuous and affects expandable volume rapidly with the increasing temperature until 430C. Later the gas production decreases and stops when the temperature 550C is reached (Cauvain & Young, 2000).
Matz (1992) said that there were three categories of bread making procedures: 1. Regular or full straight dough
The dough is being fermented for two to four hours before baking
4
2. Short time straight dough
The dough is being fermented for half to an hour before baking 3. No time dough
The dough is being fermented less than fifteen minutes before baking
According to Hoseney (1986), the simplest bread making procedure is a straight dough system. In such a system, all the formula ingredients are mixed into developed dough that is then allowed to ferment. During its fermentation, the dough is usually punched one or more times. After fermentation, it is divided into loaf sized pieces, rounded, molded into the loaf shape, and placed into baking pan. The dough is then given an additional fermentation (proofing process) to increase its size. After reaching the desired size, it is placed in the oven and baked. In the straight dough methods, the fermentation time is quite widely from no time processing bread methods. Dough is more than flour-water systems. Dough is formed by mixing the flour, flour-water, and other ingredients. When the flour and water are mixed in various proportions, they form everything from slurry when water is in large excess, and a dry but slightly cohesive powder when flour is in large excess. At an intermediate level, they are more likely to produce sticky mass. Dough’s characteristics are cohesive, partially elastic, and resistant to extension.
1.3. Cassava
Cassava is a member of the Euphorbiaceae family and is in the genus and species
Manihot esculenta. Cassava is a dicotyledonous perennial shrub, which grows three to six feet tall. It has large palmate leaves. The edible portions are leaves and the root. The roots store fairly well under refrigeration. At 5.5 to 7°C and 85 to 90% relative humidity (RH), the crop will last one to two weeks. Above 20°C, and with high humidity, loses are large. Root deterioration begins soon after harvest, and internal discoloration of the vascular tissue is followed by microbial invasion and decay. Because of its perishable nature, most cassava is consumed where it is grown (Stephens, 1994). To avoid bio deterioration of cassava root which start within 2-3 days after harvest, the roots should be dried immediately after harvest to maintain their quality (Bokanga, 1995).
5
In Asia, over 40 percent of the cassava product is for direct human consumption. Nowadays, the carbohydrates need in Indonesia mostly supplies from wheat and rice. Indonesia has many sources of carbohydrates, and most popular carbohydrate’s source is cassava. Commonly the application cassava in food products is still limited. In Indonesia, 57 percent of production is for human consumption. Cassava is a cheap source of calories and often supplements insufficient rice supplies. Many people in Indonesia process the cassava traditionally to produce snack, such as: fried cassava, steamed cassava, kolak, cassava chips, getuk, combro; that commonly consumed by the intermediate-low economic class (FAO, 1999).
In Lampung, the production of cassava reached 5.7 tons from 288,640 hectares of field in 2007 (Anonymous, 2008). Cassava has been cultivated in agro business scale. Most of it transformed into half-finished products like tapioca flour, cassava flour, and
gaplek. This cassava flour hopefully can be mixed as the ingredients in many kinds of food; furthermore it can decrease the dependency in wheat flour. The production of cassava is 19.4 million tons, but only 59 percent is used to be converted in industry. Considering the abundant availability of cassava flour in the country, there are wide open opportunities to develop it as the substitution of wheat and rice in flour making. Therefore, it can be an alternative in order to diversify food products (Sawega, 2007).
Many studies have proclaimed that cassava has the low glisemic index and potential as the prebiotic and dietary fiber that can reduce the risks of disease, especially constipation and heart disease. Cassava roots are high in starch, making it a good energy source, and vitamin C, but are low in vitamin A and protein (Stephens, 1994). According to Prof. Dr. Made Astawan in Sawega (2007), the expert of food and nutrient technology from Institut Pertanian Bogor (IPB) said that the content of carbohydrate in cassava flour is high enough: 84 grams; compared to rice flour (80 grams), corn flour ( 73.7 grams), and wheat flour (77.3 grams). The energy contained in cassava flour is reaching 363 kkal per 100 grams; not much different from wheat flour (365) and rice flour (364). Only the content of protein that relatively low: 1.1 grams; in wheat flour 8.9 grams, and rice flour 7.0 grams (Sawega, 2007).
6
In areas of high cassava consumption, there is concern that the people may accumulate toxic levels of cyanogenic glucoside, especially when the leaching process is not complete. The presence of cyanide in the roots is a natural form of protection for the plant. Soil and climatic conditions determine the amount of this compound found in the roots. Cyanide is released upon crushing the roots, as one would do in chewing. This substance caused the bitterness of the root. Because of the presence of cyanogenic glucoside, cassava roots must be processed before they can be eaten (Stephens, 1994).
The constraint of wheat flour application in bread making process is due to the high level of the price of this product and the limited availability in market (Eddy et al., 2007; Damanik, 2006; Balagopalan, 2002; Bokanga, 1995). Food processing engineering was done to decrease market demand of specific source of food and actually giving new alternatives of product needed (Syah, 2006). Far away before increasing price of wheat flour, Agricultural Research and Development Agency has been improving the process technology to produce cassava flour, that applicable for wheat flour substitution. The cassava flour’s texture, color, and aromas are most like the wheat flour. Cassava flour can be used as composite flour with wheat flour or as the main ingredient in cake, bread, and other snack food (FAO, 1999).
The idea to substitute part partially wheat flour portion with starchy crops is not new, for example it had been done by the Eduardo Mondlane University (UEM), the education institution in Mozambique, that had successfully conducted a study on using a mixture of wheat and cassava flours to produce bread for seeking solutions of increases in the price of wheat flour by the milling companies, which subsequently increases the price of bread (Agencia de Informacao de Mocambique, 2007).
The method of flour preparation is important in determining the quality of cassava flour in bread making. The chipping machine reduces the tuberous root to about 2 mm thin chips thus increasing the surface area exposed air and resulting in a faster drying rate. The production of small size cassava chips results in greater physical damage impact and reduction in the cyanogenic potential of the flour (Bokanga, 1995).
7
Composition of amylose and amylopectin in cassava starch has the functionality to form gels. The best bread making ability can be reached by using the cassava flours with less alpha amylase (a component of the diastatic activity) and maximum paste viscosity. With these characteristics, cassava flour can be used to partially substitute wheat flour with other sources of flour or replace wheat altogether (Bokanga, 1995). The application of cassava flour in bread making process results the lack of volume and texture of bread; compared by wheat bread (FAO, 1999).
1.4. Hydrocolloids
Substances that called hydrocolloids or vegetable gum are polysaccharides and are performing increasingly important function in food processing. Gums are classified by source according to the following principal groupings:
• Seaweed extracts, such as agar, alginate, furcellaran and carrageenan.
• Plants seed gum, such as guar gum, locust been gum, tamarind, psyllium, quince
• Plants exudates, such as Arabic Gum, gum tragacanth, and gum karaya, ghatti.
• Plants extract, such as pectin and arabinogalactan.
• Fermentation gum, such as xanthan gum and dextran
• Synthetic materials, such as methyl cellulose and sodium carboxyl methyl cellulose.
(Igoe, 1989).
These gums are used in processed foods for such purposes as the retention of water, reduction evaporation rates, and modification of ice crystal formation. The production of dietetic foods often requires the potency of hydrocolloids (Bennion & Hughes, 1975). The comparative properties of the gums can be seen in table 1.
Table 1. Comparative Properties of Gums
Gum Cold Water
Solubility
Hot Water Solubility
Gel Former Acid Stability
Arabic (acacia) yes yes no pH 4-10
Guar yes yes no Between pH 3,5 –
10,5, gradual decline with acidification
Xanthan yes yes no Between pH 2-12
( Igoe, 1989)
8
A hydrocolloid can simply be defined as a substance that forms a gel in contact with water. Substances include both polysaccharides and proteins which are capable of one or more of the following: thickening and gelling aqueous solutions, stabilizing foams, emulsions and dispersions and preventing crystallization of saturated water or sugar solutions. In the baking industries, hydrocolloids used as baking improvers as they can induce structural changes in the main components of flour system along bread making steps and bread storage (Lersch, 2007; Selomulyo & Zhou, 2007). Hydrocolloids may contribute sliminess to a product which changes their viscosity. The presence of hydrocolloids influences melting, gelatinization, fragmentation, and retrogradation process of starch. Addition hydrocolloids affect the pasting properties and rheological behavior of dough (Selomulyo & Zhou, 2007).
Arabic gum is exudates of acacia trees. It is a heterogeneous material containing two fractions; 70% polysaccharide chains with little or no nitrogenous material and 30% protein structures. It has high solubility, low viscosity and high compatibility with high concentration of sugar. The highly branched structure of the gum gives rise to compact molecules with relatively small hydrodynamic volume and as a consequence gum solutions become viscous only at high concentration (Selomulyo & Zhou, 2007). Characteristics of arabic gum are very high solubility in water, cold water soluble, milk reactivity, excellent emulsifier, foam stabilizer, adhesive, film-foaming, emulsifying property. Whereas most gum forms highly viscous solutions at low concentration of about 1-5%, arabic gum is unique in that it is extremely soluble and is not very viscous at the low concentration (Glicksman, 1983).
Guar gum is a vegetable gum made of Cyamopsis tetragonoloba endosperm seed. Guar gum is classified in galactomannan cluster. Its molecule formula has main chain that consists of 1-4-β-D-manosa and 1-6-α-galactose chain (Edwards, 2000). It is dispersible in cold water to form viscous sols which upon heating will develop additional viscosity. Guar gum can dissolve well in cold water because it contains high galactose and mannose. This is the cause why guar gum is suitable to be used in industry scale. Guar gum is an economic thickener and stabilizer. Guar gum can also prevent the growth of ice crystal by decreasing mass transfer between solid/liquid surfaces (Anonymous,
9
2004). It is a versatile thickener and stabilizer used in ice cream, baked goods, sauces, and beverages at use levels ranging from 0.1 to 1.0 percent based on the flour weight (Igoe, 1989). The use of guar gum is better less than 1% for aqueous solution. Guar gum solutions are highly viscous at low concentration and useful in thickening, stabilization and water binding applications. The maximum viscosity reached at 25-400 C temperature. Guar gum is very stable to the variation of pH. Besides, guar gum has also synergic effect with other gum or starch (Imeson, 1999). In bakery product, guar gum is used to improve mixing and recipe tolerance to extend shelf life of product through moisture retention (Selomulyo & Zhou, 2007).
Xanthan gum is extra cellular polysaccharides secreted by bacterium Xanthomonas campestris. Clarified xanthan gives visibly clear solutions even at high xanthan concentrations, while unclarified xanthan solutions are opaque xanthan gum is anionic polysaccharides with monomer 1,4 β-D-glucose, 1,2 D-mannose, and 1,4 D-glucuronic acid. The viscosity of xanthan gum solutions is stable over a wide range of pH, salt concentration and temperature conditions and the polysaccharide is resistant to enzymatic degradation (Selomulyo & Zhou, 2007). It is also very pseudo plastic which results in a decrease in viscosity with increasing shear. It reacts synergistically with guar gum to provide an increase in viscosity or gel formation. It is used in salad dressing, sauces, desserts, baked goods, and beverages at 0.005 to 0.5 percent based on the flour weight (Igoe, 1989). It is listed as emulsion stabilizer; holds water; enhances freeze-thaw stability; inhibits starch retro gradation; improves shelf life and serves to bring about stabilization of dispersions, suspensions, and emulsions, thickener (Smith, 1991).
1.5. Rheological and Physical Properties
Rheology is the study of how materials deform, flow, or fail when force is applied. The rheological properties of some materials can be described by a single value. However, most materials, like dough are not that simple in their properties or behaviors but show a more complex rheological behaviors. Usually, the dough’s characteristic is viscoelastic; it exhibits both viscous flow and elastic recovery. Viscous flow means that the material will flow under stress and not recover immediately when the stress is released. Flour-water dough has a bigger elastic modulus than gluten-Flour-water dough. This appears show
10
that starch is not an inert ingredient in flour water doughs. Filled polymers generally are known to have a larger modulus than their unfilled counterparts (Hoseney, 1986).
The bread quality is affected by some parameters. The bread shape is influenced by bread making process; the loaf volume is influenced by time and condition during fermentation process. The yellowish brown crust color is influenced by ingredients and baking process. The other quality parameters are crumb stability, crumb firmness, crumb resilience, crumb structure, and flavors (Matz, 1992).
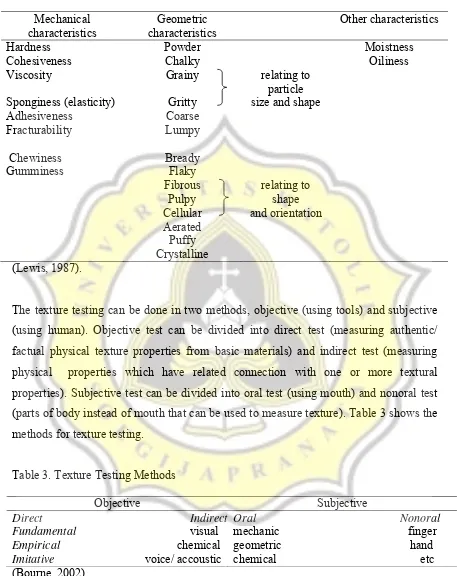
Texture is an important determinant in food quality. Texture describes the attribute of a food materials resulting from combination of physical and chemical properties, perceived largely by senses of touch, sight, and hearing (Lewis, 1987). The importance of texture in affecting the quality of food materials as a whole has wide variations, depends on the type of food, which can be divided into three groups:
1. Critical: foods which the textures are very dominant, like meat, corned beef, chips, cornflake
2. Important: foods which the textures are important, but do not have dominant role for the quality as a whole, like most of fruits, vegetables, cheese, cereal, bread, and candies are concluded in this category.
3. Minor: foods which the textures are ignored as a whole, like most of beverages and gooey/liquid/runny/watery soup.
(Bourne, 2002).
An attribute texture is a combination of physical and chemical properties; these include the shape, size, and arrangement of the constituent structural elements. Table 2 shows the classification of textural characteristics according to their likely origins.
11
Table 2. Classification of textural characteristics according to their likely origins Mechanical
characteristics
Geometric characteristics
Other characteristics
Hardness Powder Moistness
Cohesiveness Chalky Oiliness
Viscosity Grainy relating to
particle Sponginess (elasticity) Gritty size and shape
Adhesiveness Coarse
Fracturability Lumpy
Chewiness Bready
Gumminess Flaky
Fibrous relating to
Pulpy shape
Cellular and orientation
Aerated Puffy
Crystalline
(Lewis, 1987).
The texture testing can be done in two methods, objective (using tools) and subjective (using human). Objective test can be divided into direct test (measuring authentic/ factual physical texture properties from basic materials) and indirect test (measuring physical properties which have related connection with one or more textural properties). Subjective test can be divided into oral test (using mouth) and nonoral test (parts of body instead of mouth that can be used to measure texture). Table 3 shows the methods for texture testing.
Table 3. Texture Testing Methods
Objective Subjective
Direct Indirect Oral Nonoral Fundamental visual
Empirical chemical
Imitative voice/ accoustic
mechanic finger geometric hand chemical etc (Bourne, 2002).
Hardness, fracturability, springiness, cohesiveness, gumminess, chewiness, adhesiveness are some profiles of texture profile analysis (TPA). TPA imitate/
12
impersonate chewing system of a food sample with texture analyzer. A slice of food that has been measured pressed twice with an added tool or an equipment suitable with the sample characteristic. Seven texture characteristic types (5 measured and 2 calculated from measured parameters) showed in a TPA curve: fracturability, hardness, cohesiveness, adhesiveness, springiness, gumminess, chewiness (Anonymous, 2003).
The objective definition of hardness is the highest energy that happened in the first sample compressive test. For more information, the testing process will produce graphs. A graph with the highest peak is the score of a sample hardness level. Hardness testing is the primary parameter in texture and tested by using TPA criteria (Bourne, 2002). Hardness can also be used to define the power needed to break or destroy samples between molar teeth (Bourne, 2002; Rosenthal, 1999).
Adhesiveness is the power needed to pull sample, the bigger the power, the higher the adhesiveness. Cohesiveness is the sample internal strength that constructs sample’s structure. Chewiness is the power needed to chew solid sample until it is ready to be swallowed. Elasticity is the length extension produced, from the sample pressed until it back to its original shape. Brittleness is the power used to make the main material easily crushed. The easily crushed food is not always adhesive. Gumminess is the energy needed to separate a semi-solid food material until it is ready to be swallowed (Rosenthal, 1999).
1.6. Sensory Analysis
Sensory analysis is very important because not all of quality attributes can be analyzed by using tools. The objective of sensory analysis is to analyze product’s quality and interpreting the sensation received by five senses. This analysis can also be identifying the consumer acceptance (Ressureccion, 1998).
The types of sensory testing used depend on the objective of testing. While the amount of panelists used depends on the expertise level and training of the panelist. Panelist divided into three, which are: Untrained, trained, and expert (Rosenthal, 1999). Untrained panelist used to test the preference in a product or the willingness to use a
13
product. Because it includes the level of preference, it will make more panelists producing better data (Kartika et al., 1988).
In order to get trained panelist, training and selection process is needed (Meilgaard et al., 1999). There are three steps of selection process that should be done in the panelist selection process:
1. Matching Test
Matching test used to determine the selection participant ability in distinguishing (and describing, if asked as addition) between several sample types (stimulation) provided at recognized intensity. Panelist candidates are given a set of sample (consist of 4-6 samples coded), then given the second sample (identical with first sample but randomized). Candidates asked to identified the matched samples between those two sets and if it needed, describing them. Candidates are rejected if they answered less than 75% matching correctly and less than 60% describing correctly.
2. Discrimination Test / Detection Test
The objective of discrimination test is to see the ability of the selection participant to distinguish the most different products, among two products which are exactly the same. This discrimination test can be done in two testing types: triangle test and duo-trio test. The panelists are given 3 or more sets of triangle test/ duo-trio test, with the difference range from easy to hard. When we use the triangle test, the candidates will be rejected if they answered less than 60% correct in easy test or less than 40% in hard. When we use duo-trio test, the candidates rejected if they answered less than 75% correct in easy test or less than 60% correct in hard.
3. Intensity Ranking Test
This test is used to identify the candidate’s ability to distinguish the different intensity level in a specific attribute and then arrange it in the right order. When we use the ranking test, the candidates accepted if they can arrange the sample in the right order correctly or only reversed at the close order.
14
Meilgard et al., (1999) stated that there are several things should be done in order to make training process runs well.
• Panelists have to be taught to follow the procedure correctly, before or after the evaluation.
• Emphasizing the panelists to check on the instruction first before doing the test.
• Giving the way to reduce or even eliminate adaptation, like giving time, several seconds in the test.
• Emphasizing not to test individually, but concentrating more to identify the differences in each samples.
• For the testing of each attributes differences, the panelists have to be introduced to every attributes tested first.
1.7. The Objective of Research
The objective of the research is to evaluate the effects of hydrocolloids addition in gluten free bread with cassava flour formulation to rheological properties of dough, physicochemical, and sensory properties of bread. Moreover, the objective of this study is to determine the formulation that results the most acceptable product as well as consumer likely perception.
15
2.
MATERIALS AND METHODS
This research has been held from April to October 2008 and took place in the Food Processing and Engineering Laboratory, Unika Baking School, Food Science Laboratory, and Quality and Sensory Laboratory, Department of Food Technology, Soegijapranata Catholic University.
2.1. Materials
Cassava (Manihot esculenta Crantz) from Sampangan traditional market was peeled, washed, sliced, dried, milled, and sieved to obtain flour with maximum 10% moisture content. Sugar “Gulaku”, salt “Refina”, egg, shortening “Filma” were purchased from “ADA” Supermarket, Semarang. Instant dry yeast “fermipan” and “baker bonus” bread improver were purchased from “Sumber Wangi Store”, Semarang. Food grade hydrocolloids: arabic gum, guar gum, and xanthan gum were purchased from chemistry shop “Multi Kimia Raya”, Semarang. The equipments that were used include: slicer, dehumidifier, caliper, texture analyzer, oven, porcelain dish, desiccators, destruction equipment, distillation equipment, titration equipment, soxhlet gourd, and extraction equipment.
2.2. Methods
2.2.1. Cassava Flour Preparation
The cassava flour was produced in order to be used as the main ingredient of gluten free bread making. Its production process took place in the Food Processing and Engineering Laboratory, Department of Food Technology, Soegijapranata Catholic University. Fresh cassavas were sorted and peeled to obtain fresh cassavas with good physical condition. Figure 1 shows the fresh peeled cassava. Then, their sap were removed, dust and soil were cleaned with flow water. After that, they were sliced and continued with steam blanched for 3 minutes. The sliced cassavas then are placed inside the dehumidifier to be dried at 70 0C for 48 hours. The dried cassavas were ground and sieved at 625 mesh. The cassava flours then packed into polypropylene plastic in the plastic containers, and
16
stored in dry areas. The cassava flour making process flow chart can be seen in Figure 2 while the cassava flour can be seen in Figure 3.
Figure 1. Fresh peeled cassava (Manihot esculenta Crantz)
= process
= raw material/ product
Figure 2. Flowchart of cassava flour production Fresh cassava
Sorting, peeling, washing
Slicing
Blanching (850C, 3 min)
Drying (700C, 48 hours)
Grinding
Sieving on 625 mesh
Cassava flour
17
Figure 3. Cassava Flour
18
2.2.2. Bread Preparation
Gluten free bread production process took place in the Unika Baking School, Department of Food Technology, Soegijapranata Catholic University. Gluten free bread was produced by straight dough-bread making process (Matz, 1992). The dough’s composition was based on gluten free bread with rice flour (Therdthai et al., 2006) with some modifications. The gluten free bread formulation with the addition the different kind and different level concentration of hydrocolloids that was used in this experiment presented in Table 4 and Table 5. The preparation started by weighing the entire ingredient. The following step was the mixture of 92 g cassava flour; 2.76 g bread improver; 32.2 g sugar; 2 g instant dry yeast (Saccharomyces cerevisiae, Fermipan), and hydrocolloids for about 30 seconds; then continued with addition of 31 grams whole eggs; 8.9 g palm oil; 1.8 g salt; and 50 g water until form the homogenous dough. The dough was rested for 10 minutes then it was divided into pieces (20 g), put in the bread pan and rested of 10 minutes at room temperature (Figure 4). After that, doughs were proofed for 60 min at 40oC with 95% relative humidity inside the proofing chamber. They were baked for 15 min at an oven temperature 250oC.
Figure 4. A 20 gram per each of dough at room temperature
19
Table 4. Standard Formulation used for Gluten free Bread Preparation Ingredients Grams
Cassava flour 92
Sugar 32.2
Whole egg 31
Yeast 2
Bread improver 2.76
Salt 1.8 Hydrocolloids*
Palm oil 8.9
Water 50
* Three different kinds of hydrocolloids, which are: arabic gum, guar gum, and xanthan gum were added based on the flour weight in bread formulation with four different levels based on the range of maximum limit usage of hydrocolloids in bakery product.
Table 5. The Application of Different Kinds and Different Concentration of Hydrocolloids in Gluten Free Bread Formulation
Hydrocolloids Concentration*
Arabic Gum
0.8% 1.2% 1.6% 2.0%
Guar Gum
0.2% 0.3% 0.4% 0.5%
Xanthan Gum
0.15% 0.25% 0.35% 0.45%
20
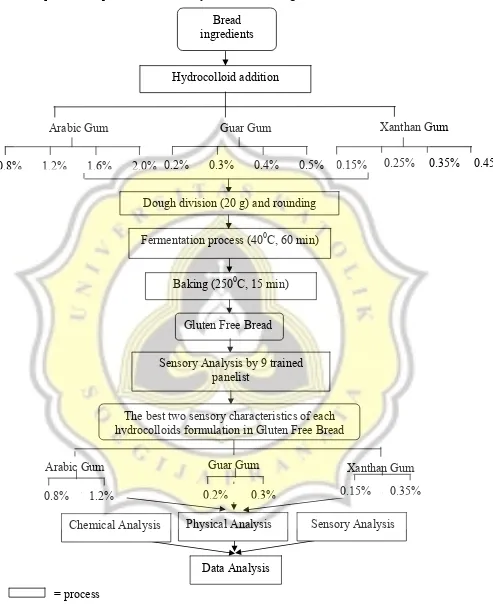
The sequence of experiment in this study can be seen in Figure 5.
= process
= raw material/ food product/ formulation
Figure 5. Flowchart of Experimental
Xanthan Gum Dough division (20 g) and rounding
Fermentation process (400C, 60 min) Bread
ingredients
Hydrocolloid addition
0.15% 0.25% 0.35% 0.45% Arabic Gum
0.8% 1.2% 1.6% 2.0%
Guar Gum
0.2% 0.3% 0.4% 0.5%
Xanthan Gum
Baking (2500C, 15 min)
Gluten Free Bread
Sensory Analysis by 9 trained panelist
Data Analysis
Chemical Analysis Physical Analysis Sensory Analysis The best two sensory characteristics of each
hydrocolloids formulation in Gluten Free Bread
Arabic Gum
0.8% 1.2%
Guar Gum
0.2% 0.3% 0.15% 0.35%
21
2.2.3. Trained Panelist Selection
This research used two types of panelists: trained panelists and untrained panelists. In this experiment are used 9 persons of trained panelist that gained from selection process of trained panelist. The untrained panelists used were 50 persons. Untrained panelists were used to test the consumer’s preference level to gluten free bread sample. Trained panelists were used to test the quality of the sample in several parameters which determine the product’s quality, like color, porosity uniformity, aroma, texture, and taste. In order to acquire trained panelists, selection process had been done. Its selection process took place in the Quality and Sensory Laboratory, Department of Food Technology, Soegijapranata Catholic University. It was conformed with Meilgaard., et al (1999) Through 3 steps: ability to match with matching test, ability to distinguish with triangle test, and ability to arrange in correct order with ranking test. Trained panelists were decided by choosing 9 panelists that had passed the selection steps to test gluten free bread with the application of different hydrocolloids types and concentrations in the main research. The worksheet and score sheet in every step of trained panelist selection test can be seen in Appendix 1. Below are the details of trained panelist’s selection steps:
2.2.3.1. Matching Test
Matching test was done by matching the taste of sample’s solution. The preparation was done by weighing sucrose, salt, citrate acid, and caffeine (20 g; 2.0 g; 0.5 g; and 1.0 g). Afterward, those were dissolved with mineral water until 1:1. Then, each sample was given codes and served in glass. Every panelist was given small spoon to take the given solution and questioner sheets. The panelists had been given explanation first about the instruction to perform matching organoleptic test before doing the test. Then, the questioner sheets that have been filled in were checked to get the result. The panelists were considered passed minimally if they succeed answering 75% correct (Meilgaard et al., 1999). The worksheet and scoresheet of matching test can be seen in Appendix 1 while the matching test process can be seen in Figure 6.
22
Figure 6. Matching Test Process
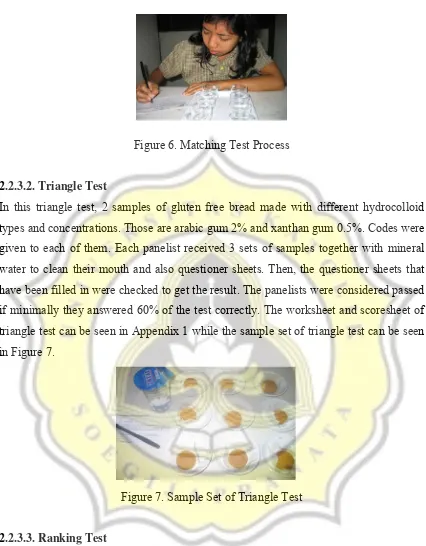
2.2.3.2. Triangle Test
In this triangle test, 2 samples of gluten free bread made with different hydrocolloid types and concentrations. Those are arabic gum 2% and xanthan gum 0.5%. Codes were given to each of them. Each panelist received 3 sets of samples together with mineral water to clean their mouth and also questioner sheets. Then, the questioner sheets that have been filled in were checked to get the result. The panelists were considered passed if minimally they answered 60% of the test correctly. The worksheet and scoresheet of triangle test can be seen in Appendix 1 while the sample set of triangle test can be seen in Figure 7.
Figure 7. Sample Set of Triangle Test
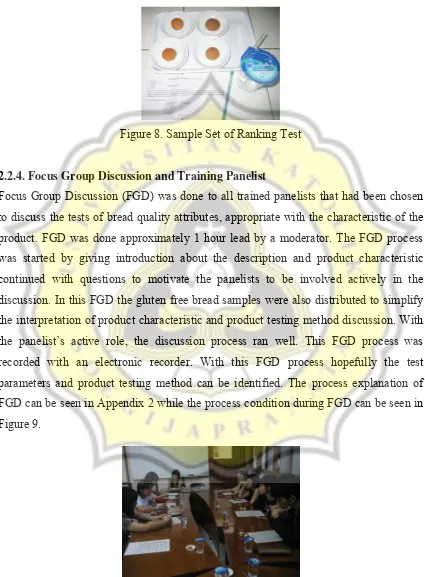
2.2.3.3. Ranking Test
In this test, the gluten free bread samples were formulated with addition of arabic gum hydrocolloids with 4 levels of concentrations: 0.5%, 1.5%, 2.5%, and 3.5%. The samples were given codes and served to the panelists together with mineral water and questioner. After had given the questioner sheets, the panelists were explained about the instruction of organoleptic ranking test (before they filled in the questioner). Then, the questioner sheets that have been filled in were checked to get the result. The panelists
23
were considered passed if they answered correctly or with minimum mistakes. The worksheet and scoresheet of ranking test can be seen in Appendix 1 while the sample set of ranking test can be seen in Figure 8.
Figure 8. Sample Set of Ranking Test
2.2.4. Focus Group Discussion and Training Panelist
Focus Group Discussion (FGD) was done to all trained panelists that had been chosen to discuss the tests of bread quality attributes, appropriate with the characteristic of the product. FGD was done approximately 1 hour lead by a moderator. The FGD process was started by giving introduction about the description and product characteristic continued with questions to motivate the panelists to be involved actively in the discussion. In this FGD the gluten free bread samples were also distributed to simplify the interpretation of product characteristic and product testing method discussion. With the panelist’s active role, the discussion process ran well. This FGD process was recorded with an electronic recorder. With this FGD process hopefully the test parameters and product testing method can be identified. The process explanation of FGD can be seen in Appendix 2 while the process condition during FGD can be seen in Figure 9.
Figure 9. Situation during Focus Group Discussion
24
2.2.5. Sensory Analysis 2.2.5.1. Intensity Rating Test
Before the rating test was done, trained panelists were given an explanation about attributes that will be tested. This rating test was using 9 trained panelists and 6 intensity scales for appraisal of each color, uniformity crumb porosity, aroma, and texture (hardness and springiness) attribute. The questioner sheets that have been filled in were checked, calculated, and summarized to get the result of this rating test (Meilgaard et al., 1999). The worksheet and scoresheet of intensity rating test can be seen in Appendix 3, while the sample set of intensity rating test can be seen in Figure 10.
Figure 10. Sample Set of Intensity Rating Test
2.2.5.2. Hedonic Ranking Test
The gluten free bread samples that were chosen to be used in this analysis were depend on the best two level concentration of each hydrocolloids from intensity rating sensory test by trained panelist. This ranking hedonic test was performed by presenting the products to 50 panelists by asking their preference on color, uniformity of crumb porosity, aroma, texture (hardness, springiness, adhesiveness, and overall texture), and taste. The worksheet, score sheet, and the panelist of hedonic ranking test can be seen in Appendix 4, while the sample set of hedonic ranking test can be seen in Figure 11.
Figure 11. Sample Set of Hedonic Ranking Test
25
2.2.6. Measurement of Physical Characteristics of Gluten Free Bread
The experiment was conducted with physical analysis for all samples of gluten free bread. Physical analysis includes the measurements of dough and bread volume and texture of bread. The experiments were repeated three times for every treatment.
2.2.6.1. Dough Volume Analysis
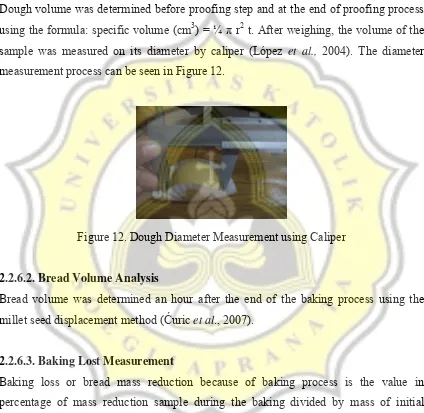
Dough volume was determined before proofing step and at the end of proofing process using the formula: specific volume (cm3) = ¼ π r2 t. After weighing, the volume of the sample was measured on its diameter by caliper (López et al., 2004). The diameter measurement process can be seen in Figure 12.
Figure 12. Dough Diameter Measurement using Caliper
2.2.6.2. Bread Volume Analysis
Bread volume was determined an hour after the end of the baking process using the millet seed displacement method (Ćuric et al., 2007).
2.2.6.3. Baking Lost Measurement
Baking loss or bread mass reduction because of baking process is the value in percentage of mass reduction sample during the baking divided by mass of initial sample. Baking loss measurement was done three times for each treatment, using this formula:
Baking loss= 100% - (bread mass : dough mass) x 100% ( Subagio et al., 2003)
26
2.2.6.4. Texture Measurement
After an hour cooling in the room temperature, bread was proceeded to instrumental measurements. Texture Profile Analysis including hardness, cohesiveness, adhesiveness, chewiness, and springiness was carried out on the central of bread by texture analyzer ‘LLOYD Instrument’ type ‘TA Plus’ with specific ball probe 15 mm, test speed 5 mm/s, and 0.05 kgf trigger (Bourne, 2002). Every sample of gluten free breads was punched on the central part. This texture measurement was done in three repetitions for each sample.
2.2.7. Measurement of Chemical Characteristics of Gluten Free Bread
Chemical analysis was conducted with the measurement of moisture content for all samples. Measurement of ash, protein, fat, carbohydrates, and fiber was done for the best consumer acceptance from hedonic ranking test result. The experiments were repeated three times for every treatment.
2.2.7.1. Moisture Content Determination
Moisture content of the dough and final product were determined following the Thermogravimetri Standart methods (Sudarmadji et al., 1989). Firstly, sample was weighed as much as 5 g on the porcelain dish that its constant mass had been known before. Both sample and porcelain dish were dried for 6 hours in oven chamber at 100-1050C. After that they were put in the desiccators for 15 min, later the sample was weighed and continued by the mass determination until it got the constant weight.
The moisture content of the sample can be calculated by using following formula: Sample weight (g) = W1
Dried sample weight (g) = W2
Evaporated water weight (g) = W1 - W2 = W3
Moisture content = 100% 1
3
x W W
(wet basis)
27
2.2.7.2. Ash Determination
Two grams of sample delicate was put on the porcelain dish that its constant mass had been known before. After that it was dusted at 550o C for 3-5 hours. And then sample was cooled in the oven chamber for 24 hours. Sample was put in the desiccators for 15 min; later the sample was weighed and continued by the mass determination until it got the constant weight. Ash content was determined by this formula:
x100% (g) mass sample wet (g) left dust mass basist) (wet content Ash % =
(Sudarmadji et al., 1989)
2.2.7.3. Protein Content Determination
Protein content was determined by Kjeldahl procedure with three basic steps, destruction, distillation, and titration. For destruction steps 0.25 sample was added into gourd and it was added with 7.5 g sodium sulfate; 0.35 g HgO, and 15 ml strong H2SO4
and then continued by heating process for 3 to 4 hours. After cooling, solution was placed into distillation gourd with 100 ml aquadest rinsing. After that 0.2 g Zn, 15 ml Na2S2O3 4%; 50 ml NaOH 50% were added consecutively. Distillation process
continued with preparation of distillate solution reception by adding 50 ml HCl 0.1N into erlenmeyer. Distillation process was stopped when 75 ml distillate solutions reached. For the titration, distillate solutions was added with Methyl Red indicator and then It was titrated by NaOH 0.1 N until reached yellow solution.
%N= x100%
1000 x (g) mass sample 14.008 x NaOH N x samples) -(blank NaOH vol
% Protein = % N x conversion factor
The conversion factor of nitrogen to protein was 6.25. (Sudarmadji et al., 1989)
2.2.7.4. Fat Content Determination
Fat content was determined by soxhlet procedure. Firstly a 2 grams sample which has been dried was weighted, and then the sample was wrapped with filter paper that its
28
constant mass had been known before. Later, samples were placed in soxhlet gourd. Eter as the solvent was added fulfill 1/3 part of gourd and then continued with extraction process for 4 hours. After that sample was dried in oven chamber and sample was weighed at the constant weight. The fat content was determined based on this formula:
Residual fat (g) = (filter paper + dried sample) (g) – (empty filter paper) (g)
100% x samples wet of mass the fat extracted of mass the basist) (wet content Fat =
(Sudarmadji et al., 1989).
2.2.7.5. Carbohydrates Content Determination
Carbohydrates content was counted with by difference principle, with formula: % carbohydrates = 100 % - (% moisture content + % protein + % fat + % ash). (Sudarmadji et al., 1989)
2.2.7.6. Fiber Content Determination
Sample that it’s fat had been extracted, antifoam and 200 ml H2SO4 0.25 N were added
into Erlenmeyer. After that it was boiled for 30 min. The residual component formed was filtered and rinsed with hot aquadest. Residual component formed back was put into Erlenmeyer and it was added with 200 ml NaOH 0.25 N and continued with boiling process for 30 min. After that the residual component was filtered with filter paper that its mass had been known before. The residual component on the filter paper was washed with K2SO4 10% and alcohol 95%. Filter paper was dried in the oven chamber and then
it was put in the desiccators for 15 min, later it was weighed. Fiber content was determined by this formula:
Residual mass = fiber mass
x100% (g) mass sample beginning (g) fiber of mass fiber % =
2.2.8. Statistical Data Analysis
The effect of hydrocolloids on dough rheology and physical properties in gluten free bread formulation by cassava flour was investigated based on the analysis with General
29
Linear Mode (One Way) ANOVA using Statistical Package for Social Science for Windows (SPSS) version 13.0 for windows software.
30
3.
RESULTS
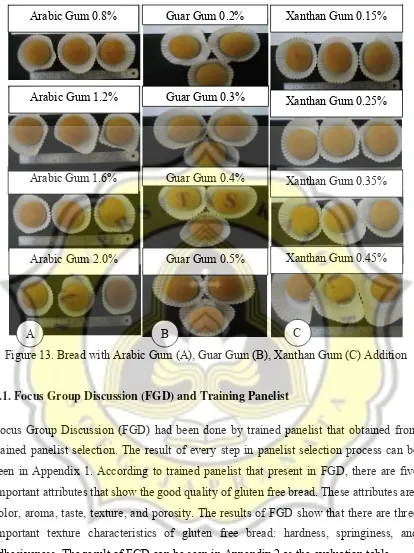
Gluten Free Bread used in this research had been made with different ingredient formulations by adding three kinds of hydrocolloid compounds with four different concentration level, which were: arabic gum (0.8%, 1.2%, 1.6%, and 2.0%); guar gum (0.2%, 0.3%, 0.4%, and 0.5%); and xanthan gum (0.15%, 0.25%, 0.35%, and 0.45%). In general, gluten free bread produced from all formulation did not show differences in size and color. The all samples produced by each formulation of hydrocolloids can be seen in Figure13. All samples then sensory analyzed using intensity scale test done by trained panelists based on bread quality testing attribute from Focus Group Discussion result. From this intensity test rating result, it shows two concentration levels from each hydrocolloids in gluten free bread formulation that can produce the best bread quality based on the appraisal of trained panelists. The best six sample formula furthermore were analyzed using physical test (dough volume measurement, bread volume measurement, baking loss measurement, and bread texture measurement using texture analyzer), chemical test (moisture content measurement), and sensory test (ranking hedonic test). The best quality of gluten free bread, as the result from physical, chemical, and consumer acceptance tests, then was tested to reveal the content of ash, protein, fat, carbohydrate, and fiber to analyze the nutrition content. The whole results in this research can be seen in the next details.
31
Figure 13. Bread with Arabic Gum (A), Guar Gum (B), Xanthan Gum (C) Addition
3.1. Focus Group Discussion (FGD) and Training Panelist
Focus Group Discussion (FGD) had been done by trained panelist that obtained from trained panelist selection. The result of every step in panelist selection process can be seen in Appendix 1. According to trained panelist that present in FGD, there are five important attributes that show the good quality of gluten free bread. These attributes are: color, aroma, taste, texture, and porosity. The results of FGD show that there are three important texture characteristics of gluten free bread: hardness, springiness, and adhesiveness. The result of FGD can be seen in Appendix 2 as the evaluation table.
3.2. Sensory Analysis
3.2.1. Intensity Rating Test by Trained Panelist
The result of sensory analysis by using intensity rating test of all samples of gluten free bread can be seen in Table 6, while the sensory figure can be seen in Figure 10 and 13.
Guar Gum 0.2%
Guar Gum 0.3%
Guar Gum 0.4%
Guar Gum 0.5% Arabic Gum 0.8%
Arabic Gum 1.6%
Arabic Gum 2.0% Arabic Gum 1.2%
Xanthan Gum 0.15%
Xanthan Gum 0.25%
Xanthan Gum 0.35%
Xanthan Gum 0.45%
C B
A
32
Intensity rating test had been done with the purpose to get two samples from each hydrocolloid types formulations based on intensity appraisal of color, aroma, porosity, hardness, springiness, and adhesiveness with a given scale. This intensity rating test method may use the same intensity value for different samples. Score sheet used in intensity rating test and the list of trained panelist can be seen in Appendix 3.
The application of each types of hydrocolloid in gluten free bread formulation in this research was using 4 different level of concentration. From Table 6 it can be seen that the usage of arabic gum with 0.8% and 1.2% concentration had produced highest score frequency of gluten free bread, higher than other 2 concentration level in entire testing attributes.
In the application of guar gum, it can be known that 0.2% and 0.3% concentration level had more often frequency in highest score in all testing attributes. On the other hand, different with other two hydrocolloid types, which produced gluten free bread with highest score using 2 lowest concentration; The application of xanthan gum with highest score and highest frequency is the one that using xanthan gum in 0.15% and 0.35% concentration level. From the entire sensory results it appears that low hydrocolloid concentration level in gluten free bread formulation will produce higher intensity score, especially in color, aroma, and taste attribute.
33
Table 6. Average Score of Intensity Rating Test in Gluten Free Bread
Sample Color Aroma Porosity Hardness Springiness Adhesiveness Taste
Arabic Gum 0.8% 4.00∗ 4.33∗ 4.00∗ 4.44 3.78∗ 3.67∗ 4.33∗
Arabic Gum 1.2% 3.89∗ 4.44∗ 3.44 4.89∗ 3.56 3.11 4.44∗
Arabic Gum 1.6% 3.89 3.78 4.11∗ 4.33 4.00∗ 3.44 4.00
Arabic Gum 2,0% 4.11 3.89 3.00 5.11∗ 3.33 3.89∗ 4.44
Guar Gum 0.2% 3.78∗ 4.11∗ 4.56∗ 4.22 4.11∗ 4.44∗ 4.33∗
Guar Gum 0.3% 4.11∗ 3.56 4.22 4.67∗ 4.00∗ 4.44∗ 4.11∗
Guar Gum 0.4% 3.56 4.11∗ 4.33∗ 4.56∗ 3.89 4.33 4.00
Guar Gum 0.5% 3.78 3.44 3.56 4.56 3.89 4.11 3.56
Xanthan Gum 0.15% 3.56 4.11∗ 3.56 4.56∗ 4.22∗ 4.00∗ 3.56
Xanthan Gum 0.25% 3.89∗ 3.89∗ 4.00 4.33 3.89∗ 3.78 3.67
Xanthan Gum 0.35% 3.89∗ 3.78 4.44∗ 4.44∗ 3.89 3.89∗ 4.00∗
Xanthan Gum 0.45% 3.33 3.44 4.67∗ 4,22 3.67 3.78 4.11∗
Notes:
• All of the values are the average score from 9 panelist
• Value with ∗ show the first and second rank of intensity score for each hydrocolloid
• Score Color Aroma Porosity Hardness Springiness Adhesiveness Taste 1 Not bright (dark) Not strong (very weak) Not uniformed (Very) Hard Not springy Not adhesive Not sweet
2 Rather bright Rather strong Rather uniformed Rather Soft Rather springy Rather adhesive Rather sweet 3 Not bright enough
Not strong enough Not uniformed enough
Not Soft enough Not springy enough Not adhesive enough
Not sweet enough 4 Bright enough Strong enough Uniformed enough Soft Enough springy enough Adhesive
enough
Sweet enough 5 Bright Strong Uniformed Soft springy (spring,
resilient, bouncy)
Adhesive Sweet 6 Very bright Very strong Very uniformed Very soft Very springy Very Adhesive Very sweet
34
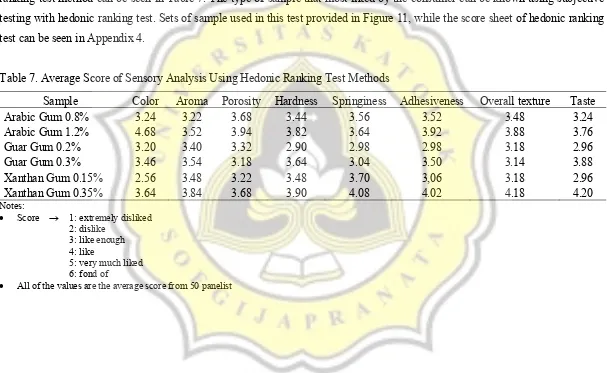
3.2.2. Hedonic Ranking Test
The result of consumer’s acceptance level toward 6 samples of gluten free bread based on consumer liking test with hedonic
ranking test method can be seen in Table 7. The type of sample that most liked by the consumer can be known using subjective
testing with hedonic ranking test. Sets of sample used in this test provided in Figure 11, while the score sheet of hedonic ranking
test can be seen in Appendix 4.
Table 7. Average Score of Sensory Analysis Using Hedonic Ranking Test Methods
Sample Color Aroma Porosity Hardness Springiness Adhesiveness Overall texture Taste
Arabic Gum 0.8% 3.24 3.22 3.68 3.44 3.56 3.52 3.48 3.24
Arabic Gum 1.2% 4.68 3.52 3.94 3.82 3.64 3.92 3.88 3.76
Guar Gum 0.2% 3.20 3.40 3.32 2.90 2.98 2.98 3.18 2.96
Guar Gum 0.3% 3.46 3.54 3.18 3.64 3.04 3.50 3.14 3.88
Xanthan Gum 0.15% 2.56 3.48 3.22 3.48 3.70 3,06 3.18 2.96
Xanthan Gum 0.35% 3.64 3.84 3.68 3.90 4.08 4.02 4.18 4.20
Notes:
• Score → 1: extremely disliked 2: dislike
3: like enough
4: like
5: very much liked 6: fond of
• All of the values are the average score from 50 panelist
35
Table 7 shows the respondent’s preference level toward color, aroma, porosity, hardness,
springiness, adhesiveness, and taste attribute in 6 samples of gluten free bread. The test
result shows that gluten free bread formulation using 0.35% hydrocolloid xanthan gum
produces a product with highest consumer’s liking in aroma (3.84), hardness (3.9),
springiness (4.08), adhesiveness (4.02), overall texture (4.18), and taste (4.2) attribute. In
color attribute, the highest average score is 4.68, which produced by adding arabic gum
hydrocolloid 1.2% and also xanthan gum 0.35% with average score 3.64. In porosity level,
the average score by adding xanthan gum 0.35% is only on the second position after the
sample with arabic gum 1.2% which has the highest score. In the data analysis using
Kruskal-Wallis test, it is known that average score difference in porosity attribute in whole
samples shows results that has no significant difference (sign >0.05) (See Appendix 8). It
can be concluded that gluten free bread sample with 0.35% xanthan gum hydrocolloid
formulation is the consumer’s most preferable sample with highest score in almost all
testing attribute in consumer liking test.
Figure 14. Sensory Analysis for Color of Gluten Free Bread 0,00
0,50 1,00 1,50 2,00 2,50 3,00 3,50 4,00 4,50 5,00
Color
aver
ag
e sco
re
Arabic gum 0.8% Arabic Gum 1.2% Guar Gum 0.2% Guar Gum 0.3% Xanthan Gum 0.15% Xanthan Gum 0.35%
36
Figure 14 indicates that the addition of hydrocolloids at different kind and concentration
level will make an effect in consumer’s preference of gluten free bread color characteristic.
The most liked color is the gluten free bread with the arabic gum 1.2% addition, followed
by xanthan gum 0.35%, guar gum 0.3%, arabic gum 0.8%, guar gum 0.2% and the most
disliked is xanthan gum 0.15%. It can be concluded that the hydrocolloid application in
higher concentration is more preferred by the consumer. From the usage of these three
types of hydrocolloid, it can be concluded that the average score will rise by using higher
concentration level of hydrocolloid.
Figure 15. Sensory Analysis for Aroma of Gluten Free Bread
Figure 15 indicates that the aroma which is most liked is the gluten free bread with addition
of xanthan gum 0.35% followed by guar gum 0.3%, arabic gum 1.2%, xanthan gum 0.15%,
guar gum 0.2%, and the most disliked is arab gum 0.8%. It can be concluded that the
hydrocolloid application in higher concentration is more preferred by the consumer,
compared with those which using low concentration level. From the use of these three types
of hydrocolloid, it can be concluded that the average score will get higher if hydrocolloid
with higher concentration level is used. 2,90
3,00 3,10 3,20 3,30 3,40 3,50 3,60 3,70 3,80 3,90
Aroma
aver
ag
e sco
re
Arabic gum 0.8% Arabic Gum 1.2% Guar Gum 0.2% Guar Gum 0.3% Xanthan Gum 0.15% Xanthan Gum 0.35%
37
Figure 16. Sensory Analysis for Porosity of Gluten Free Bread
Figure 16 indicates that the porosity which is most liked is the gluten free bread with
addition of arabic gum 1.2% followed by arabic gum 0.8%, xanthan gum 0.35%, xanthan
gum 0.15%, guar gum 0.2%, and the most disliked is guar gum 0.3%. It can be concluded
that the application of arab gum hydrocolloid, in a sensory manner, produces most liked
porosity characteristic, while guar gum produces most disliked porosity characteristic.
From the use of these three types of hydrocolloid, it can be concluded that the one in higher
concentration is more preferable than the low level one. It is showed by the increasing
average score in the use of higher concentration of hydrocolloid. 0,00
0,50 1,00 1,50 2,00 2,50 3,00 3,50 4,00 4,50
Porosity
aver
ag
e sco
re
Arabic gum 0.8% Arabic Gum 1.2% Guar Gum 0.2% Guar Gum 0.3% Xanthan Gum 0.15% Xanthan Gum 0.35%
38
Figure 17. Sensory Analysis for Hardness of Gluten Free Bread
Figure 17 indicates that the hardness which is most liked is the gluten free bread with
addition xanthan gum 0.35% followed by arabic gum 1.2% %, guar gum 0.3%, xanthan
gum 0.15, arabic gum 0.8%, and the most disliked is guar gum 0.2%. It still can be
concluded that the application of xanthan gum produces the most preferable hardness
characteristic, while the one with guar gum Hydrocolloid produces most disliked hardness
characteristic. Besides, from the use of three types of hydrocolloids, it can be concluded
that higher concentration, in a sensory manner, produces gluten free bread with more
preferable hardness characteristic better than the low one. It is showed by the increasing of
average score in the use of higher concentration level of hydrocolloid. 0,00
0,50 1,00 1,50 2,00 2,50 3,00 3,50 4,00 4,50
Hardness
aver
ag
e sco
re
Arabic gum 0.8% Arabic Gum 1.2% Guar Gum 0.2% Guar Gum 0.3% Xanthan Gum 0.15% Xanthan Gum 0.35%
39
Figure 18. Sensory Analysis for Springiness of Gluten Free Bread
Figure 18 indicates that the springiness which is most liked is the gluten free bread with
addition xanthan gum 0.35% followed by xanthan gum 0.15, arabic gum 1.2% %, arabic
gum 0.8%, guar gum 0.3%, and the most disliked is guar gum 0.2%. It still can be
concluded that the application of xanthan gum hydrocolloid produces the most liked
springiness characteristic, while the one with guar gum hydrocolloid produces most
disliked springiness characteristic. Besides, from the use of three types of hydrocolloids, it
can be concluded that higher concentration, in a sensory manner, produces gluten free
bread with a more preferable springiness characteristic better than the low one. It is showed
by the increasing average score in the use of higher concentration level of hydrocolloid. 0,00
0,50 1,00 1,50 2,00 2,50 3,00 3,50 4,00 4,50
Springiness
aver
ag
e sco
re
Arabic gum 0.8% Arabic Gum 1.2% Guar Gum 0.2% Guar Gum 0.3% Xanthan Gum 0.15% Xanthan Gum 0.35%
40
Figure 19. Sensory Analysis for Adhesiveness of Gluten Free Bread
Figure 19 indicates that the adhesiveness which is most liked is the gluten free bread with
addition of xanthan gum 0.35% followed by arabic gum 1.2%, guar gum 0.3%, arabic gum
0.8%, xanthan gum 0.15%, and the most disliked is guar gum 0.2%. It still can be
concluded that the application of higher hydrocolloid concentration, in a sensory manner, is
more preferable by the consumer better than the low level one. From the use of three types
of hydrocolloid, it can be noticed that average score is increased in higher hydrocolloid
concentration. 0,00 0,50 1,00 1,50 2,00 2,50 3,00 3,50 4,00 4,50
Adhesiveness
aver
ag
e sco
re
Arabic gum 0.8% Arabic Gum 1.2% Guar Gum 0.2% Guar Gum 0.3% Xanthan Gum 0.15% Xanthan Gum 0.35%
41
Figure 20. Sensory Analysis for Overall Texture of Gluten Free Bread
Figure 20 indicates that the overall texture which is most liked is the gluten free bread with
addition xanthan gum 0.35% followed by arabic gum 1.2%, guar gum 0.2%, arabic gum
0.8%, and the most disliked are xanthan gum 0.15% and guar gum 0.3%. It still can be
concluded that the application of hydrocolloid in higher concentration, in a sensory manner,
is more preferable by the consumer, with a higher average score, compared to the low level
one.
0,00 0,50 1,00 1,50 2,00 2,50 3,00 3,50 4,00 4,50
Overall texture
aver
ag
e sco
re
Arabic gum 0.8% Arabic Gum 1.2% Guar Gum 0.2% Guar Gum 0.3% Xanthan Gum 0.15% Xanthan Gum 0.35%
42
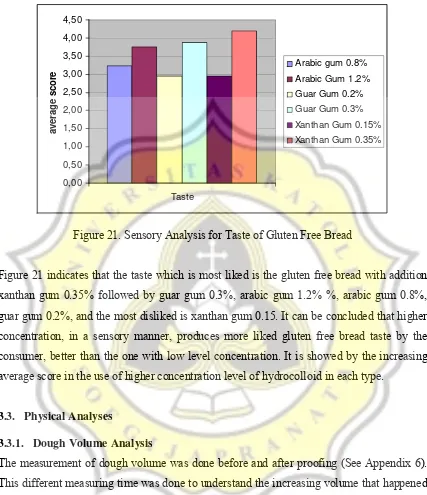
Figure 21. Sensory Analysis for Taste of Gluten Free Bread
Figure 21 indicates that the taste which is most liked is the gluten free bread with addition
xanthan gum 0.35% followed by guar gum 0.3%, arabic gum 1.2% %, arabic gum 0.8%,
guar gum 0.2%, and the most disliked is xanthan gum 0.15. It can be concluded that higher
concentration, in a sensory manner, produces more liked gluten free bread taste by the
consumer, better than the one with low level concentration. It is showed by the increasing
average score in the use of higher concentration level of hydrocolloid in each type.
3.3. Physical Analyses
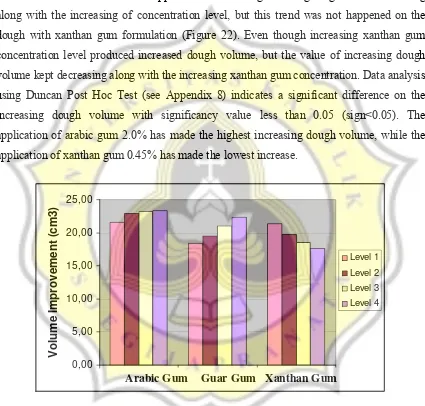
3.3.1. Dough Volume Analysis
The measurement of dough volume was done before and after proofing (See Appendix 6).
This different measuring time was done to understand the increasing volume that happened
on the dough, with the application of different hydrocolloid types and concentration in the
gluten free bread formulation by the proofing process that existed for 60 min at 40oC with 95% relative humidity inside the proofing chamber. The result of dough volume
measurement before and after proofing can be seen in Table 8. Also, the increasing dough
volume can be seen in Figure 22. 0,00
0,50 1,00 1,50 2,00 2,50 3,00 3,50 4,00 4,50
Taste
aver
ag
e sco
re
Arabic gum 0.8% Arabic Gum 1.2% Guar Gum 0.2% Guar Gum 0.3% Xanthan Gum 0.15% Xanthan Gum 0.35%
43
0,00 5,00 10,00 15,00 20,00 25,00
1 2 3
V
o
lu
m
e I
m
p
ro
vem
en
t (
cm
3)
Level 1 Level 2 Level 3 Level 4
Table 8 indicates that there was almost no significant difference among every treatment in
the dough volume before proofing. It means that the application of hydrocolloids was not
make an effect on the early step of dough making. Table 8 also points out that dough
volume in whole samples was increased after proofing time. The dough volume in gluten
free bread formulation with the application of arabic gum and guar gum was increasing
along with the increasing of concentration level, but this trend was not happened on the
dough with xanthan gum formulation (Figure 22). Even though increasing xanthan gum
concentration level produced increased dough volume, but the value of increasing dough
volume kept decreasing along with the increasing xanthan gum concentration. Data analysis
using Duncan Post Hoc Test (see Appendix 8) indicates a significant difference on the
increasing dough volume with significancy value less than 0.05 (sign<0.05). The
application of arabic gum 2.0% has made the highest increasing dough volume, while the
application of xanthan gum 0.45% has made the lowest increase.
Figure 22. Dough Volume Improvement Value
Arabic Gum Guar Gum Xanthan Gum
44
19,00 20,00 21,00 22,00 23,00 24,00 25,00 26,00
1 2 3
Hydrocolloid
B
re
a
d
V
o
lu
me
(
c
m3
)
Level 1 Level 2 Level 3 Level 4
3.3.2. Bread Volume Analysis
The volume of gluten free bread in every sample can be seen in Table 8. Table 8 shows
that different treatment results in variance of bread volume. The data that are used to
calculate bread volume by millet seed displacement methods can be seen in Appendix 5.
The increasing arabic gum hydrocolloid concentration produces an increasing bread
volume, even the value is not significantly different at the 95% trust level with significance
level above 0.05 (sign>0.05) (see Appendix 8). The application of guar gum produces an
increase on bread volume along with the increasing volume used. The trend in application
xanthan gum is not the same with what happened to the other two hydrocolloids. The
increasing xanthan gum concentration produces decreasing gluten free bread volume
(Figure 23). Although, compared with other hydrocolloid formulation, the application of
xanthan gum at 0.15% concentration still produced the highest bread volume compared to
all samples, while the addition of arabic gum 0.8% produced the lowest bread volume.
Figure 23. The Volume of Gluten Free Bread
Arabic Gum Guar Gum Xanthan Gum
45
0,00 2,00 4,00 6,00 8,00 10,00 12,00 14,00 16,00 18,00 20,00
1 2 3
hydrocolloid
ba
k
ing
l
os
s
(
%
)
level 1
level 2 level 3 level 4
3.3.3. Baking Loss Measurement
Baking loss measurement is based on the loss amount of mass as the result of baking
process to produce bread. The result of this measurement is affected by the dough mass
after proofing and bread mass. The dough mass after proofing and bread mass data can be
seen in Appendix 7. After proofing process for an hour 40oC with 95% relative humidity inside the proofing chamber, the dough’s were weight measured and then they were baked
for 15 min in an oven at temperature 250oC. After an hour cooling in a room temperature, the bread’s mass was measured. The baking loss was obtained from the dough and bread
mass data. Table 8 shows the result of baking loss measurement.
Table 8 shows that along with increasing concentration of arabic gum and guar gum, the
baking loss value is decreasing. The highest baking loss was resulted from the application
of guar gum 0.2%, while the lowest baking loss value was produced by applying guar gum
0.5%. This trend did not happen in xanthan gum hydrocolloid application, the increase in
xanthan gum concentration is followed by the increasing of baking loss value. However,
the amount of baking loss for every increasing concentration level on each type of
hydrocolloid shows statistically insignificant value difference. The amount of decreasing
baking loss value for every decreasing concentration level at each type of hydrocolloid is
provided in Figure 24.
Figure 24. Baking Loss Value of Gluten Free Bread
Arabic Gum Guar Gum Xanthan Gum
46
Table 8. Dough Volume Improvement, Bread Volume, and Baking Loss of Gluten Free Bread
Sample
Dough Volume (cm3) Dough Volume
Improvement (cm3)
Bread Volume
(cm3) Baking loss (%)
before proofing After proofing
Arabic Gum 0.8% 17,10 ± 0,26a 38,69 1,24cde 21,59 ± 1,33de 21,48 ± 0,37a 17,03 ± 1,22cd Arabic Gum 1.2% 17,18 ± 0,27a 40,05 ± 1,13efg 22,87 ± 1,16ef 21,59 ± 0,46a 16,36 ± 0,60abcd Arabic Gum 1.6% 17,17 ± 0,31a 40,46 ± 1,00fg 23,30 ± 0,77f 21,61 ± 0,44ab 15,47 ± 2,07abc Arabic Gum 2,0% 17,50 ± 0,33abc 40,91 ± 1,19g 23,41 ± 1,50f 22,38 ± 0,64bcd 15,38 ± 1,92abc Guar Gum 0.2% 17,11 ± 0,32a 35,59 ± 1,33a 18,47 ± 1,53ab 21,73 ± 0,84abc 17,87 ± 1,33d Guar Gum 0.3% 17,10 ± 0,34a 36,62 ± 1,22ab 19,52 ± 1,30bc 22,49 ± 0,63cd 15,84 ± 1,15abc Guar Gum 0.4% 17,37 ± 0,59ab 38,40 ± 1,39cd 21,03 ± 1,41cd 23,76 ± 0,83ef 14,84 ± 0,87ab Guar Gum 0