1
Philippe De Vreyer and François Roubaud
Th e population of Sub-Saharan Africa stood at 854 million in 2010 (World Bank 2012a). Annual population growth averaged 2.5 percent, with a relatively high sustained fertility rate, fostered by the fact that two-thirds of the population is under 25. Th e region has the highest proportion of poor people in the world, with 47.5 percent of its population living on less than $1.25 a day, as measured in terms of purchasing power parity in 2008. It is also the only region in which the number of poor is still rising.
Th e eradication of extreme poverty and hunger is at the top of the list of the Millennium Development Goals (MDGs) adopted by the member states of the United Nations (UN) in September 2000. Th is goal comprises three targets: 1. Halve, between 1990 and 2015, the proportion of people whose income is
less than $1 a day.
2. Halve, between 1990 and 2015, the proportion of people who suff er from hunger.
3. Achieve full and productive employment and decent work for all, including women and young people.
Th e three targets are closely linked: monetary poverty is a key factor in mal-nutrition and is determined in large part by access to employment. In 2007, an estimated 55 percent of age women and 79 percent of working-age men in Sub-Saharan African were employed (UN 2008). Th ese rates are slightly higher than the average in developed countries (49 percent of women and 64 percent of men) and developing countries (49 percent of women and 77 percent of men). Th ey thus suggest that lack of access to work is not the main cause of poverty in Africa.
Sub-Saharan Africa has the world’s largest proportion of poor workers. In 2007, before the international fi nancial crisis, 51 percent of employed people lived on less than $1 a day, measured in terms of purchasing power parity. Th e 2007 average for developing countries was 20 percent, representing a sharp drop from 1997, when it stood at 31 percent. Progress in Sub-Saharan Africa was
much slower: in 1997, 56 percent of employed people lived on less than $1 a day. Th ese fi gures suggest that working conditions rather than access to work are behind sustained poverty rates in Sub-Saharan Africa.
Scope and Purpose of the Book
Th is book contributes to knowledge on the functioning of urban labor markets in Sub-Saharan Africa by investigating a variety of questions. Which individuals lack access to employment or are employed beneath their capaci-ties? Does education improve working conditions? What opportunities does the labor market off er to climb the social ladder? Is the lack of good-quality jobs for adults and the poverty it implies one of the reasons for the prevalence of child labor? Do women and ethnic minorities have the same access to the labor market as everyone else? How does the formal sector live alongside the informal sector? What role does migration play in the functioning of labor markets? Are there traits common to all urban labor markets in Africa, or is each country diff erent?
Th is book attempts to answer these questions by studying 11 cities in 10 countries (table O.1). Eight are members of the Communauté Financière Africaine (CFA) Franc Zone, and seven belong to the West African Economic and Monetary Union (WAEMU); all 10 are French speaking. Th ey are thus not representative of Sub-Saharan Africa.1 However, the sample of countries is very
close to the continental average, whatever the economic and social indicator considered.
Comparative studies are oft en based on disparate measurement instruments, which risk marring the validity of the fi ndings.2 Th is study diff ers from earlier
studies in that it is based on a set of perfectly comparable surveys (the 1-2-3 surveys, described below).With the notable exception of a report by the Inter-national Institute for Labor Studies (Lachaud 1994), no other study presents a detailed overview of the labor market landscape in Sub-Saharan Africa. For 10–15 years, no work of this kind was conducted.3 Th e study also covers a
num-ber of topics (migration, child labor, job satisfaction, discrimination, and work aft er retirement) in addition to the topics covered by Lachaud (unemployment, access to employment and mobility, segmentation, labor supply, and poverty). Th is book also draws on more and better-quality data. Th e Network for Labor Market Analysis in Africa (RAMTA) surveys contain only a few hundred obser-vations per country, far fewer than the number of obserobser-vations captured by the 1-2-3 surveys, which survey more than 120,000 people, including 80,000 people of working age and 6,000 unemployed and 50,000 employed workers (table O.2). In addition, the sampling plans adopted by the RAMTA surveys are arguably “quasi-random,” with no updated sampling frame available. Th ese
3 Country Land area (1,000 square kilometers) Population (1,000) Urbanization (percent) GDP (purchasing power parity dollars) GDP growth in 2010 (percent) Net primary enrollment (percent) Life expectancy (years) Poverty headcount (percent)a Institutional Assessment (CPIA) (1–6)b Benin 111 8,850 42 1,590 3.0 94 56 16 3.5 Burkina Faso 274 16,468 20 1,250 9.2 58 55 45 3.5 Cameroon 473 19,600 58 2,270 3.2 92 51 10 2.5
Congo, Dem. Rep. 2,267 65,965 35 320 7.2 64 48 53 2.0
Côte d’Ivoire 318 19,738 50 1,810 3.0 61 55 24 2.0 Madagascar 582 20,714 30 960 1.6 79 66 81 2.5 Mali 1,220 15,370 33 1,030 4.5 62 51 50 3.5 Niger 1,267 15,512 17 720 8.8 57 54 44 3.0 Senegal 193 12,434 43 1,910 4.1 75 59 11 3.0 Togo 54 6,028 43 890 3.4 92 57 11 2.5 Average 676 20,068 37 1,275 5.0 73 55 35 3.0 Sub-Saharan Africa 491 17,780 37 1,188 5.1 75 54 47 2.7
Source: Based on data from World Bank 2011.
Note: Most data are for 2010. Last available year for net primary enrollment rate and poverty headcount are 2007–10 for most countries. Data on net primary enrollment are from 2003 for Madagascar and 2005 for the Democratic Republic of Congo. Poverty headcount data are for 2003 for Benin, 2005 for the Democratic Republic of Congo, and 2006 for Senegal and Togo.
a. The poverty headcount corresponds to the $1.25 purchasing power parity poverty line.
shortcomings—attributable to the pilot nature of the operation—undermine its analytical potential. Although the 1-2-3 surveys used here focus solely on the main cities, their scope is broader than most other household surveys, which have much smaller sample sizes (generally a few thousand observations for the entire country).
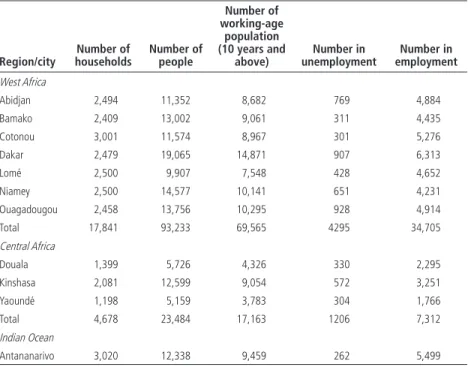
Th is book makes use of only a small fraction of the data in the 1-2-3 surveys. Although a number of surveys have broad coverage (national coverage in Cameroon and the Democratic Republic of Congo, all major urban centers in Madagascar), coverage here is restricted to the main cities, for several reasons. First, the editors believed that it was preferable to achieve homogeneity across countries by choosing the surveys’ highest common denominator (in terms of geographical coverage). Second, rural labor markets were excluded, for theo-retical reasons. Th e questions and analytical instruments used to study peasant farmers in rural Africa are very diff erent from those used in urban settings. Th ird, the time dimension of existing surveys was not used, either in repeated Table O.2 Sample Sizes of African Cities Studied
Region/city Number of households Number of people Number of working-age population (10 years and above) Number in unemployment Number in employment West Africa Abidjan 2,494 11,352 8,682 769 4,884 Bamako 2,409 13,002 9,061 311 4,435 Cotonou 3,001 11,574 8,967 301 5,276 Dakar 2,479 19,065 14,871 907 6,313 Lomé 2,500 9,907 7,548 428 4,652 Niamey 2,500 14,577 10,141 651 4,231 Ouagadougou 2,458 13,756 10,295 928 4,914 Total 17,841 93,233 69,565 4295 34,705 Central Africa Douala 1,399 5,726 4,326 330 2,295 Kinshasa 2,081 12,599 9,054 572 3,251 Yaoundé 1,198 5,159 3,783 304 1,766 Total 4,678 23,484 17,163 1206 7,312 Indian Ocean Antananarivo 3,020 12,338 9,459 262 5,499
Sources: Based on Phase 1 of the following 1-2-3 surveys: Cameroon 2005 (Développement, Institutions et Mondialisation [DIAL] and National Statistics Institute [NSI]); Democratic Republic of Congo 2005 (DIAL and NSI); Madagascar 2001 (DIAL and Institut National de la Statistique [INSTAT]); West African Economic and
Monetary Union (WAEMU) 2001/02 (Observatoire économique et statistique d’Afrique Subsaharienne [AFRISTAT], DIAL, and NSI).
cross–sections or panel data. Fourth, the study was deliberately restricted to Phase 1 of the 1-2-3 survey,which is most closely associated with the labor market.
Two main factors explain the lack of a comparable study to date. Th e fi rst is the dearth of data. Th e second is thechange in policy focus by the development community.
Th e Dearth of Meaningful Data
Although employment is the main source of income for the poor, knowledge of the workings of African labor markets is spotty, giving rise to a number of preconceived—and oft en mistaken—ideas. Despite the universally recognized role of employment as a driver of macroeconomic growth and poverty reduc-tion, information on African labor markets remains sketchy. Many research projects launched on the subject in the last three decades have run into this wall and been unable to produce signifi cant fi ndings. For example, of the 25 chap-ters in Labor Markets and Economic Development (Kanbur and Svejnar 2009), which presents a good overview of the subject, only three concern Sub-Saharan Africa (excluding South Africa).4 Moreover, none of the three chapters is based
on labor force surveys, the main source of data in this fi eld in the rest of the world. Too oft en, labor market studies cover a few hundred formal businesses (concentrated mainly in a few English-speaking African countries), which are themselves nonrepresentative. Th is type of study is unsatisfactory given that the (nonagricultural) informal sector represents 50–80 percent of urban employ-ment, agricultural (and informal sector) employment is the most important type of employment in rural areas, and employment in the formal sector accounts for just a small proportion of total employment in Sub-Saharan Africa.
Th e Regional Program on Enterprise Development (RPED) project and its avatars are symptomatic of this problem. Launched by the World Bank in a dozen Sub-Saharan African countries in the early 1990s, the project consists of matched (employer/employee) multiround surveys of a few hundred businesses in the formal manufacturing sector (Bigsten and Söderbom 2005). Th e project has produced some interesting and original results (Fafchamps and Söderbom 2006; Van Biesebroeck 2007; Nordman and Wolff 2009, to cite but a few recent publications). Th e problem emerges when these fi ndings are used to shed light on the functioning of the labor market as a whole and to determine public poli-cies (Mazumdar and Mazaheri 2002).
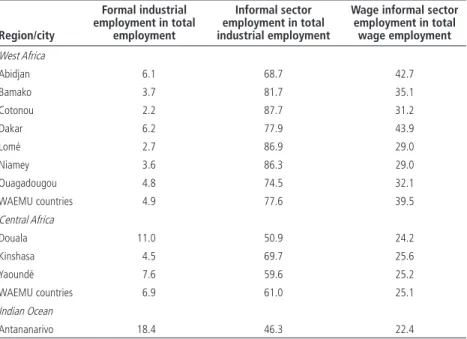
Th e formal manufacturing sector represents just 1–2 percent of total national employment in most Sub-Saharan African countries. Even in the main cities, formal sector industrial employment (including employment in the public sector) accounts for less than 5 percent of total employment (table O.3). In contrast, the informal sector accounts for more than two-thirds of industrial jobs (up to 78 percent in West Africa). Contrary to popular belief, industry in
Sub-Saharan Africa is essentially an informal sector aff air. Even among wage earners, the informal sector accounts for more than a quarter of employment (40 percent in West Africa). Th e rate of wage employment is therefore not a good indicator for capturing formal sector jobs. Comprehensive coverage of the infor-mal sector is vital for understanding urban labor markets in Sub-Saharan Africa.
Th e annual report on employment produced by the International Labour Organization (ILO 2010a, b) shows just how poor the statistics on employment in Sub-Saharan Africa are: for the 1991–2008 period, only 11 of 45 countries were able to estimate the national unemployment rate for at least three years, and 16 countries had no employment statistics at all for the period. No other developing region has such a severe lack of data.
Labor force surveys are a key to understanding households’ economic activi-ties in most countries, mainly in developed countries but also in the developing countries and emerging economies of Latin America, Asia, and North Africa. Sub-Saharan African countries have not adopted this tool (a notable excep-tion is South Africa), for a variety of reasons (Roubaud 1994; Rakotomanana, Ramilison, and Roubaud 2003; Razafi ndrakoto and Roubaud 2003; Brilleau, Ouedraogo, and Roubaud 2005; Razafi ndrakoto, Roubaud, and Torelli 2009). Table O.3 Share of Formal Manufacturing Employment in Selected African Cities
(percent) Region/city Formal industrial employment in total employment Informal sector employment in total industrial employment
Wage informal sector employment in total wage employment West Africa Abidjan 6.1 68.7 42.7 Bamako 3.7 81.7 35.1 Cotonou 2.2 87.7 31.2 Dakar 6.2 77.9 43.9 Lomé 2.7 86.9 29.0 Niamey 3.6 86.3 29.0 Ouagadougou 4.8 74.5 32.1 WAEMU countries 4.9 77.6 39.5 Central Africa Douala 11.0 50.9 24.2 Kinshasa 4.5 69.7 25.6 Yaoundé 7.6 59.6 25.2 WAEMU countries 6.9 61.0 25.1 Indian Ocean Antananarivo 18.4 46.3 22.4
One is the crowding-out eff ect triggered by household surveys of living condi-tions (such as the Living Standards Measurement Study surveys promoted by the World Bank), which occurs when the fi nancial and human resources of national statistics institutes are thin on the ground.
In addition to the dearth of statistical tools, there are conceptual problems caused by the particularities of developing economies’ labor markets. Labor mar-kets in poor countries, especially in Sub-Saharan Africa, diff er from developed countries’ labor markets in terms of their small proportion of wage employment and large proportion of self-employment. Th ese markets are also characterized by apparent segmentation between a formal sector, comprising “modern” busi-nesses known to the public authorities, and an informal sector, comprising “tra-ditional” businesses operating outside of labor law, business law, taxation, and so forth. In addition, worker protection is weak: where unemployment insurance does exist (in a tiny minority of some of the richest countries in Africa), it is reserved for a small proportion of the population working in the formal sector. Few workers pay into a pension or are protected in the event of illness. Public employment agencies are underdeveloped, and the public is largely oblivious to them where they do exist. Job-seekers generally use their families and social networks to fi nd work.
Th e informal sector’s lack of respect for regulations has created some con-fusion between the informal sector and inactivity, blurring the boundary between being in and out of the labor force and partially invalidating the notion of unemployment as defi ned by the ILO. Only 35 percent of employed work-ers in the seven French-speaking countries of WAEMU were wage earnwork-ers in the early 2000s, according to the 1-2-3 surveys (described below). Th e other 65 percent were independent workers who had created their own jobs (as employers or self-account workers) or contributing family workers. More oft en than not, then, fi nding a job in Africa is a matter of drawing on an infor-mal network to build the information and capital needed to start up a sinfor-mall service or trade without a shop. Th e strong tendency in Africa to employ family members means that a signifi cant proportion of employed workers are unpaid contributing family workers, who are hard to classify in the usual way. Another complicating factor is that work in rural areas is characterized by large seasonal fl uctuations, which means that the seven-day reference period generally used to defi ne work is not relevant.
Th e measurement of remuneration is also no easy matter. People who work in the informal sector operate in production units that do not keep accounts. Trying to capture their earnings by asking them how much they earned in the past 30 days will therefore probably not yield reliable information, because the notions of value added and intermediate inputs are hard to defi ne and measure in the case of informal production units. In addition, informal production units experience large business fl uctuations, making annual extrapolation of income
measured over a month risky. For all these reasons, understanding employment in Sub-Saharan Africa calls for the development of a special statistical tool that can home in on the particularities of labor markets on the subcontinent.
Changes in Policy Focus by the Development Community
Th e lack of data is not the only factor explaining the small number of studies on African labor markets. A second factor is the loss of interest by the development community (researchers and decision makers), which turned to new issues at the beginning of the 2000s.
Beginning in the late 1980s, much was written about structural adjustment. During this period, the catalyst behind the focus on labor issues was the World Development Report 1995: Workers in an Integrating World, which examined whether labor markets were too rigid (World Bank 1995). Markets needed to be liberalized, the argument went, by making labor laws (hiring and fi ring pro-cedures, minimum wages, social security, and so forth) more fl exible. Th e pre-1994 devaluation franc zone countries were viewed as bogeymen (Rama 2000).
Labor markets were liberalized, but the expected eff ects—upturns in growth in formal employment and wages—did not materialize (Kingdon, Sandefur, and Teal 2006). African labor markets, scholars concluded, were not so rigid aft er all, and labor regulations were not binding constraints (Teal 2000; AfDB and others 2012). At the time, a few unorthodox economists, in association with the major UN agencies, tried to sound the alarm about the devastating eff ects of structural adjustment and the need for social adjustment (Rodgers 1989; Standing and Tokman 1991), as a local version applied to labor markets of the “adjustment with a human face” advocated by Cornia, Jolly, and Stewart (1987).
At the end of the 1990s, when the structural adjustment rhetoric fi zzled out, the emphasis shift ed from the labor market to poverty, and both inter-national and inter-national development policies focused on poverty reduction (Cling, Razafi ndrakoto, and Roubaud 2003). Rare were the Poverty Reduc-tion Strategy Papers (PRSPs)—the framework in which all naReduc-tional policies (general or specifi c) were supposed to be embedded—that mentioned specifi c employment policies.
Only at the end of the 2000s were the virtues of effi cient labor markets at reducing poverty rediscovered. National employment policies were put in place in some countries, generally without a suitable system to evaluate their impact. Th e international fi nancial crisis of 2008–09, with its disastrous eff ects on employment in the developed countries, has been a catalyst for putting labor markets back at the top of the development agenda. At the international level, the World Development Report 2013:Jobs (World Bank 2012b) and the thematic chapter of the African Economic Outlook 2012 on youth employment (AfDB and others 2012) are important initiatives. Th ere has not, however, been a massive resurgence of studies on employment in Africa, mainly because of the lack of data.
The 1-2-3 Surveys: A Tool for Understanding
Labor Markets in Africa
Th e contributors to this book use a unique series of identical—thus perfectly comparable—1-2-3 surveys conducted simultaneously in the main cities of seven West African countries and a few other countries (Cameroon, the Demo-cratic Republic of Congo, and Madagascar) in the fi rst half of the 2000s (box O.1). Th ey present original, innovative fi ndings on labor markets using best-practice statistical and econometric methods.
Each chapter begins with a detailed presentation of the descriptive statistics used to elucidate a particular aspect of labor market functioning. Compari-sons across locales are conducted. Th e descriptive sections are followed by in-depth analyses of a broad spectrum of issues, ranging from segmentation to job satisfaction.
Phase 1 is specially designed to measure the informal sector and employ-ment. A series of questions identifi es people in the informal sector. Th e ques-tions cover all the criteria contained in the international defi nition (the number of people employed in the business, the diff erent types of registration, and the type of accounts for self-employed workers). Th is information is collected for
B O X O . 1
What Is a 1-2-3 Survey?
The 1-2-3 survey is based on the survey grafting principle. It nests three surveys target-ing different statistical populations: individuals, production units, and households. The survey is based on the principle of a mixed (household/business) modular survey.
Phase 1—an augmented labor force survey—is a survey of household and individ-ual employment, unemployment, and working conditions. It documents and analyzes labor market functioning and serves as a fi lter for Phase 2, in which a representa-tive sample of the heads of the informal production units identifi ed in Phase 1 are interviewed. The Phase 2 survey seeks to measure the main economic and produc-tive characteristics of the production units (production, value added, investment, and fi nancing); the main business development problems encountered; and the kind of support informal sector entrepreneurs want from the public authorities. (Given the characteristics of Phase 2, the survey can also be said to be an employer/employee matched survey.) In Phase 3, a survey on income and expenditure is conducted on a subsample of households selected from Phase 1 to estimate the weight of the formal and informal sectors in household consumption by product and household type. Phase 3 also estimates household standards of living and monetary poverty based on income or expenditure.
both the main job and the second job, making the operational defi nition of the informal sector extremely fl exible, as it can vary depending on the aim of each study (national defi nition, international comparison, or research). Information can be produced on total employment in the informal sector and on the num-ber of informal production units using the status in employment variable. Th e number of informal production units is vital for the selection of a representative sample of informal production units for Phase 2.
Use of this survey means that for the fi rst time ever, informal sector employ-ment and its characteristics can be described on a basis that is compatible with the ILO’s international recommendations (ILO 1993). Th roughout this book, the informal sector is defi ned as including all unincorporated enterprises (household businesses) that are not registered or do not keep formal accounts. Phase 1 provides all the information required to be disaggregated by the insti-tutional sector.
Phase 1 is also a suitable instrument for measuring informal employment (corresponding to unprotected jobs), as defi ned by the ILO (2003). In addition to employment in the informal sector, the questionnaire also measures informal employment in the formal sector, using a set of questions on the type of job protection (type of employment contract, payslip, and benefi ts). Th e Phase 1 questionnaire allows for a certain amount of fl exibility in terms of the informal-ity criteria to be selected in keeping with international recommendations.
Although the focus is on informal employment and the informal sector, Phase 1 also generates classic indicators such as statistics on employment, unemployment, and underemployment. Th ese indicators, especially open unemployment, do not properly measure tensions in African labor markets, however (see chapters 1 and 2).
Phase 1 collects a wide range of information. It is a good instrument for in-depth analysis of earnings and returns to human capital (education and expe-rience); on-the-job training; gender and ethnic discrimination; labor market segmentation; migration; intergenerational mobility; job quality (hours worked, income, bonuses, social security, and so forth); job satisfaction; interaction and neighborhood eff ects; and other characteristics of the informal markets.
Phase 1 has several limitations, however. First, to keep the length of the questionnaire reasonable, it studies few subjects in detail. For example, only a small set of information can usually be collected on the previous job, parents’ job, activities other than the main job and second job, and the income of inac-tive people. In addition, the choice of a reference period for the questions on employment (generally the previous week, in keeping with international stan-dards) is incompatible with the seasonal nature of certain activities (such as agricultural activities). Th is information is especially important when house-holds combine informal and agricultural activities.
Second, dependent workers (employees, contributing family workers, and apprentices) may not know precisely what the legal status of the business they are working for is. Th is problem is serious if the estimation of manpower in the informal sector is based solely on Phase 1. However, the estimate derived from Phase 1 may be corroborated by Phase 2, which directly generates the number of informal workers in each establishment.5
Th ird, measuring earnings in household surveys is a well-known problem: reluctance to declare one’s remuneration (especially at the top of the earnings distribution) and unavailability of book accounts or payslips (especially for informal workers) usually generate measurement errors and create downward biases.
Given these shortcomings, special care was taken to capture income in Phase 1. Labor earnings are associated with each remunerated job. For wage workers, the survey captures their current monthly wage as all nonwage components of remuneration (bonuses, public holidays, social benefi ts, and so forth, in cash or in kind). Unlike usual labor force surveys, Phase 1 captures the earnings of self-employed workers, which correspond to their disposable income (before taxation). National accountants used to call this income mixed income, because it includes returns to both capital and labor. For survey respondents who do not want to declare (or do not know) their precise earnings, a complementary ques-tion asks for brackets of detailed minimum wage ranges. Measurement errors may remain despite these procedures, but robustness checks can be performed using Phase 2 data.
Like all labor force surveys, Phase 1 authorizes the use of proxy respon-dents. Many researchers believe that information obtained in this way is less accurate than information obtained by other means (Blair, Menon, and Bickart 2004; Bardasi and others 2010). For this reason, Phase 1 guidelines recommend avoiding proxy respondent answers whenever possible, in order to limit poten-tial bias. In West Africa, 82 percent of individual interviews are self-response; 75 percent of the proxy respondents are either the household head or his or her spouse (Amegashie and others 2005). Th ese indicators are even higher in Madagascar, where 90 percent of individual interviews are self-response and 82 percent are either the household head or his or her spouse (Rakotomanana, Ramilison, and Roubaud 2003).
This book uses, but does not exhaust, the analytical potential of Phase 1 of the 1-2-3 survey. It concentrates on the surveys conducted in the main cities of seven West African countries (Abidjan, Bamako, Cotonou, Dakar, Lomé, Niamey, and Ouagadougou) in 2001/02 (map 0.1). Some chapters also cover surveys of Antananarivo, Madagascar (2001 and 2004); Douala and Yaoundé, Cameroon (2005); and Kinshasa, Democratic Republic of Congo (2005).
A Brief Survey of Labor Market Theories Applied
to Development
Th is book is about the remuneration, job quality, and allocation of labor across sectors in low-income economies and across economies as a whole—issues that lie at the heart of the earliest models of economic development. Th e theoreti-cal apparatus of development economics includes a number of key models and assumptions that are concerned with labor market functioning and the move-ments of labor across sectors. Th is section briefl y reviews these models in order to set up the theoretical framework that is common to all of the chapters and to describe the methodology adopted.
Th e seminal work of Arthur Lewis (1954) places emphasis on the migration of labor from the agricultural to the industrial sector as a condition for out-put growth. Th is model stands as a milestone in the theoretical development Map O.1 Sites of 1-2-3 Surveys Conducted in Africa
Note: *Surveys used in this book. C = capital city; N = national; U = urban center. BURUNDI CHAD NIGER CONGO TOGO SENEGAL CÔTE D’IVOIRE DEMOCRATIC REPUBLIC OF CONGO MADAGASCAR COMOROS CAMEROON GABON MALI MOROCCO BENIN BURKINA FASO IBRD 39778March 2013 Morocco 1999–2000 Phases 1-2 (N) 2006–07 Phases 1-2 (N) Niger 2002* Phases 1-2-3 (C) 2012 Phase 1–2 (N) Senegal 2002* Phases 1-2-3 (C) Chad 2011 Phases 1-2 (N) Comoros 2011 Phases 1-2 Côte d’Ivoire 2002* Phases 1-2 (C) Gabon
2010 Phases 1-2 (N) Congo2009 Phases 1-2 (N) Togo 2001* Phases 1-2-3 (C) Benin 2001* Phases 1-2-3 (C) 2003–04 Phases 1-2 (U) 2006–11 Phases 1-2-3 (N) Cameroon 1993 Phases 1-2-3 (C) 1994 Phase 1 (C) 2005* Phases 1-2 (N) 2010 Phases 1-2 (N) Mali 2001* Phases 1-2-3 (C) 2004, 2007, 2010 Phase 1 (N) Burkina Faso 2001* Phases 1-2-3 (C) 2006–07 Phases 1-2-3 (N) 2012 Phases 1-2 (N) Burundi 2006 Phases 1-2-3 (C) 2007 Phases 1-2 (U) 2008 Phases 1-3 (U) Congo, Dem. Rep. of 2005* Phases 1-2-3 (N) 2012 Phases 1-2-3 (N)
Madagascar 1995–2010* Phases 1-2-3 (CU) 2012 Phases 1-2 (N)
economics literature, because it is the fi rst to off er a representation of the func-tioning of a “dual” economy. Dual economy models are a subclass of two-sector models of economic growth (Kanbur and McIntosh 1987). Th ey are intended to capture the main features of developing economies in order to enable better analysis of development paths and policies. What distinguishes dual economy models from others is not that they are two-sector models but that there exist asymmetries between sectors in their use of factors or in the way in which factor remuneration is established.
In the Lewis model, land is used in agriculture but not in industry, and capi-tal is used in industry but not in agriculture. Land and capicapi-tal are thus perfectly immobile; equilibrium is reached by the movement of workers between the two sectors.
Th e second asymmetry lies in the assumption that a surplus of labor exists in agriculture that can be reallocated to industry without decreasing the amount of food produced in the economy, because the marginal productivity of labor in agriculture is zero. Wages in the agricultural sector are set according to “conventional norms” rather than marginal products.
Th e Lewis model assumes that the urban labor market always clears, mak-ing involuntary unemployment impossible. Th e model predictions are thus at odds with what is observed in urban areas of low-income countries, which are characterized by high levels of visible and disguised unemployment and a large informal sector that includes small unregistered fi rms and self-employed workers.
Another milestone of development economics, the Harris and Todaro (1970) migration model, explains these features by assuming that agricultural workers’ decision to migrate depends on the diff erence between the prevalent agricul-tural wage and the expected urban wage, which is positively correlated with the wage level in the modern sector and negatively correlated with the unem-ployment rate. Th e model predicts an equilibrium rate of unemployment and is compatible with the existence of a large informal sector with low income levels. Like Lewis’s model, the Harris and Todaro model is dual. Th e wage in the modern sector is assumed to be higher than the market-clearing level, because rigidities can result from labor market legislation (such as minimum wages) or from fi rm rational behavior (the effi cient wage hypothesis [Stiglitz 1974, 1976; Akerlof 1982; Shapiro and Stiglitz 1984] is among the possible explanations). Th e theory of labor market segmentation was born in the early 1970s to explain the challenge of persistent poverty in the affl uent society of the 1960s (Cain 1976). According to this theory, poverty could be best understood in terms of a dual labor market, in which “the poor are confi ned to the secondary labor mar-ket. Eliminating poverty requires that they gain access to primary employment” (Piore 1970, p. 55). Unless segmentation is removed, policies that increase the human capital of the poor are not likely to produce results.
Th is theory pictures the labor market divided into primary and secondary “segments.” Jobs in the primary segment are supposed to be more desirable because they off er higher pay, more promotion possibilities, and better working conditions and are more stable than jobs in the secondary segment. In low-income countries, the secondary segment is oft en identifi ed with the informal sector, which comprises small unregistered fi rms and self-employed workers, whereas the primary segment is composed of registered private fi rms and the public sector. Several explanations have been off ered as to why such segmenta-tion persists. Workers in the secondary labor market could be discriminated against because of their race, gender, or social class. It could also be the case that workers confi ned to the secondary segment develop tastes and attitudes that exacerbate their disadvantaged position (for instance, women preferring to hold part-time jobs in order to dedicate more time to caring and family duties) (Piore 1970; Doeringer and Piore 1971). Segmentation could also result from imperfect capital markets if some occupations require high levels of invest-ment that cannot be supported by people with low initial wealth (Banerjee and Newman 1993). Capital market imperfections may also explain why the infor-mal sector itself is sometimes dual, in the sense that some workers work in the lower tier and others work in the upper tier of the informal sector, into which entry is restricted by human capital and fi nancial capital requirements (Fields 1990, 2010).
Th ese theories challenge the predictions of the human capital theory, which predicts a positive relationship between educational attainment and wages (Becker 1964). Th e presence of discrimination in the labor market goes against the prediction that better-educated workers should receive higher wages and suggests that gender, race, or ethnicity may play prominent roles.
Th e job competition theory makes the assumption that the number of jobs in the primary segment is limited and that workers compete to obtain them. In this competition, employers use screening devices to hire workers based on their trainability and adaptability (Th urow 1972, 1975; Th urow and Lucas 1972). Education may be linked to higher wages and better jobs—not because it provides workers with a higher level of human capital but because it helps employers screen people with the desirable characteristics: only people with the capacities desired by fi rms are able and willing to acquire the signal (in other words, to get educated) (Spence 1973).
Th e theoretical foundations of development economics were at play in the choice of the topics treated in the 14 chapters of this book. Th e contributors take an agnostic view, recognizing that although education and working expe-rience remain the principal determinants of individual earnings, disguised unemployment, segmentation, duality, and discrimination are probably key dimensions of labor markets in urban Africa (indeed, several chapters study these phenomena).
Another important assumption implicit throughout the book is the ratio-nality of individuals—the notion that people choose where to live and where to work by maximizing their utility under constraint. Whenever necessary, the contributors account for the self-selection of individuals into activities, sectors, and markets in their econometric estimations.
Th e development literature is divided over the appropriateness of the “homo economicus” paradigm for studying low-income economies. Th e “formal” school assumes that the laws of economics apply whatever the society’s level of development (Cook 1966; Schneider 1974; see Isaac 2005 for a survey). People everywhere face the same problem of maximizing gains and minimizing losses given their (scarce) resources. Th e “substantivist” school of Karl Polanyi (Polanyi 1957; Dalton 1967) rejects this assumption for peasant societies and societies with low levels of development, in which, they claim, people do not engage in maximizing behavior. Given that this book assumes that people are driven by some sense of maximizing behavior, it might seem that it stands on the formal-ist side of the controversy. In fact, it follows Becker (1962), who argues that the most important dimension in explaining individual behavior lies not in the objective function but rather in the constraints under which decisions are made. In other words, it does not really matter whether individuals are rational in the sense that they engage in maximizing behavior. What is important is the fact that it is not possible to use more resources than those that are available at the time decisions are made.
Th is view is not far from that of Levi-Strauss (2001), who closes the debate between substantivists and formalists by noting that between the two schools of thought
the diff erence is relative, not absolute, in that one can compare the explana-tory power of economic theory to a piston that moves in a cylinder that is sometimes a bit larger and sometime much larger than it. Even in the best case, the piston never perfectly adheres to the surface and lets a minimum quantity of energy escape or, in the case of economic theory, information that is lacking in order to allow a complete understanding of the society in purely economic terms (authors’ translation).
Th is book testifi es to the soundness of Levi-Strauss’s view.
Overview of Main Findings
Th is book is divided into fi ve parts. Part I provides a comparative analysis of urban labor markets in Sub-Saharan Africa. Composed of a single chapter, it provides a descriptive overview and presents the main stylized facts investigated throughout the book. Part II focuses on job quality and labor market conditions
(unemployment and underemployment, vulnerability, job satisfaction). Part III explores the many dimensions of labor market inequalities. Th is multifaceted issue is examined through various lenses, including returns to education, labor market segmentation, intergenerational mobility, time-related inequality, and gender and ethnic discrimination in earnings. Part IV addresses some key cop-ing mechanisms and private responses, with a focus on migration, child labor, and activity in old age. It examines migration from diff erent angles. In particu-lar, it considers for the fi rst time the determinants of subregional migration (within West Africa) and the performance of returning migrants. Part V identi-fi es the way forward. It stresses three promising avenues for the labor market research agenda: employment and the informal sector in relation to poverty, the microeconomic and macroeconomic dynamics of the labor market, and the impact of public policies. It also advocates for urgently addressing the data challenge.
Given the richness and complexity of the chapters, synthesizing the main results is diffi cult. Two lenses are adopted: a macro perspective, in which coun-try specifi cities are explored, and a micro perspective, in which the heterogene-ity at the level of the individual is taken into account.
Th e Macro Level: Labor Market Homogeneity and Heterogeneity in Africa
Determining whether labor markets are homogeneous or heterogeneous has important policy implications. If the diff erences between countries are mar-ginal, policies for improving the way they function will be similar. If the diff er-ences are signifi cant, policies will have to be tailored to local situations.
Homogeneity of urban labor markets in Africa. Urban labor markets in Africa are surprisingly homogeneous (the consistency of the results is a good indi-rect indicator of the quality of the surveys). Despite increases in school enroll-ment rates, Africa’s working-age population is low skilled. Th e average years of schooling (seven) in the countries studied is more or less the same as the level in France in 1913; in West Africa, the average is comparable to the level in the United Kingdom in 1870 (Maddison 1995).
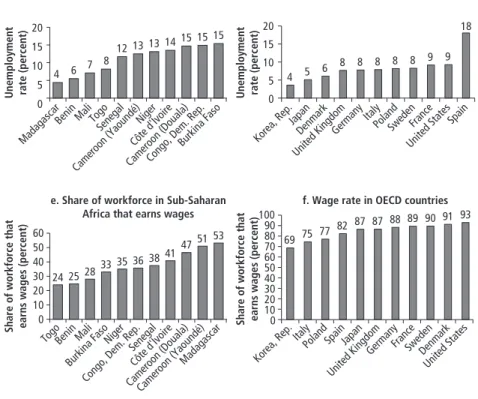
Unemployment rates (about 10 percent) are similar to the rates observed in developed countries (albeit at the high end of the scale). Unlike in developed countries, however, unemployment rates tend to rise with the level of educa-tion (falling off at university level only in certain countries), a feature shared by North African countries (AfDB and others 2012). Th is fi nding would appear to bear out the “luxury unemployment” hypothesis that in the absence of unem-ployment benefi ts, the very poor cannot aff ord to be unemployed. Underem-ployment, rather than unemUnderem-ployment, is the main adjustment variable between labor supply and demand.
One of the main features of urban labor markets in Sub-Saharan Africa is the importance of the informal sector (which employs about 70 percent of all workers) and its corollary, the low rate of wage employment (the correlation coeffi cient between the two indicators is –0.93, signifi cant at the 1 percent level). Excluding agriculture, nowhere else in the world are wage employment rates as low as in Africa, no matter how far back the historical series go (Marchand and Th élot 1997). In 1851, for example, the wage employment rate was 60 percent in France—well above the less than 40 percent in the African countries covered in this book. Moreover, this gap is hugely underestimated, as the surveys cover only the main cities, where wage employment is highest. Wage employment rates in France (and in developed countries in general) quickly shot up to more than 80 percent. A similar trend has not occurred in Africa, where the particu-larly rapid urban transition has not been accompanied by a shift to nonagri-cultural wage employment and workers who enter the informal sector tend to get stuck there (although there is some nonnegligible movement between the formal and informal sectors). Labor market theories and instruments developed by labor economists for the industrial world are thus totally unsuited to analyz-ing Africa, even its urban areas.
Heterogeneity of urban labor markets in Africa. Urban labor markets in Sub-Saharan Africa also display a great deal of heterogeneity (fi gure O.1). Diff er-ences are at least as great as in the countries of the Organisation for Economic Co-operation and Development (OECD). Labor force participation rates are 43 percent in Kinshasa and 68 percent in Lomé. Observed unemployment rates are 4.4 percent in Antananarivo and 15.4 percent in Ouagadougou. Time-related underemployment rates are 9.9 percent in Yaoundé and 19.6 percent in Kinshasa, and invisible underemployment rates range from 37.1 percent, in Douala to 66.6 percent in Ouagadougou.6 Th e informal sector accounts for
53 percent of jobs in Antananarivo and 81 percent in Lomé. Wage employment rates are 24 percent in Lomé and Cotonou and 53 percent in Antananarivo. Even the generally low rate of public employment for all countries (compared with developed countries)—a mark of chronic underadministration—ranges from less than 7 percent in Douala and Abidjan to 17 percent in Kinshasa and Yaoundé, indicating wide diff erences even within the same country. Multiple jobholding rates range from 4 percent in Dakar to 14 percent in Douala and Yaoundé. Earnings levels range from €20 a month in Kinshasa and €30 in Lomé to €110 in Abidjan and Yaoundé. Th e formal/informal earnings gap also diff ers widely across cities, with a ratio in favor of the formal sector of 1.8 times in Antananarivo and Kinshasa and 4.2 in Abidjan and Ouagadougou. Gini coef-fi cients range from 0.53 in Antananarivo to 0.62 in Abidjan, Bamako, Cotonou, and Kinshasa and 0.64 in Ouagadougou. Th e economic policy implications are clear: even in countries arguably as comparable as the ones examined here, a one-size-fi ts-all solution is not going to work.
Figure O.1 Key Urban Labor Market Indicators in Sub-Saharan African and OECD Countries 4349 51 52 56 58 60 60 61 65 68 0 10 20 30 40
Activity rate (percent)
Share of workforce that earns wages (percent)
Unemployment rate (percent) Unemployment rate (percent)
Activity rate (percent)
Share of workforce that earns wages (percent)
50 60 70 80
Congo, Dem. Rep. Niger
SenegalMali
Cameroon (Yaoundé) Burkina FasoMadagascar
Benin Cameroon (Douala) Côte d'Ivoire Côte d'Ivoire Togo 63 64 69 70 73 76 77 77 81 81 81 0 10 20 30 40 50 60 70 80 Italy Poland Korea, Rep. FranceSpain United States Germany United Kingdom
DenmarkSwedenJapan
4 6 7 8 12 13 1314 15 15 15 0 5 10 15 20 Madagascar
Benin MaliTogoSenegal
Cameroon (Yaoundé) Niger
Cameroon (Douala)Congo, Dem. Rep. Burkina Faso 4 5 6 8 8 8 8 8 9 9 18 0 5 10 15 20 Korea, Rep. Japan Denmark United Kingdom Germany Italy PolandSwedenFrance United States Spain 24 2528 33 35 3638 41 4751 53 0 10 20 30 40 50 60 TogoBenin Mali Burkina Faso Niger
Congo, Dem. Rep. Senegal
Côte d'Ivoire Cameroon (Douala)Cameroon (Yaoundé)
Madagascar 82 69 75 77 87 87 88 89 90 91 93 0 10 20 30 40 50 60 70 80 90 100 Korea, Rep. Italy PolandSpainJapan United Kingdom
GermanyFranceSwedenDenmark United States
a. Activity rate in Sub-Saharan Africa b. Activity rate in OECD countries
c. Unemployment rate in Sub-Saharan Africa d. Unemployment rate in OECD countries
e. Share of workforce in Sub-Saharan Africa that earns wages
f. Wage rate in OECD countries
It is diffi cult to produce a straightforward typology of labor markets; no simple explanatory model seems to withstand examination of the empirical results. A detailed econometric analysis is inappropriate because of the small number of observation points (11, each corresponding to one city). Analysis of the correlation matrix for some key indicators does reveal the diversity and complexity of the confi gurations, however (see table O.3). Th e proposed typol-ogy of Teal (2000), which includes three archetypes and is based on just three countries (Ethiopia, Ghana, and South Africa), is also much too simplistic. For example, the correlation between unemployment and employment rates in the informal sector is not signifi cantly diff erent from zero (–0.07, not statistically Sources: Panels a, c, e, g, i based on Phase 1 of the 1-2-3 surveys of selected countries (see table O.1 for details); panels b, d, f, h, j, ILO 2012.
Note: OECD = Organisation for Economic Co-operation and Development.
Monthly earnings (euros)
Gini index
Monthly earnings (euros)
Gini index
g. Monthly earnings in Sub-Saharan Africa h. Monthly earnings in OECD countries
i. Gini index of monthly earnings in Sub-Saharan Africa
j. Gini index of monthly earnings in OECD countries 21 3952 56 57 6978 8999 108 111 0 20 40 60 80 100 120
Congo, Dem. Rep. Togo Madagascar Benin Burkina Faso Niger Mali Senegal Cameroon (Douala) Côte d'Ivoire Cameroon (Yaoundé) 886 1532 2274 2358 24282736 2939295129633223 4335 0 500 1,000 1,500 2,000 2,500 3,000 3,500 4,000 4,500 5,000 Poland Korea, Rep. Spain ItalyJapan GermanySwedenFrance United States United Kingdom Denmark 0.530.580.58 0.590.610.61 0.61 0.62 0.620.62 0.64 0 0.1 0.2 0.3 0.4 0.5 0.6 0.7 Madagascar
Cameroon (Yaoundé)Cameroon (Douala)
SenegalNiger TogoBenin Côte d'Ivoire
Mali
Congo, Dem. Rep. Burkina Faso 0.23 0.230.28 0.30 0.31 0.32 0.320.34 0.35 0.37 0.38 0 0.05 0.10 0.15 0.20 0.25 0.30 0.35 0.40 0.45
DenmarkSwedenFranceGermany Korea, Rep. SpainJapan United Kingdom Italy Poland United States Figure O.1 (continued)
signifi cant), suggesting that there is no easy trade-off between the two, as the mismatch between (formal) labor supply and demand is expressed by either unemployment or the expansion of the informal sector.
A few interesting conclusions can be drawn from table O.4 (although the small number of observations calls for caution, and causal links cannot be estab-lished). First, the participation rate is negatively correlated with the unemploy-ment rate (–0.33, not statistically signifi cant) and the extended unemployunemploy-ment rate (–0.63, signifi cant at the 10 percent level). Th e quantity of labor is thus not constant, and a large labor supply is not associated with higher unemploy-ment—far from it. Th e quantity of labor is also not associated with employment in the informal sector (the correlation between the two phenomena is not sig-nifi cant). However, as public jobs are rationed, a high labor force participation rate is associated with a low public employment rate (–0.67, signifi cant at the 5 percent level). With respect to unemployment, although the two measures used (the ILO defi nition and extended unemployment) display huge diff erences in levels (see chapter 1), they are very closely correlated (0.88, signifi cant at the 1 percent level). However, there are no links between the diff erent forms of underemployment (unemployment and time-related and invisible under-employment). Th ese phenomena are therefore independent manifestations of the mismatch between supply and demand. A high unemployment rate is not associated with a low rate of informal sector employment or a high reservation wage among the unemployed (see chapter 1).
With respect to job structure, the share of informal sector employment is logically inversely proportional to the wage employment share (–0.93, signifi cant at the 1 percent level), even though the informal sector represents a large per-centage of wage earners. Th e relations with the public employment share (–0.36) and the industrial employment share (–0.43) are negative but not statistically signifi cant. However, the multiple jobholding rate falls very signifi cantly with the presence of the informal sector (–0.81, signifi cant at the 1 percent level), high-lighting the narrow room for maneuvering (especially in terms of time) freed up by this sector. Th e higher the share of employment in the informal sector, the lower the earnings (–0.25, not statistically signifi cant); the more widespread invisible underemployment (0.69, signifi cant at the 5 percent level); and the wider the gaps between formal and informal sector earnings (0.49, not statisti-cally signifi cant) and male and female earnings (0.73, signifi cant at the 1 percent level). Th e relations between these features of the labor markets are refl ected by higher levels of inequality in earned income (the correlation with the Gini coef-fi cient of 0.80 is signicoef-fi cant at the 1 percent level). Th e inverse relation is found for the wage employment rate, which is negatively related to the earnings gap by gender and institutional sector and to inequality but is positively related to the multiple jobholding rate. Finally, the higher the invisible underemployment rate, the higher the inequality (0.56, signifi cant at the 10 percent level).
21
Participation rate (PR) 1 Unemployment rate ILO (UR1) –0.33 1 Unemployment rate extended
(UR2) –0.63* 0.88*** 1
Reservation earnings gap
(REG)a 0.58* –0.21 –0.39 1
Time-related underemployment
rate (UTR) –0.33 –0.33 –0.06 –0.32 1
Invisible underemployment
rate (IUR) 0.19 –0.06 –0.11 0.36 –0.26 1
Wage employment rate (WER) –0.02 0.21 0.44 –0.13 –0.31 –0.64** 1 Informal sector employment
rate (IER) 0.06 –0.07 –0.43 0.19 0.25 0.69** –0.93*** 1
Public employment rate (PER) –0.67** 0.44 0.63** –0.50 –0.12 –0.26 0.21 –0.36 1 Industrial employment rate
(IndER) 0.09 –0.35 0.26 0.34 –0.03 0.04 0.44 –0.43 –0.19 1
Multiple jobholding rate (MJR) 0.17 –0.29 –0.17 –0.02 –0.15 –0.65** 0.64** –0.81*** 0.09 0.30 1
Nominal earnings 0.23 0.26 –0.08 0.54* –0.39 –0.29 0.46 –0.25 –0.23 0.06 0.16 1
Male/female earnings ratio
(M/F E) 0.39 –0.40 –0.73** 0.54* –0.00 0.48 –0.72** 0.73*** –0.54* –0.29 –0.37 0.08 0.49 1
Formal/informal sector
earnings ratio (F/I E) 0.51 0.35 –0.10 0.64** –0.52* 0.64** –0.32 0.49 –0.40 –0.15 –0.52 0.37 1
Quartile 3 (high)/Quartile 1 (low) –0.32 0.19 0.29 –0.04 0.27 0.27 –0.60* 0.50 0.27 –0.28 –0.52 –0.36 0.18 0.38 1
Gini0 (including earnings = 0) –0.12 0.38 0.04 0.02 –0.10 0.56* –0.77*** 0.80*** 0.05 –0.68** –0.73*** –0.17 0.57* 0.57* 0.69** 1
Gini (excluding earnings = 0) –0.26 0.45 0.25 –0.11 0.08 0.31 –0.63** 0.68** 0.12 –0.67** –0.73*** –0.12 0.41 0.45 0.78*** 0.92*** 1
Sources: Based on Phase 1 of the 1-2-3 surveys of selected countries (see table O.1 for details).
a.The reservation earnings gap is the gap between the minimum earnings at which the unemployed would accept a job and the earnings of workers with equivalent characteristics (see the
methodology described in chapter 1, table 1.10).
Th e Micro Level: Heterogeneity across Individuals
Moussa and Fatou are 20-year-olds living in the capital of a French-speaking African country. Both graduated from upper-secondary school. What are their prospects? What benefi ts can they hope to gain from their qualifi cations? Were their parents right to invest in their education? Will it increase their chances of entering the world of work and fi nding a good job? Will they be able to fi nd fulfi lling jobs, or will they have to accept jobs for which they are over-qualifi ed? Will they be unemployed, out of the labor force, wage workers, or self-employed? Will they work in the formal or informal sector? What will the outcome depend on? How late in life will they have to keep working to ensure they maintain a decent standard of living?
Moussa, Fatou, and their families have surely asked themselves these ques-tions and many others. Th ey are vitally important. Africa is the youngest conti-nent in the world today, with more than 64 percent of the population under 25 years old. In view of demographic growth, the number of young people arriving on the labor market is expected to grow steadily.
Fatou is an exception. Like Moussa, she graduated from upper-secondary school. She therefore has an above-average education compared with young people in her generation, 27 percent of whom, boys and girls included, did not attend school between the ages of 10 and 14 (chapters 1 and 12). Fatou is even more exceptional than the other young girls, 34 percent of whom (compared with 20 percent of boys) in her generation did not attend school between 10 and 14.
In French-speaking Africa, there continues to be a wide gap between boys’ and girls’ levels of education, despite substantial narrowing in recent decades as a result of the widespread increase in school attendance rates. At the turn of the 21st century, school enrollment conditions remain diffi cult. Schooling competes with other activities that potentially bring in income for households. On average, 45 percent of children 10–14 participate in domestic activities and 12 percent engage in an economic activity. Th ese activities do not always prevent them from attending school: nearly 31 percent of children 10–14 both work and attend school. Th e competition seems to be mainly between economic activity and school, not between domestic activity and school (chapter 12). Children frequently combine domestic activities, sometimes for long hours, with school, whereas economic activity and school attendance tend to be mutually exclusive.
Th is general fi nding calls for some qualifi cation. Girls and boys diff er. When girls are not in school, their labor is more oft en used to bring in income for the family or to attend to domestic tasks. Boys are more oft en employed as appren-tices. Although apprenticeships are generally unpaid, they create human capital.
Not surprisingly, diff erences in time use are evident across cities and social backgrounds. Sons and daughters of educated parents have a higher probability
of attending school, as do children from wealthier households. Th ese diff erences probably refl ect the role of the budget constraint in the trade-off between work and education.
What benefi ts can Fatou and Moussa hope to gain from their qualifi cations? In most countries, education reduces the risk of unemployment, increases access to good jobs, and raises pay. In West Africa, unemployment increases with education, as shown in chapter 1: 15–18 percent of people with secondary or higher education are unemployed as opposed to just 11 percent of people with primary education and 8 percent of people with no education. Th e unem-ployment observed in these countries is therefore oft en viewed as a voluntary “queuing” phenomenon, in which the unemployed can aff ord to be unemployed until they fi nd a job in line with their aspirations. In these circumstances, many discouraged job-seekers could be expected to either withdraw from the labor market or accept jobs that are not appropriate given their capabilities.
Chapter 2 examines the extent and impact of this job mismatch. It shows that only 53 percent of workers 25 and over hold jobs that match their skills, with 30 percent underqualifi ed and 16 percent overqualifi ed for their job. Not surprisingly, the incidence of underqualifi cation is higher among workers with low levels of education and overqualifi cation is more common among workers with secondary or higher education. Fift y-nine percent of people with com-pleted lower- secondary school but not upper-secondary school and 69 percent of people with completed secondary education but not completed higher educa-tion are overqualifi ed. Higher-educaeduca-tion graduates are slightly better off , with “just” 45 percent overqualifi ed for the work they do. Job-seekers’ expectations of fi nding a job that matches their education dwindle with the length of unem-ployment, bearing out the hypothesis of “queuing” unemployment.
Given these realities, are Fatou and Moussa wrong to have spent time in school? Although their chances of fi nding a job that matches their qualifi cations probably fell as a result, they can expect to earn more: each additional year of education implies 10 percent higher pay. And even for overqualifi ed workers, each year of education beyond the minimum required education level to hold their job generates an additional increase in pay of 5–6 percent.
Th ese fi ndings are confi rmed in chapter 5, which examines the distribution of workers in diff erent employment sectors (public, formal private, and informal) and evaluates the returns to education in each sector. It shows that although education is no safeguard against unemployment, it does open doors to the highest-paid sectors (public sector and formal private sector) and yields posi-tive returns, including in the informal sector. Th e returns are convex, contrary to “standard” human capital theory, which posits that they are concave. Th is fi nding has important implications for education policy. If returns are convex, the massive investment in primary education may not produce the expected eff ects if access to secondary education is not also facilitated. Poor households
may choose to educate only some of their children to make the most of this convexity—with girls oft en suff ering as a result.
Th e fi nding of positive returns to education in the informal sector is impor-tant, because this sector employs more than 70 percent of the employed labor force in Sub-Saharan Africa. Th e large size of the informal sector is oft en per-ceived as refl ecting segmentation in the employment market. Th e market is segmented when jobs are rationed by restrictive wage rules (minimum wage, wage-setting based on an effi ciency wage principle, and so forth) or other rea-sons. Because access to this sector is restricted, people who cannot enter it are thrown into a market segment where workers are less protected and less well paid. In developing countries, this issue is usually studied by distinguishing between the formal employment sector (public sector and formal private sec-tor) and the informal sector. Th is distinction suggests that the informal sector is homogeneous. In fact, it covers a multitude of types of workers, including busi-ness heads with employees, employees of these busibusi-nesses, and own-account workers. Given that people working in the informal sector are able to evade taxation and social security contributions, some people in the sector may have chosen to work in it. Th is may be the case, in particular, with business heads. In a situation where many workers have only limited access to the capital market, not everyone can become a business head. Th is means that the informal sector itself could be segmented.
Chapter 6 looks into this issue. It studies the allocation of labor among three sectors: the formal sector (public and private formal), the upper informal sector (entrepreneurs employing at least one person), and the lower informal sector (own-account workers and employees). It fi nds labor market segmenta-tion between the upper and lower segments of the informal sector in the seven WAEMU cities studied: the proportion of people who, in view of their educa-tion and experience, should be working in the formal or upper informal sector appears to be lower than it would be if the market were not segmented. Restric-tion of access to the upper segment of the informal sector therefore emerges as an explanatory factor for poverty.
Th e emphasis on remuneration in studying populations exposed to the risk of poverty should not cloud the fact that other aspects of the labor relation-ship are just as important. Chapters 3 and 4 focus on aspects of employment still rarely addressed in developing countries, especially in Sub-Saharan Africa. Chapter 3 analyzes individual job satisfaction, measured in terms of the absence of desire to change job or status on the labor market. Th e fi ndings confi rm that a high wage increases job satisfaction but that it is not its only determinant. For example, other things equal, satisfaction increases with age (a refl ection of youth employment problems) and decreases with the level of education. Th is inverse relationship with education is consistent with the observation that the risk of being overeducated for one’s job increases with one’s skills level. In general,
working conditions appear to be just as important as earnings in determining satisfaction. For example, satisfaction is increased by working in the public sec-tor; earning a fi xed wage; having a steady rather than a casual job; and being a senior executive, employer/proprietor, or even own-account worker. Working in the informal sector does not systematically reduce job satisfaction, a result at odds with conventional wisdom. Chapter 3 also underscores the role of indi-vidual aspirations in job satisfaction: other things equal, people whose fathers have more than primary education have lower satisfaction than people with less educated fathers.
Chapter 4 examines some of these employment aspects, addressing the ques-tion of vulnerability in employment. Th is is virgin territory for the literature, at least in Sub-Saharan Africa. Th e authors build a composite indicator of vulner-ability that covers many aspects of the job held: contractual insecurity, working conditions, unstable remuneration, underemployment, and a mismatch between job and individual characteristics. Th ey show that 85 percent of private sector workers in all of the cities considered are vulnerable on the basis of at least one of seven criteria. In a competitive labor market, the theory of compensating wage diff erentials predicts that everything else equal, people in jobs with undesirable characteristics, in terms of strenuous or hazardous work or the protection off ered to workers, should be better paid. Chapter 4 shows that although on average, employment vulnerability is associated with lower pay in the formal private sec-tor, everything else equal, average earnings in the informal sector are higher for high-vulnerability jobs. Th e assumption that average gains can compensate for a certain level of vulnerability therefore holds in the informal sector.
Fatou may well have the same level of qualifi cations as Moussa, but does she have the same chances as Moussa of securing the job she wants? Do Fatou and Moussa have the same chances as people of diff erent origins with the same level of qualifi cations? Chapters 8 and 9 address these questions, each from a diff erent angle. Chapter 8 uses the information on jobs held by respondents and their fathers to analyze inequality of opportunities on the labor market. Th e fi ndings show that social origin plays a decisive role in labor market position, fostering the intergenerational transmission of inequalities. Transmission chan-nels are both direct and indirect. In some cities, access to the upper segments of the labor market (the public and formal private sectors) is determined by the level of education, itself dependent on the parents’ occupational status. In other cities, employment in one sector rather than another depends directly on the parents’ socioeconomic status. Ethnic group and migrant status also have signifi cant impacts in some cities.
Chapter 9 addresses discrimination. It decomposes the earnings gap between men and women and between the largest and other ethnic groups. Th e results show a large earnings gap between men and women, with women earning 21–50 percent of men’s earnings. Diff erences in the average characteristics of
male and female workers cannot explain these gaps. Th e gaps between ethnic groups are much smaller, and the largest group does not appear to systemati-cally enjoy a more favorable position than other groups.
Despite their qualifi cations, Moussa and Fatou have reason to feel appre-hensive about their entry into the world of work. Th e labor market does not give everyone the same opportunities. Access to the most desirable employment sectors appears to be restricted and to depend as much on parents’ social status as on the qualifi cations individuals hold. Unemployment is high among people with good qualifi cations, and a sizable proportion of people who are employed are frustrated because they have not found jobs that match their skills, even though they have above-average earnings. Th e outlook for Fatou is even bleaker, because she is likely to suff er discrimination as a woman.
Fatou might marry quickly and ultimately choose to run the household. She would then specialize in performing domestic tasks and educating the children. Even if she works outside the home, however, she is very likely to shoulder most of the domestic work, as chapter 7 shows. In the 10 countries considered, domestic work represents nearly one-third of the total time worked on average. Despite a lower labor force participation rate, on average, women account for 56 percent of the total time worked in the household, including domestic activi-ties (62 percent in the WAEMU countries). Women in Africa do most of the domestic work whether or not they work a paid job. Th ey account for 43 percent of market working hours but 89 percent of domestic working hours. Working women work a “double day,” in that their domestic workload is not lighter than it is for nonworking women.
A number of factors are correlated with inequalities in the gender division of labor. Social norms, measured by various variables, appear to play a decisive role: relative position in the household, age bracket, religion, and, to a lesser extent, education all have a signifi cant impact on the gender distribution of domestic and market work. Th e type of household and its demographic struc-ture also play an important part in this distribution: large, polygamous house-holds and househouse-holds with a larger number of adults have a diff erent gender division of labor than households made up of monogamous couples with young children.
Faced with problems fi nding work, many young people consider migrat-ing. Th is book addresses the migration question from two novel points of view. Chapter 10 deals with migration within the WAEMU economic area. Th e simul-taneous series of labor force surveys conducted in the same format in the seven French-speaking capitals provides an opportunity to examine the monetary determinants of migration within this zone, in which member countries have signed a free movement agreement.
Th e chapter paints a picture of migration between Southern countries, a sub-ject still somewhat neglected by the literature; it does not address South-North
migration, which requires data of a diff erent type. Th e chapter documents the magnitude of migration between WAEMU countries. Not surprisingly, Côte d’Ivoire is by far the leading country for immigration in the region. Mali and Burkina Faso supply the largest contingent of emigrants. Togo and Benin post high immigration and emigration fi gures.
Given that Fatou and Moussa graduated from upper-secondary school, they are unlikely to migrate within WAEMU, as the fi ndings show that migrants who move from one African capital to another are less educated on average than nonmigrants, both in their country of origin and in their destination country.7
In most countries, they have a higher probability of working in the informal sector and earning lower wages. Th erefore, the brain drain phenomenon does not appear to be the main characteristic of migratory fl ows between French-speaking West African countries. However, other things equal, migrants’ choices as to where they live do appear, at least in part, to respond to diff erences in remuneration: like nonmigrants, migrants choose to live in cities where, given their characteristics, their earnings expectations are highest.
With their qualifi cations, Fatou and Moussa are more likely to migrate to a developed country than another developing country. Moreover, if they do migrate, they are likely to do so only temporarily: recent analyses of interna-tional migration show that a large proportion of migrants ultimately return to their country of origin. Th e net impact of international migration, skilled or otherwise, on migrants’ country of origin is thus still a research question. Migration of educated workers might not be as negative as feared if migrants return in suffi cient numbers, bringing with them capital and know-how they manage to use productively in their country of origin.
Th is subject is analyzed in chapter 11, which uses data from the 1-2-3 sur-veys conducted in the WAEMU countries to evaluate wage diff erential between nonmigrant workers and migrant workers who have returned to their coun-try of origin (“return migrants”). Th e chapter’s fi ndings distinguish between migrants based on whether they have returned from a developed country or from another WAEMU capital. Migrants returning from WAEMU member countries and nonmigrants display very similar labor market participation behavior and characteristics. In contrast, migrants returning from OECD countries are much more educated, more likely to be employed, and wealthier than nonmigrants. Th ey also have a greater probability of working in the formal sector. However, this diff erence vanishes (or turns negative) when migrants’ characteristics are taken into account, suggesting that they suff er a loss of social capital that reduces their access to formal sector jobs. In terms of income, the results reveal the existence of a large migration premium for migrants returning from OECD countries. Informal sector businesses run by migrants returning from OECD countries are also more productive than businesses run by nonmi-grants or minonmi-grants returning from WAEMU or other countries.