2014 THIRD-PARTY LOGISTICS STUDY
The State of Logistics Outsourcing
Contents
4
8
16
24
32
38
44
48
52
54
56
Executive Summary
Current State of the 3PL Market
Big Data in 3PL-Customer Relationships
Preferential Sourcing
Smart Growth Leadership
Shipper-3PL Relationships
Strategic Assessment
About the Study
About the Sponsors
Credits
Contacts
www.3plstudy.com
Executive Summary
Current State of the 3PL Market
In the 2014 18th Annual Third Party Logistics Study, survey results showed the continuing, positive overall nature of shipper-3PL relationships. Both parties view them as being successful, and shippers are seeing positive results again this year: an average logistics cost reduction of 11%,
average inventory cost reduction of 6%, and an average ixed logistics cost reduction of 23%.
Shippers agree that 3PLs provide new and innovative ways to improve logistics effectiveness, and
that they are suficiently agile and lexible to accommodate future business needs and challenges.
Despite ongoing churn in shipper-3PL relationships, in general shippers are increasing their use
of outsourced logistics services, and shippers and 3PLs are now about equally satisied (70% and
69%, respectively) with the openness, transparency and good communication in their relationships.
As suggested in last year’s report, however, several ongoing factors are impacting progress toward the advanced end of the maturity model for shipper-3PL relationships. While gainsharing and collaboration with other companies, even competitors, to achieve logistics cost and service improvements would seem to be markers for advanced relationships, it seems these approaches are more preferred in certain shipper-3PL relationships, and less in others. There are some encouraging results that suggest a slight increase this year in outsourcing of strategic, customer-facing, and IT-intensive logistics activities. However, the continuing economic uncertainties in the global
marketplace may continue to dampen signiicant growth and innovation in the 3PL sector.
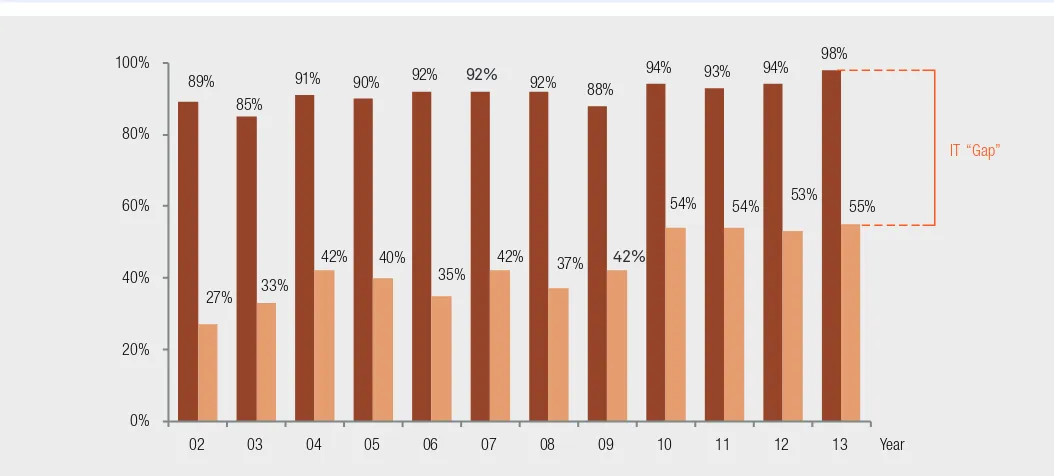
Signs indicate that the “IT Gap” — the difference between the percentage of 3PL users indicating
that IT capabilities are a necessary element of 3PL expertise (98% in the current study), and the percentage of the same users who agree that they are satisied with 3PL IT capabilities (55%)— is stabilizing to some degree. But our research also inds that 3PL IT capabilities are becoming
increasingly important to shippers, and that the shipper satisfaction ratings are also increasing.
Big Data
Global market intelligence irm IDC and other analysts declared 2013 to be the start of the Big
Data era in supply chain. But shippers differ widely in their levels of interest, understanding and adoption. While other surveys have
reported higher levels of participation, 30% of shipper respondents and 27% of 3PLs report
they are planning or currently undergoing big data initiatives.
Shippers (97%) and 3PLs (93%) feel strongly
5 EXECUTIVE SUMMARY
Shippers also see opportunities to collaborate
with their 3PLs using Big Data. About half (50%)
see the biggest such opportunity in creating more agile and reactive logistics/supply chain strategies, followed by supporting end-to-end visibility.
Signiicant internal hurdles stand in the way
of Big Data success, including a disconnect between internal supply chain and IT operations and a lack of supporting IT infrastructure.
Additionally, just 57% of shippers and 47%
of 3PLs indicate they “have access to timely and comprehensive data relating to supply chain planning and operations” within their organizations.
Survey results indicate that there is both great need and great potential for the use of Big Data by shippers and 3PLs in the supply chain. Ideally, Big Data can be leveraged not just to predict demand, but can begin to shape or change it.
Preferential Sourcing
The volume of cross-border trade has increased
considerably, with extra-regional trade strongly
outpacing intra-regional trade in many regions. That’s driving many shippers to revisit sourcing and distribution decisions, an activity which requires balancing cost with opportunity, particularly in developing countries. Shippers must also account for multiple factors, including consumerism, lead-time constraints, risk management/continuity planning and portfolio differentiation. Yet another factor is the increase of preferential trade agreements
(PTAs), which now number almost 300.
Basic management of global supply chain activity — the approach taken by many shippers — focuses on the physical movement of goods and viewing production and distribution as
ixed variables. A more advanced approach accounts for additional complexities,
referencing a more complete set of variables to optimize decisions at each point within the supply chain. Shippers undertaking advanced
global supply chain management often ind
value in developing a mature Global Trade
Management (GTM) methodology, which can
be seen in their organizational structure, supply chain decision points and the completeness of their GTM tools.
The2014 Annual 3PL Study survey found many shippers take a tactical, rather than strategic, approach to using GTM to manage global trade, entrusting GTM to more traditional
departments, namely logistics (23%), compliance (13%) and procurement (12%). Advanced GTM
users locate it in departments where it would play a more strategic role or consider it a cross-functional application. Basic users also typically apply GTM locally by region, while advanced GTM users use it globally to optimize sourcing decisions. Advanced users also consider PTA terms alongside other factors in evaluating locations, integrate their GTM applications with other tools and apply GTM early in the design and manufacturing processes.
Some 3PLs already partner with irms that
provide detailed supply chain collaboration services and are well-positioned to support shippers in their GTM needs. Whether or not
they include 3PLs, the increasing complexity
Smart Growth
With the new normal comes a new set of skills required of supply chain leaders, which are often quite different from those needed prior to and during the recession. With the growth of GDP in mature markets stalled at between 1% and 3%, supply now outstrips demand, and businesses and consumers are cautious and risk-averse. More than half of
shippers (57%) and 3PLs (54%) in the survey
agree that the upcoming seven to eight years following the recession will be a period of more
dificult growth than the seven to eight years
preceding it.
To succeed in this new normal, organizations need Smart Growth Leaders, a term coined by Korn/Ferry International. The company’s research has demonstrated that today’s supply chain leaders need to be accomplished in several dimensions of maturity and agility. Shippers rated their current leaders’ capacities in these dimensions slightly higher compared with 3PLs’ assessments of their own leadership.
Both shippers and 3PLs have room for improvement when it comes to “new normal” leadership competencies, particularly in people agility and emotional maturity. Supply chain organizations, already suffering a talent shortage, need a sustained commitment to both skill-building and recruitment to ensure the smart growth leadership skills necessary to succeed in the new normal marketplace.
Shipper-3PL Relationships
The impact of the recession on shipper-3PL relationships remains unclear: Will they return to the path they were taking before, or is there a new normal in shipper-3PL interactions? The good news is that shippers continue to select 3PLs on their ability to provide
continuous improvement (55%), experience in the shipper’s industry (49%) and an established ongoing relationship (42%) as important
selection criteria.
Shippers are also relying more on centralized sourcing in 3PL selection than they have in the
past. Nearly half of shippers (48%) and 61% of
3PLs say centralized procurement functions are playing more or much more of a role in the selection process compared with three years
ago. Conventional wisdom says centralized
procurement emphasizes cost over quality, yet shippers appear to be seeking strategies to control costs while striving for optimal 3PL relationships by balancing centralized and decentralized sourcing decisions.
Mitigating concerns about the impact of
centralization is the inding that the majority
of shippers and 3PLs say that their relationships have grown more collaborative over the past three years. In today’s markeplace it‘s important for shippers to strive for balance in sourcing decisions and seek strategic, collaborative relationships with 3PLs.
Strategic Assessment
Balancing the Bid Process
Many shippers are turning to initiating contract bids for new providers and shortening contract lengths in an effort to contain costs and leverage the competitive environment among 3PLs. However, neither of these strategies fosters solid foundations for mature, strategic shipper-3PL relationships.
Shippers need to understand the true cost of these tactics for their own businesses and their customers, including relational, procedural
and inancial switching costs. These must be considered against the beneits of long-term 3PL
contracts and relationships, such as increased
lexibility, access to specialized knowledge
and capabilities, and the ability to engage in
7 EXECUTIVE SUMMARY
Exploring the Risks/Rewards of Africa
Fast-growing economies, an abundance of low-cost labor, a burgeoning middle class and a commitment to improve infrastructure and remove barriers to trade are just a few of the reasons international companies are increasingly investing in opportunities in Africa.
But operating in Africa also presents considerable obstacles and risks, including cumbersome and corrupt clearance processes,
ineficient logistics and signiicant deicits in
physical transport infrastructure. Nigeria is just
one example of the dichotomies, presenting rich
opportunity for industries such as aerospace, telecom and consumer goods while still wrestling with issues of infrastructure and security. Opportunities are ripe for those with an appetite for making logistics processes more
standard and eficient.
Opportunities in Omni-Channel
Today’s demanding consumer expects a seamless experience across retail sales
channels, as well as individual recognition and reward. This has retailers, saddled with silo’ed systems built for single channels, scrambling to attain omni-channel functionality.
Core to the back end of this effort is optimizing inventory through virtualization and lexible
distribution strategies, enabling retailers to quickly locate and deliver inventory according to dynamic market demand, regardless of channel. Services such as locating inventory
from the store loor, enabling store pickup of
web orders and even home delivery enable retailers to satisfy consumers and reduce markdowns and inventory write-offs.
Many 3PLs offer the critical experience, capital expenditure, time, and resources essential to
helping retailers attain their goal of a single, seamless, agile omni-channel network.
New Thinking on 3PL Talent
Successf ul i nclusion i n it iat ives g ive organizations including 3PLs a distinct competitive advantage, broadening the look,
feel, experience and collective of knowledge
of 3PL talent. Yet many organizations struggle with how to approach inclusion. Organizations that Think Globally, Act Locally take into account the needs of diverse employees, clients and suppliers in local regions while keeping corporate goals in mind.
Global Novations (a Korn/Ferry International Company) deines diversity as everything
that makes an individual unique: traditional
deinitions as well as generation, socioeconomic
Current State of the 3PL Market
Source: Armstrong & Associates, 2013.
As the 3PL industry has matured, 3PLs have continually enhanced their ability to drive innovation and create value for their shipper customers. At the same time, shippers have
signiicantly reined their effectiveness as
buyers and users of outsourced logistics services. The Annual 3PL Study has documented this evolution, as well as the growing ability of both shippers and 3PLs to effectively manage their relationships with one another.
The survey portion of the 2014 18th Annual Third Party Logistics Study reveals that both shippers and 3PLs continue to view their relationships with one another as being successful. Shippers agree that 3PLs provide new and innovative ways to improve logistics effectiveness, and
that they are suficiently agile and lexible to
accommodate future business needs and future business challenges.
As suggested in last year’s report, however, progress toward the advanced end of the maturity model for shipper-3PL relationships seems to have met some modest headwinds. This year there are some encouraging results suggesting a slight increase in outsourcing of strategic, customer-facing, and IT-intensive logistics activities. The continuing economic uncertainties in the global marketplace,
however, may continue to dampen signiicant
growth and innovation in the 3PL sector.
While some of these indings are consistent
with recent Annual 3PL Studies, readers are cautioned when comparing results from this
year with those in past reports due to signiicant
changes in this year’s respondent base. Please see the About the Study section of this report for more information on the research process and the study respondents.
3PL Usage Reflects Global Economic
Trends
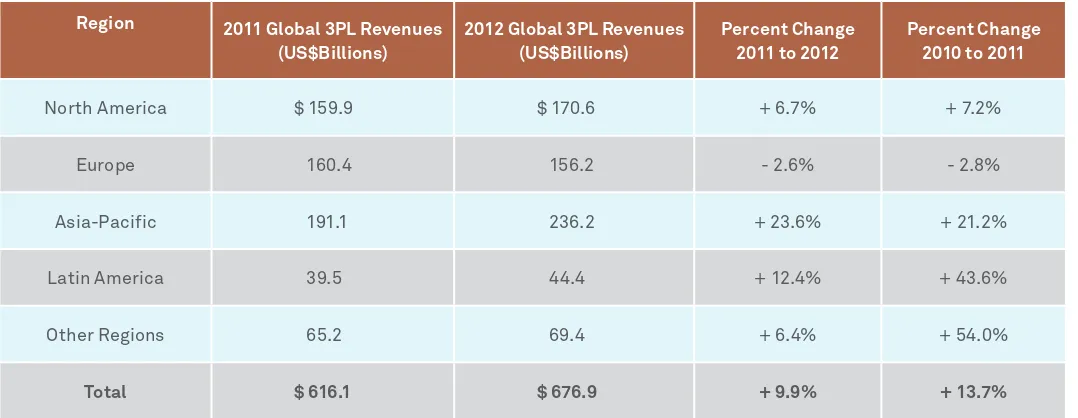
Global markets continue to be impacted by volatility in many economies throughout the world, driving highly variable and sometimes sluggish demand for outsourced logistics services. Figure 1 provides global 3PL revenues
by region for 2011 and 2012 from Armstrong
& Associates, plus a summary of percentage
changes reported for 2011-2012 and 2010-2011.
As indicated, global 3PL revenues of $676.9 billion (US dollars) reported for 2012 represent an increase of +9.9% over 2011. This represents the weighted-average of signiicant increases in Asia-Paciic (+23.6%) and Latin America (+12.4%), modest increases in North America
(+ 6.7%) and Other Regions (+6.4%), and a small decrease in Europe (-2.6%). In comparison with
the percentage growth in global 3PL revenues
of +13.7% reported for 2010-2011, however, the +9.9% change from 2011 to 2012 represents
a decrease of about 1/3 from the growth percentage reported in the previous year.
Latin America and Other Regions also saw slowing growth, from the robust +43.6% and +54%, reported respectively, in 2010-2011 to just +12.4% and +6.4% in 2011-2012. Overall, this relects shifts in global economic activity
and related freight movements that have caused some “cooling off” of the growth in 3PL revenues that was reported one year ago in some regions of the world. Global economic conditions may be responsible for the somewhat slower growth in 3PL revenues associated with emerging and developing markets.
According to Dr. William L. (Skip) Grenoble, Executive Director, Center for Supply Chain Research and Senior Research Associate for The Smeal College of Business, Penn State University, “Business and government
organizations are highly aware of the added value that the effective use of logistics outsourcing can have on logistics and supply chain effectiveness.”
Figure 1: Global 3PL Revenues Rise for 2011-2012
Region 2011 Global 3PL Revenues (US$Billions)
Results
2013 Study 2014 Study
Logistics Cost Reduction 15% 11%
Inventory Cost Reduction 8% 6%
Logistics Fixed Asset Reduction 26% 23%
Order Fill Rate
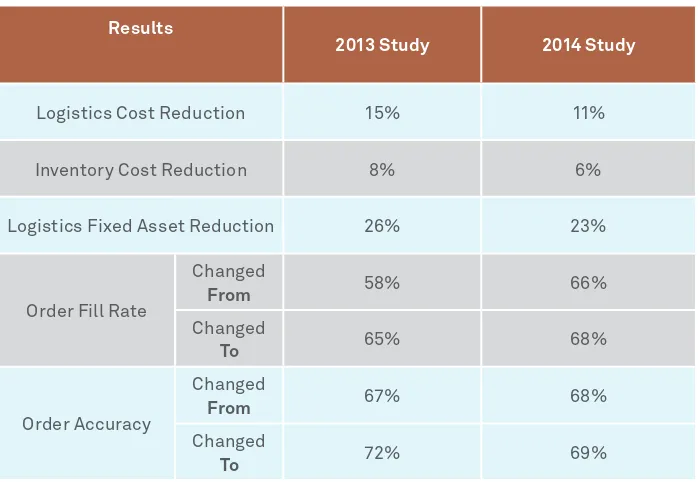
Figure 2: 3PL Services Deliver Measurable Benefits
3PL User Spending Patterns on
Logistics and 3PL Services
According to this year’s study results, 3PL users
report an average of 44% of their total logistics expenditures are related to outsourcing. This
compares with an average of 39% reported
last year, and 42% reported in the previous year. Total logistics expenditures include
transportation, distribution, warehousing and
value-added services. Considering Armstrong
& Associates’ estimated and projected increases to global 3PL revenues cited inFigure 1, these
percentages support the inding that global markets for 3PL services continue to expand.
Increased Use of Outsourcing
Outpaces Insourcing
One consistent inding throughout the 18 years
of Annual 3PL Studies is a relatively predictable
“ebb and low” of outsourcing vs. insourcing
in the 3PL marketplace. Sometimes customers increase their use of outsourced logistics
services (either in total or in terms of individual
activities outsourced), and at other times they decide to insource some or all of their logistics needs. In general, however, movement toward increased outsourcing generally outpaces movement toward insourcing.
• Outsourcing: 72% of shippers are increasing
their use of outsourced logistics services this year, which is up slightly from the average reported in recent years. Slightly more,
78%, of 3PL respondents see an increase in
outsourcing among their shippers.
• Insourcing: Generally, insourcing remains
less prevalent; 23% of shippers report they
are returning to insourcing at least some of their logistics activities, while an average 36% of 3PLs say that some of their customers are returning to insourcing.
• Reducing or Consolidating 3PLs: The ongoing trend toward strategic sourcing by many shippers is evident in the number who
report they are reducing or consolidating the number of 3PLs they use, an average of
56%. This is consistent with previous years’ indings and provides continuing evidence
that more than half of shippers place a priority on tightening up their rosters of 3PLs.
So while rates of change to outsourcing/ insourcing appear to remain stable, the Armstrong & Associates data supports a
key inding of this study: That 3PL users are
generally increasing their use of outsourced logistics services.
Shipper Experiences with 3PLs:
Measures of Success
Once again, a distinct majority (90%) of shippers
report that their relationships with 3PLs generally have been successful. Interestingly, but predictably, an even higher percentage
of 3PLs (97%) say their relationships with
shippers have generally been successful.
Figure 2 summarizes the tangible beneits
shippers report from their use of 3PL services,
including average improvements in order ill
rate and order accuracy. The average logistics cost reduction reported by shippers was 11%; the average inventory cost reduction was 6%;
and the average ixed logistics cost reduction was 23%. These igures are down modestly from
those reported in last year’s study; this is not
unexpected, since both shippers and 3PLs have been working earnestly to attain these beneits.
As with past years, just over half of shipper
respondents (55%, compared to 56% last year)
report their use of 3PLs has led to
year-over-year incremental beneits, while 91% of 3PLs
say their customers’ use of 3PL services has
Shifting Expectations in
Shipper-3PL Relationships
In the ive years that this study has surveyed
3PLs in addition to shippers, in most instances 3PLs rate their capabilities higher than shippers do. Although there are likely a number of reasons for this disparity, they do point to a need for more alignment among shipper and 3PL ratings on the key attributes and capabilities of 3PLs.
The news this year is that shippers and 3PLs have come into alignment in rating 3PLs’ capabilities in openness, transparency and effective communication. The 2014 3PL Study survey showed 70% of shippers and 69% of 3PLs are satisied with each others’ openness,
transparency and communication.
However, a difference still exists between 3PL
and shipper ratings of agility and lexibility to accommodate current and future business needs and challenges. This year 99% of 3PLs
feel their customers expect these qualities
in their 3PLs, while only 66% of shipper
respondents judge their 3PLs as suficiently agile and lexible. This continuing gap suggests
a further need for improvement.
For the past three years, this report has
addressed the extent to which contemporary
shipper-3PL relationships were moving up on the “maturity curve” in use of best practices and relationship-building initiatives. Two common themes of these discussions are “gainsharing” and “collaboration” in
shipper-3PL relationships. Recently, it has been
unclear in which directions these initiatives have been headed, particularly through the recent recession. However, this year’s study results reinforce the validity of these concepts as legitimate and useful elements of well-structured shipper-3PL relationships:
• “Gainsharing” between 3PLs and shippers:
Nearly half (47%) of shippers report having
engaged in “gainsharing” arrangements with
their 3PLs, while 60% of 3PL respondents
indicate they have engaged in gainsharing. In recent years this report has characterized
gainsharing as a sign of a more mature, evolved relationship. However, in light of the ongoing variance in the reported rates of gainsharing, our current opinion is that while the use of gainsharing is a valuable element of many shipper-3PL relationships, there are other relationships where some variation of a more traditional “fee-for-service” model is preferred. Future research will continue to take a deeper dive into this topic.
• Interest in collaborating with other companies, even competitors, to achieve logistics cost and service improvements:
Slightly more shippers (48% compared with 41% last year) express interest in
collaborating with other companies, even competitors, to achieve logistics cost and service improvements. Substantially more
3PLs (70%) indicate they are engaging in this
type of collaboration. As with gainsharing, it is likely that this approach is more suitable in certain types of shipper-3PL relationships than in others.
What Shippers Outsource and What
3PLs Offer
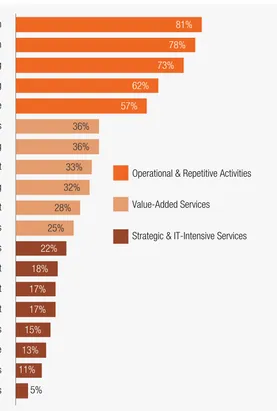
Fig u re 3 shows t he percentages of shippers outsourcing specific logistics activities. The results reveal that, while the responses to this question tend
to be very similar from one year to the next,
there are some notable shifts:
• Again with this year’s study, the most frequently outsourced activities tend to be those that are more transactional, operational and repetitive. These include
Figure 3: Shippers Continue to Outsource a Wide Variety of Logistics Services
Source: 2014 18th Annual Third-Party Logistics Study.
5%
Sustainability / Green Supply Chain Services
11%
Service Parts Logistics
13%
Customer Service
15%
LLP (Lead Logistics Provider) / 4PL Services
Operational & Repetitive Activities
Value-Added Services
Strategic & IT-Intensive Services
17%
Fleet Management
17%
Inventory Management
18%
Order Management and Fulfillment
22%
Information Technology (IT) Services
25%
SC Consultancy Services Provided by 3PLs
28%
Transportation Planning and Management
32%
Product Labeling, Packaging, Assembly, Kitting
33%
Freight Bill Auditing and Payment
36%
domestic and international transportation
(81% and 78%, respectively), warehousing (73%), freight forwarding (62%), and customs brokerage (57%). Although these activities are
sometimes regarded as common and routine, it is very important not to think of them as “commodities,” as today’s successful 3PLs
need to be experts at delivering these in ways
that are unique and highly differentiated from the customers’ point of view.
• The less-frequently reported activities indicated in Figure 3 tend to be somewhat
more strategic, customer-facing, and
IT-intensive. Example activities include: IT
services, supply chain consultancy services,
order management and fulillment, leet management, customer service and LLP/4PL
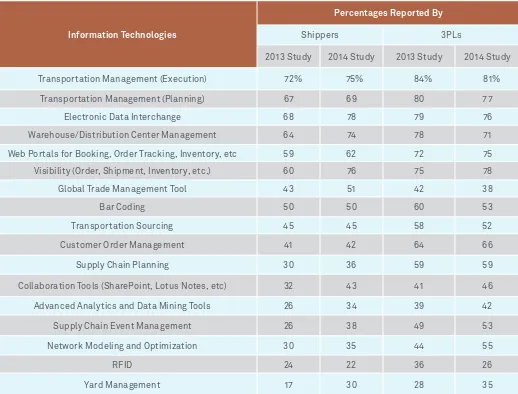
3PL’s IT Capabilities: The Bar Keeps
Rising
Shippers’ propensity to view 3PLs tactically
rather than strategically is relected in their
views of 3PLs’ IT capabilities. As seen in Figure 4, the IT capabilities shippers feel 3PLs
must possess relate more so to
execution-oriented activities and processes such as
transportation, warehouse/DC management,
electronic data interchange, visibility, etc., while they assign lower importance to capabilities that support more strategic and analytical services.
For 12 years this study has tracked a measurable
difference between shipper’s opinions on whether they feel information technologies
are a necessary element of 3PL expertise, and whether they are satisied with their 3PLs’ IT
capabilities. We have referred to this as the “IT Gap.”Figure 5 reveals that over the long term,
this gap has narrowed signiicantly. However,
over the last three to four years the gap appears
to have largely stabilized. This year 55% of shippers indicate they are satisied with IT
services provided by 3PLs, while 69% of the
3PLs feel their customers are satisied with their
IT capabilities.
Information Technologies
Percentages Reported By
Shippers 3PLs
2013 Study 2014 Study 2013 Study 2014 Study Transportation Management (Execution) 72% 75% 84% 81%
Transportation Management (Planning) 67 69 80 77 Electronic Data Interchange 68 78 79 76 Warehouse/Distribution Center Management 64 74 78 71 Web Portals for Booking, Order Tracking, Inventory, etc 59 62 72 75 Visibility (Order, Shipment, Inventory, etc.) 60 76 75 78 Global Trade Management Tool 43 51 42 38
Bar Coding 50 50 60 53
Transportation Sourcing 45 45 58 52 Customer Order Management 41 42 64 66 Supply Chain Planning 30 36 59 59 Collaboration Tools (SharePoint, Lotus Notes, etc) 32 43 41 46 Advanced Analytics and Data Mining Tools 26 34 39 42 Supply Chain Event Management 26 38 49 53 Network Modeling and Optimization 30 35 44 55
RFID 24 22 36 26
Yard Management 17 30 28 35
Figure 4: Shippers Still Prioritize Execution-Oriented 3PL IT Capabilities
Source: 2014 18th Annual Third-Party Logistics Study.
Figure 5: The “IT Gap” Continues to be Relevant to Shippers
Source: 2014 18th Annual Third-Party Logistics Study.
Key Takeaways
Key indings about the Current State of the Market for the 2014 18th Annual 3PL Study include:
• Global markets continue to be volatile, driving highly variable and sometimes sluggish demand for outsourced logistics services. While aggregate global revenues for the 3PL sector continue to rise,
Armstrong and Associates’ igure of +9.9%
average growth represents a decrease of about 1/3 from the percentage reported last
year. Latin America and Other Regions also
saw slowing of growth compared with last year.
• One consistent inding throughout the 18
years of Annual 3PL Studies is a relatively
predictable “ebb and low” of outsourcing
vs. insourcing in the 3PL marketplace. Data from Armstrong & Associates supports
a key inding of this study: That shippers
in general are increasing their use of outsourced logistics services.
• Shippers report an average logistics cost reduction of 11%. The average inventory cost reduction was 6%, and the average
fixed logistics cost reduction was 23%. These igures are down modestly from those reported in last year’s study, but conirm the reasons 90% of shippers report that their
relationships with 3PLs generally have been successful.
• Shippers and 3PLs are about equally satisied (70% and 69%, respectively) with
the openness, transparency and good communication in their relationships, and 66% of shipper respondents judge their 3PLs
as suficiently agile and lexible to meet
future business challenges.
• Nearly one-half of shippers (47%) have
engaged in “gainsharing” arrangements with their 3PLs, and a nearly equal percentage
(48%) indicated they have collaborated with other companies, even competitors, to achieve logistics cost and service improvements. Variances in these results over the years
suggest that, rather than relecting levels of maturity, these approaches simply it better
with some shipper-3PL relationships than they do for others.
• Consistent with past studies, transactional, operational and repetitive activities tend to be the most frequently outsourced, in relatively stable numbers, but this year’s results suggest some modest increases in prevalence of outsourcing some activities that are strategic, customer-facing, and IT-intensive.
• For the past 12 years, this study has been tracking the “IT Gap,” which is deined as
the difference between the percentage of 3PL users indicating that IT capabilities are
a necessary element of 3PL expertise (98% in
the current study), and the percentage of the
same users who agree that they are satisied with 3PL IT capabilities (55%). The results from this year’s study again conirm that
the IT Gap is stabilizing to some extent, but the research supports the idea that 3PL IT capabilities are becoming increasingly important to shippers, and that the shipper satisfaction ratings are also increasing. IT Capabilities Necessary Element of 3PL Expertise Shippers Satisfied with 3PL IT Capabilities
Big Data in 3PL-Customer Relationships
Varied Awareness
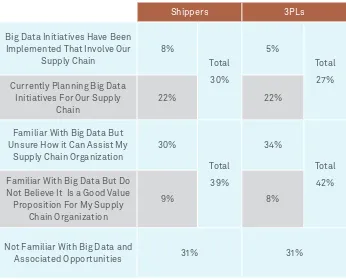
Shippers differ widely in their levels of interest, understanding and adoption when it comes to the role of Big Data in facilitating the analysis and solving of supply chain problems. As seen in Figure 6, just 30% of shippers and 27% of
3PLs indicate that to some extent they have
implemented or are currently planning Big Data initiatives that involve supply chains or supply chain management.
Another 39% and 42%, respectively, indicate
they are familiar with Big Data, but that they either are unsure as to how it can assist their supply chain organizations or do not believe it represents a good value proposition. And maybe not so surprisingly, 31% of shippers and an equal percentage of 3PLs report they are not familiar with Big Data and associated opportunities.
The lack of activity — or even awareness — among a majority of respondents contrasts
to some extent with eyefortransport’s Supply Chain Big Data Report – 2013, in which 60% of respondents reported some involvement in Big Data applications in the supply chain.
But the rationale behind many Big Data i n it iat ives — i mproved, data-driven decision-making — is widely endorsed. The
overwhelming majority of shippers (97%) and 3PLs (93%) participating in this year’s survey
agree that improved, data-driven decision-making is essential to the future success of their supply chain activities and processes.
Evidently, not all respondents agree that Big
Data fuels these decisions; just over half (59%) of shippers and 42% of 3PLs indicate in the survey
that shippers’ supply chain organizations see
signiicant value in the use of Big Data right
now.
Shippers 3PLs
Big Data Initiatives Have Been Implemented That Involve Our
Supply Chain Currently Planning Big Data
Initiatives For Our Supply Chain
22% 22%
Familiar With Big Data But Unsure How it Can Assist My
Supply Chain Organization Familiar With Big Data But Do
Not Believe It Is a Good Value Proposition For My Supply
Chain Organization
9% 8%
Not Familiar With Big Data and
Associated Opportunities 31% 31%
Figure 6: Shippers and 3PLs Report Similar Big Data Experiences
Source: 2014 18th Annual Third-Party Logistics Study. One of the most exciting and talked-about
trends in supply chain management is Big Data and its potential to shed new light on supply
chain problems and solutions. IDC and other analysts declared 2013 to be the start of the Big
Data era in supply chain, but concede that some organizations will “get it” more quickly than others, and use that early adopter mentality for competitive advantage.
Survey respondents’ attitudes toward Big Data and its potential to improve the functioning of
supply chains relect this early stage, indicating a range of conidence in the ability for Big Data
initiatives to solve supply chain challenges, as well as the ability of current organizations and infrastructure to realize meaningful supply chain improvement and innovation.
Fully understanding the implications of Big
Data requires irst understanding what it really means. The deinition that has guided our
understanding of Big Data is the one provided by Gartner.
In suggesting this deinition, Gartner cautions
that “the only reason for pursuing Big Data is to deliver against a business objective,”
according to the irm’s The Importance of Big Data report. “Processing large volumes or wide varieties of data remains merely a technological solution unless it is tied to business goals and objectives.”
Big Data” is high-volume, -velocity
and –variety information assets
that demand cost-effective,
innovative forms of information
processing for enhanced insight
and decision making.
(Gartner, The Importance of ‘Big Data’: A Deinition, 2012)
• Nike created a database with details on every link of its supply chain from sourcing to vendors across manufacturing and retail, according to a report on smartplanet.org,
November 2012. Analytics helps identify the
weak links within its supply chains – weak production, unfair labor practices and poor business decisions.
Separately, 3PLs expressed similar views
to those of shippers regarding shipper Big Data initiatives as well as their own efforts to leverage Big Data on behalf of their shipper
customers. One notable exception is that 3PLs
seem to regard “customer order management” as a greater opportunity to work with shippers on Big Data technologies than do the shippers
themselves. Customer order management has
historically been one area that shippers have
been reluctant to signiicantly involve external
organizations including 3PLs, so it will be interesting to watch how this plays out. Data. Together, these represent a broad range
of possibilities for using Big Data to improve the overall supply chain.
At the Shanghai workshop, for example,
participants envisioned leveraging Big Data to consider manpower costs around store deliveries, including performing predictive analysis on routing. Some supply chain operators are already leveraging such initiatives:
• FedEx, for example, uses active sensors
in high-value merchandise that send out telemetry data, tracking the package’s traveling speed and conditions, according
to Slashdot.org, October 2012; applying
analytics to this data has the potential to largely reduce supply chain reaction times to avoid delays in shipments.
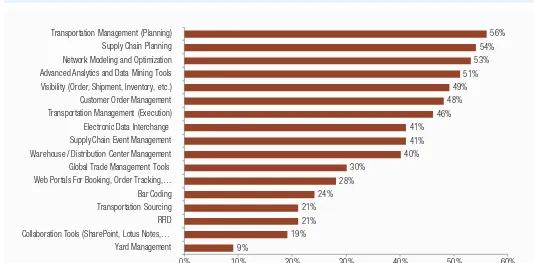
Big Data Potential both Functional
and Strategic
Functional activities such as visibility, transportation management, and warehouse/ distribution center management by their very
nature generate signiicant volumes of data.
So it’s not surprising that both shippers and 3PLs see in these technologies, systems or tools the potential for improvement through use of Big Data. “Getting tactical [through the use of Big Data] can be a good investment,” noted a participant in the Annual 3PL Study workshop held in Shanghai.
It’s encouraging to note, as indicated in Figure 7, that shippers also see more strategic, IT-based processes relating to supply chain planning, network modeling and optimization, and advanced analytics and data mining as great areas of opportunity to leverage Big
9% Collaboration Tools (SharePoint, Lotus Notes,… RFID Transportation Sourcing Bar Coding Web Portals For Booking, Order Tracking,… Global Trade Management Tools Warehouse / Distribution Center Management Supply Chain Event Management Electronic Data Interchange Transportation Management (Execution) Customer Order Management Visibility (Order, Shipment, Inventory, etc.) Advanced Analytics and Data Mining Tools Network Modeling and Optimization Supply Chain Planning Transportation Management (Planning)
0% 10% 20% 30% 40% 50% 60%
Figure 7: Shippers Report a Variety of Technologies/Systems/Tools for Big Data Supply Chain Initiatives
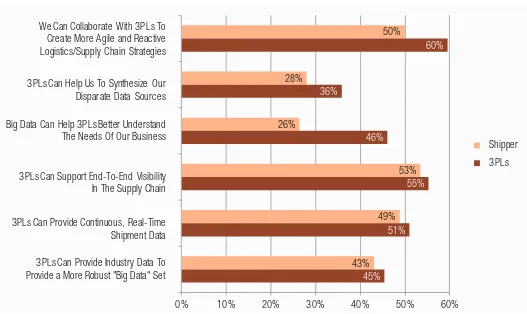
Shippers also see opportunities to collaborate with their 3PLs using Big Data (Figure 8), particularly the chance to support end-to-end
visibility in the supply chain (53%) and to create
more agile and reactive logistics/supply chain
strategies (50%). 3PLs had similar views, but
they diverged in two key areas:
• 3PLs report less confidence in working with shippers to help them synthesize their disparate data sources; 36% of 3PLs saw this as a Big Data collaborative opportunity,
versus 28% of shippers.
• Just 26% of shippers were conident that “Big
Data can help 3PLs better understand the
needs of (customers’) businesses,” while 46%
of 3PLs agreed.
At a recent Penn State Supply Chain Leaders
Forum, Matthew Menner, Senior Vice President at Transplace, remarked that with regard to Big Data, “3PLs need to plan a long term approach with business goals as the basis, and avoid industry trends that can be temporary
or disregarded in the near-term. (i.e., be
proactive, not reactive). This suggests that
there is a signiicant strategic advantage to
the development and utilization of Big Data capabilities.” Added Menner, “A proactive approach requires a multi-year plan between the customer and its 3PL to develop the strategy and roadmap to success. By using available data and business intelligence, companies gain insight that becomes actionable; and in the end, it helps align and engage a cross-functional team that shares a myopic set of objectives to
thrill the customer, retain business and grow market share.”
As seen inFigure 9, both shippers and 3PLs agree that 3PLs are already supporting Big Data initiatives, assume that 3PLs will develop them in the future, or believe 3PLs will have access to the data elements needed to drive the effective
use of Big Data. To a lesser extent, shippers and
3PLs have some concerns about 3PLs’ ability to
manage the complexity of the elements of Big
Data, and feel that shippers would not share proprietary data with 3PLs. Interestingly, far
more 3PLs (32%) are concerned about shippers’
proprietary data sharing compared with just
22% of shipper respondents. One interpretation
of these results is that according to 3PLs, shippers are not always as willing to share proprietary data as they would suggest.
19 Big Data in 3PL-Customer Relationships
43%
3PLs Can Provide Industry Data To
Provide a More Robust "Big Data" Set
3PLs Can Provide Continuous, Real-Time
Shipment Data
3PLs Can Support End-To-End Visibility
In The Supply Chain
Big Data Can Help 3PLs Better Understand
The Needs Of Our Business
3PLs Can Help Us To Synthesize Our
Disparate Data Sources
We Can Collaborate With 3PLs To
Create More Agile and Reactive
Logistics/Supply Chain Strategies
3PLs
Shipper
Figure 8: Opportunities Abound for 3PL-Shipper Big Data Collaboration
Managing Big Data
Supply chain activities may be generating Big Data, but internal IT departments are its curators. Succeeding with Big Data initiatives that benefit the supply chain will require collaboration between supply chain and IT organizations within both shipper and 3PL
companies. Fully 78% of shippers and 74% of
3PL respondents agree that the effectiveness of Big Data initiatives is highly dependent on the alignment and working relationships between supply chain and IT.
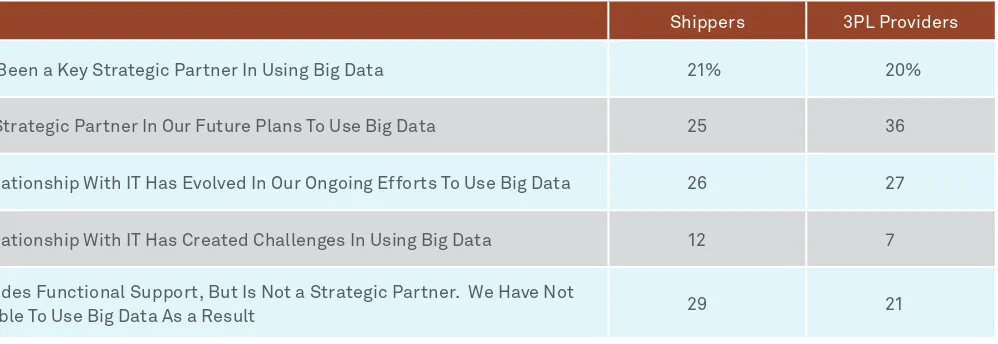
The survey results included in Figure 10 also suggest there is great room for improvement in these relationships when it comes to Big Data
initiatives. In fact, 29% of shippers report that
while IT does provide functional support, their view is that IT is not a strategic partner and has been responsible for the lack of progress in
using Big Data. Fewer 3PLs (21%) feel this way
about the Big Data support they’re receiving from their internal IT departments.
Figure 9: Shippers and 3PLs Bullish on Big Data Collaboration
Source: 2014 18th Annual Third-Party Logistics Study.
Figure 10: Supply Chain-IT Disconnects Restraining Big Data Progress
Source: 2014 18th Annual Third-Party Logistics Study.
Note: Totals do not add to 100% due to multiple responses.
Note: Totals do not add to 100% due to multiple responses.
Shippers 3PL Providers
Yes, 3PLs Can Support Our Big Data Initiatives 41% 34%
3PLs Have Access To the Heterogeneous Data Elements That Are Needed To Drive the Most Effective Use Of Big Data 18 26
3PLs Do Not Currently Have Big Data Capabilities, But We Assume They Will Develop Them In the Future 24 31
3PLs Cannot Manage the Complexity Of the Data Elements Needed To Effectively Use Big Data 17 12
Our Data Is Proprietary and We Would Not Share It With 3PLs 22 32
Shippers 3PL Providers IT Has Been a Key Strategic Partner In Using Big Data 21% 20%
IT Is a Strategic Partner In Our Future Plans To Use Big Data 25 36
Our Relationship With IT Has Evolved In Our Ongoing Efforts To Use Big Data 26 27
Our Relationship With IT Has Created Challenges In Using Big Data 12 7
At the Annual 3PL Study workshop held in
Amsterdam, participants expressed the idea
that the best approach to organizing Big Data initiatives is to create cross-functional working groups with representatives including IT,
Finance, HR, and so on, to get business context
for determining how best to use Big Data across the enterprise.
One common obstacle to working with IT on Big Data initiatives among respondents is a lack of foundational infrastructure;
59% of shippers and 48% of 3PLs report that
“our supply chain organization believes we need to further develop the more traditional requirements of storage, processing, and information architecture before becoming seriously involved in the use of Big Data.”
This limitation means just 57% of shippers and 47% of 3PLs agree they “have access to timely
and comprehensive data relating to supply chain planning and operations” within their organizations.
While “ownership” of Big Data initiatives can sometimes be a contentious issue, a prerequisite to success will be for representatives of the business and technology sides of the company
to work together effectively. A clear irst step
for many is putting the basic building blocks in place to ensure people in the business and IT organizations to have access to appropriate levels of data.
Deriving Value from Big Data
According to David Biederman’s Big Data: It’s Not All in the Numbers, which appeared in the Journal of Commerce, March 4, 2013, “Big Data represents a potential new source of competitive advantage for shippers, carriers and third-party logistics providers… by harvesting data for enhanced insight into market trends, cost structures and demand
and capacity luctuations, service providers can operate more eficiently and improve the
scalability of their enterprises.”
Our survey results reinforce these comments, and suggest that supply chain is a very fertile area of opportunity for the use of Big Data tools and technologies. At a recent meeting
of the biannual Penn State Center for Supply Chain Research (CSCR)’s Supply Chain Leaders Forum, Eric Peters, CEO of FoodLink, a irm
that provides solutions across the entire fresh food supply chain, said “[It is important to] leverage Big Data and identify problems and opportunities before they occur.”
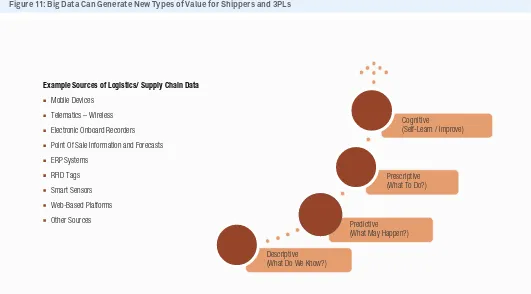
Figure 11 captures the essence of how to generate value from Big Data as an organization moves through stages of adoption, represented as descriptive, predictive, prescriptive, and
cognitive. The igure also includes some of the example sources of logistics/supply chain data
that may be of use to both shippers and 3PLs to generate new types of value.
Example Sources of Logistics/ Supply Chain Data
Mobile Devices
Telematics – Wireless
Electronic Onboard Recorders
Point Of Sale Information and Forecasts
ERP Systems (What Do We Know?)
Predictive
Figure 11: Big Data Can Generate New Types of Value for Shippers and 3PLs
Source: Supply Chain Leaders Forum, Center for Supply Chain Research, Penn State University, Spring, 2013
Early Days in Big Data Usage
These indings conirm that there is both great
need and great potential for the use of Big Data in the supply chain and as a key element of
shipper-3PL relationships. While signiicant
opportunities to make progress on these initiatives still remain, this study has provided
signiicant insight into why and how this area
will continue to be of great importance to both users and providers of 3PL services.
In the words of Christopher W. Craighead, Ph.D., Director of Research for Penn State’s Center for Supply Chain Research and the Rothkopf Professor and Associate Professor of Supply Chain Management, “we want to
get to the point where we can not only predict demand, but begin to shape or change the demand.” It is through the use of Big Data that supply chain operators will be able to make
signiicant progress on this objective.
Big Data: Key Takeaways
• Analysts declared 2013 to be the start of the
Big Data era in supply chain. But, shippers differ widely in their levels of interest,
understanding and adoption, with 22% of shippers and 23% of 3PLs planning or
currently using Big Data initiatives.
• Shippers (97%) and 3PLs (93%) wholeheartedly
agree that improved, data-driven decision-making is essential to the future success of their supply chain activities and processes. They also concur that Big Data can be leveraged in both functional and strategic aspects of supply chain operations, and to support visibility and make supply chains more agile. Many see Big Data as a key element in future 3PL services.
• Obstacles to leveraging Big Data include a disconnect between internal supply chain and IT operations and a lack of supporting
IT infrastructure. Just 57% of shippers and 47% of 3PLs “have access to timely and
comprehensive data relating to supply chain planning and operations” within their organizations.
• This year’s survey conirms that there is
Preferential Sourcing
• Lead-time constraints: how quickly suppliers can deliver parts and materials to production sites.
• Risk management/continuity planning:
Shippers are adding metrics such as “time to recovery” to their corporate scorecards in an effort to better measure the cost of protracted service/operations failures.
• Portfolio differentiation: as demand
diversiies geographically and individual
markets require products customized to local tastes.
Enter Preferential Trade Agreements
The diversiication of global supply networks
is driving creation of new free or preferential
trade agreements (PTAs). As seen in
Figure 12, the World Trade Organization says
almost 300 preferential trade agreements were in force in 2010. On average, a WTO member
is party to 13 PTAs, with more on the way.
Signiicant new agreements currently being negotiated include the Trans-Paciic Partnership and the Transatlantic Free Trade Area (TAFTA).
PTAs provide shippers a potential opportunity to lower costs, particularly in new, often developing markets.
But while the opportunities are large, just 16% of global merchandise trade currently receives preferential treatment, according to the World Trade Organization.
That may be because, as addressed in both the 2012 and 2013 Third-Party Logistics Studies, the rise of preferential trade agreements also creates new challenges for supply chain
executives. These include understanding PTA
eligibility, maintaining visibility of compliance information, obtaining PTA information from suppliers and collecting duty savings from trade programs.
At the Annual 3PL Study workshops in Shanghai and Amsterdam, conducted as part of the preparation of this year’s report, shippers
echoed the complexities of accounting for
PTAs in network decision-making, including developing capabilities to respond to PTAs and aligning PTAs with the company’s strategic goals.
As countries engage in multiple, overlapping preferential trade agreements, the task of keeping track of variances in tariff schedules, rules of origin, customs procedures, implementation timeframes, and so on, becomes
increasingly unwieldy and complex. The terms
of PTAs tend to change rapidly and arbitrarily, further complicating their management. Over the past few decades, the volume of
cross-border world trade has increased signiicantly. The value of world exports mushroomed from US $3,676 billion in 1993 to US $17,816 billion by 2011, with similar increases in world imports,
according to the World Trade Organization.
In fact, extra-regional trade strongly outpaces
intra-regional trade in many regions around the world.
Many shippers are revisiting sourcing and distribution decisions to take advantage
of expanding opportunities, and seeking
new paths for growth to offset stagnation or declines in mature markets. Setting up new sourcing and/or distribution relationships in developing countries entails balancing cost with opportunity. This is a complicated challenge as companies try to capture the information needed to make multimillion, or even multibillion dollar decisions. Shippers must capture and evaluate all of the factors impacting potential activity in a particular location. These may include:
• Consumerism, such as the rise of the middle class in China: this force is driving
development of additional regional and local market opportunities.
Almost 300 Preferential Trade Agreements (Notified and Not Notified) Were In Force In 2010
Only 16 percent Of Global Merchandise Trade Receives Preferential Treatment 13 Is the Average Number Of PTAs That a WTO Member Is Party To
Developed-developing Developed-developed Developing-developing
1950 1955 1960 1965 1970 1975 1980 1985 1990 1995 2000 2005 2010
Number of PTAs
Figure 12: Global Participation In Preferential Sourcing Agreements is Growing
Source: World Trade Organization’s July 2011 World Trade Report
G l o b a l Tr a d e M a n a ge m e n t
Approaches
In response to all of these pressures and
opportunities, some shippers are taking a more advanced approach for managing their global trade.
Most shippers take a basic path, optimizing supply chain costs and risks during the physical movement of product from suppliers through production to destination markets. In this model, activities focus on duties, freight costs, documentation and the need to support the physical movement of goods. These legacy supply chains typically approach production
and distribution as ixed variables within
the equation, and decisions are made from
(typically lowest cost) supplier through to
destination market. This approach is depicted in the top half of Figure 13.
The bottom half of the figure shows an advanced approach to global supply chain management, which considers a more complete set of variables to optimize decisions at each
point within the supply chain. Calculations take into account the complexity of moving
inished and work-in-process products across
country and regional borders, and optimize paths early in the supply chain to minimize these costs and risks throughout the chain. In an advanced approach, short- and long-term sourcing, production and distribution location decisions are made early in the product design process with the goal of aligning the country of origin with the destination country, and thereby being able to take advantage of a PTA.
Global Trade Management Maturity
Shippers with an advanced approach to
supply chain management often ind value in
developing a mature Global Trade Management
(GTM) methodology.
The maturity of company’s GTM approach can
be assessed by examining their organizational
structure, supply chain decision points and the completeness of their GTM tools:
• Organizational structure: In a mature approach to GTM, an integrated cross-functional team makes sourcing and routing decisions and shares data, rather than limited groups in silo’ed functional areas. These
shippers have well-developed relationships with providers and third parties.
• Supply Chain Decision Points: Sourcing and routing decisions are made early on in product design/development. The company optimizes for risks and costs backwards, from the destination market back to suppliers — a capability that requires comprehensive and accurate forecasting capabilities.
• Completeness of GTM tools: These compan ies use complete and real-time technology solutions rather than
spreadsheets. Calculations include PTAs
and tariff/duty updates, and the results are integrated with forecasting to account for changes in tariffs/duties as well as market demand. These shippers possess decision-making modeling capabilities, including the
location and investment in assets (production
locations) throughout the supply chain. This allows the shipper to identify the
requirements and beneits of complying
with a PTA.
Markets Product Development Production Distribution
Basic
Advanced
~100 SKUs Produced in
China
• In Country Hubs
• West Coast DC
• Europe DC
• Asia
• North America
• Europe
• Direct to Consumer
• Factory Store
• Wholesale
Asia DC Asia
US DC North America
Decision Decision Decision
Vs.
European DC Germany
Linear Decision Making
Cyclical Decision Making Figure 13: Global Trade Management Approaches
Even within more mature global supply chain management approaches, shippers vary
signiicantly in their capabilities. Most comply
with the minimum to get by, ensuring that they are covering tariff/duty and transportation
costs. Some understand the need for complexity,
and build in-house solutions to address their immediate needs. Top performers have grasped the concepts of GTM and are creating
competitive advantages by exploiting it. They are speciically applying GTM capabilities in
areas where demand is growing in developing markets. These leaders have found the value in
managing the complexity of GTM.
GTM continues to evolve alongside the need, but open questions remain regarding best
practices for GTM application. For example, is there more beneit for certain industries
over others? Is there a minimum scale that a
company must reach to achieve the beneits of adopting a complex GTM approach?
GTM as a Preferential Sourcing
Requirement
Often those with less mature approaches to GTM
do not see the potential proitability in a
well-developed preferential sourcing methodology. As indicated in Figure 14, shippers are more
likely to regard eficiency, compliance and risk
management as key drivers for their investment
in GTM than proitability. Many shippers view
GTM as a tactical tool required to buy and sell products in global markets.
In addition, as illustrated in Figure 15, these entry- and mid-level shippers do not implement GTM solutions globally. Instead, they are frequently applied in individual regions to support compliance.
Further evidence of the tactical use of GTM tools by entry- and mid-level shippers is seen in
Figure 16. Almost half of shippers place responsibility for global trade management in
departments which would employ GTM for more tactical applications, namely logistics
(23%), compliance (13%) and procurement (12%),
while the remainder locate it in departments where it would play a more strategic role, or consider it a cross-functional application — consistent with a mature approach.
When shippers use GTM for isolated regions
or exclusively for tactical decisions, they are
unable to fully leverage its power for enabling sound preferential sourcing decisions that take PTAs into account.
As one Shanghai participant noted, “You can build beautiful systems, but you need to understand how to use them” to make key decisions at both the tactical and strategic levels.
24%
Figure 14: Efficiency Primary Driver for Today’s GTM Investments
Source: 2014 18th Annual Third-Party Logistics Study.
27%
It is Managed Cross-Functionally
Procurement
Compliance
Finance
Product Development/Manufacturing
External Partner(s) Manage GTM
Figure 16: GTM Most Often Managed as Supply Chain Function
34%
34%
32%
13% Spreadsheet Managed
Point Software Solutions, Region or Country Specific
Managed Within a Single GTM System
Completely Outsourced
Figure 15: Spreadsheets the Most Commonly Used GTM Tool
Mature GTM Users
Those companies most advanced in the application of GTM use it to optimize sourcing decisions.
Mature users that leverage the constantly updating library of tariffs and duties incorporated into GTM tools can consider PTA terms alongside other factors in calculating
the opportunities and risks posed by speciic
locations when evaluating supply chain network decisions. Taking advantage of PTAs is also key to determining total landed cost – identifying opportunities to reduce duties, therefore allowing shippers to maintain margin at a lower sales price.
These users often integrate their GTM applications with other tools, drawing in additional global trade data while contributing updated PTA information. These include software solutions from companies such as
Integration Point and Amber Road and services including JPMorgan Chase Vastera.
Mature users also apply this sophisticated GTM approach early in the design process,
when materials are identiied and customers,
geographies, price, margins, shipping costs, and so on are being established.
Mature users typically leverage a single GTM tool to look across global operations and functional areas, as opposed to multiple separate evaluations within departments or regions. When shippers manage all activities within a single GTM tool, and then assign prime responsibility for management of the tool in cross-functional or supply chain functions, they make strategic information available to a larger pool of decision makers, and earlier in product design/development processes.
That’s important, because, as noted in Figure 17, a more cross-functional perspective is valuable in overcoming common obstacles to global trade. According to shipper respondents, these challenges include global visibility of
items, orders and shipments (62%), compliance information gathering and maintenance (49%)
and document management for shipment and
control, etc. (40%). Source: 2014 18th Annual Third-Party Logistics Study.
3PL Role in GTM
The challenges cited in Figure 17, along with the large number of shippers not currently leveraging GTM tools to manage all of the
complex data within supply chain decision
making, represent an opportunity for 3PLs. A third party is well-positioned to manage
the complexity and low of information across
players within a supply chain; and in doing so may be able to create more strategic relationships with all parties involved. Some 3PLs are well-equipped to facilitate global visibility and provide compliance management to support accurate documentation management, just two of the ways they can support shippers facing these challenges in Figure 17.
The Evolution of GTM
It’s dificult to overstate the importance of
getting it all right when making strategic decisions about where to locate sourcing and distribution/sales infrastructure. As more countries and regions forge Preferential
Trade Agreements, complex tariff and duty
structures, and more developed logistical options, understanding and capturing this information effectively becomes a potentially
costly or proitable way of doing business in
affected countries.
Reverse logistics is a case in point. In some
locations, such as Brazil, tariffs are structured in such a way that, once goods enter the country, it’s cost-prohibitive to get them back
out. Redistribution of misallocated goods is not
an option, so liquidating inventory sometimes becomes the only course of action. Such conditions elevate risk, and must be accounted for in strategic network planning.
The increasing complexity of global
trade dictates that shippers take a more comprehensive approach to sourcing and
distribution decisions. The rapid expansion in
the number of preferential trade agreements
is adding further fuel to the ire. The good
news is that there is considerable opportunity for both shippers and 3PLs to leverage global
trade management tools and services to take all factors into account as they make strategic
choices about where to extend their networks.
Pr e f er ential S our cing: T he
Takeaways
• Significant increases in the volume of cross-border world trade have many compan ies revisiting sourcing and
distribution decisions. But these complex
decisions require accounting for multiple factors, including consumerism, lead-time constraints, risk management/continuity planning and portfolio differentiation. Yet another factor is proliferation of preferential
trade agreements (PTAs), which now number almost 300.
• Most shippers take a basic approach to managing all this global trade activity, focusing on the physical movement of goods and viewing production and distribution
as fixed variables. A more advanced
approach considers a more complete set
Shippers
Figure 17: Top Global Trade Challenges Invite Strategic Use of GTMSource: 2014 18th Annual Third-Party Logistics Study.
of variables to optimize decisions at each point within the supply chain, accounting
for additional complexities. They often ind value in developing a mature Global Trade Management (GTM) methodology,
which is evident in their organizational structure, supply chain decision points and the completeness of their GTM tools.
• The survey found many shippers regard GTM as a tactical, rather than strategic, tool. So they tend to apply GTM in individual regions to support compliance and locate it in departments that tend to use it tactically. Advanced GTM users apply it globally to optimize sourcing decisions and consider PTA terms alongside other factors in evaluating locations. Many 3PLs already
partner with irms that provide detailed
Smart Growth Leadership
As the dust clears following the worst of the great recession, supply chain leaders are assessing the impact and crafting strategies
to guide their organizations into the next phase.
Shippers and 3PLs are in close agreement on the capabilities they feel are important in the supply chain leaders helming this effort. As seen in Figure 18, they rate operational execution,
people management and development, and driving growth as key abilities.
Challenges Ahead
But the skills those leaders needed to get their organizations through the recession, and in the time preceding it, differ markedly from those required in the “new normal.”
In the new normal, the givens are gone: • GDP: Markets are no longer growing fast
enough to sustain multiple players; the top one or two have the best chance to
win. Internationally, the growth of Gross Domestic Product has stalled at between 1% and 3% in mature markets and been reduced
to 5% to 7% in emerging markets.
• Demand: Supply now outstrips demand, and customers lean toward cutting costs rather than investing.
• Investors: Investors are focused more on assessing risk than on fostering growth.
• Talent: Top talent remains constrained, but top talent prepared for the new normal is especially rare.
• Regulation: Risk has replaced growth as the
overriding bias.
• Innovation: Fast but non-disruptive innovation has given way to disruptive innovation that leads to new models.
These changes have produced a radically
different marketplace. Consumers spend less
due to deleveraging, lower wages and job loss. Businesses feel uncertain, so they spend less and focus on costs instead of growth. Emerging markets grow more slowly, driving down commodity demand and prices. Protectionism
and unemployment reduce trade lows and
outsourcing. Governments spend less as well, and promulgate regulations that reduce risk and suppress capital available for growth.
More than half of shippers (57%) and 3PLs (54%)
in the survey agree that the upcoming seven to eight years following the recession will be a
period of more dificult growth than the seven
to eight years preceding it.
60%
Figure 18: Shippers and 3PLs Value Execution, People Management in Leaders
Source: 2014 18th Annual Third-Party Logistics Study.
Trained for Growth
Into those dificult conditions, march career supply chain executives whose training and experience are all rooted in a high growth era.
According to Korn/Ferry International, to succeed in the new normal, organizations need “Smart Growth” Leaders. Smart Growth Leaders possess the leadership and operational skills necessary to grow the top and bottom
line of a business in an extremely challenging
environment where demand conditions are weak and disruptive change is high. What organizations need now is nonlinear growth, that is, growth that tracks beyond general GDP or sector performance.
The leadership skills required to execute smart
growth are different than those needed in a
high growth phase. Scientists in the ields
of organizational and industrial psychology
have developed a library of 67 leadership
competencies known as The Lominger
Competency Model; Lominger is a
Korn/Ferry-owned company. This research documents how various combinations of leadership
competencies will result in successful executive behaviors, or failure. Companies use this
common standard to measure their current and emerging leadership talent, which can be applied via a human capital assessment process.
This work has demonstrated that to succeed in an era of sideways growth, leaders must
excel in two main areas, leadership maturity
— their ability to operate effectively at the
appropriate level of complexity, ambiguity
and scale —and learning agility, their ability to operate effectively at the appropriate level of disruption, speed and volatility.
There are several areas of competency within both maturity and agility:
• Organization Maturity: The ability to work with and navigate through the organization and its stakeholders.
• Cognitive Maturity: The ability to sense and respond to trends, information, data and insights.
• Emotional Maturity: The ability to stay in the most effective emotional state to get the best out of self and others.
• Mental Agility: Operates across domains, interested in unrelated areas and connects the dots to solve problems.
• People Agility: Reads people well, adapts
to diverse groups and shows astute interpersonal judgment.
• Change Agility: Not afraid to challenge the status quo, tinkers constantly, introduces and follows through on change.
• Results Agility: Is able to get outcomes in diverse challenges, prioritizes quickly, sets and achieves goals in good and bad situations.
• Self-Awareness: Reflective about self