Opportunity Integrated Assessment Facilitating Critical
Thinking and Science Process Skills Measurement
on Acid Base Matter
Anggi Ristiyana Puspita Sari
1,a), Suyanta
2,b), Endang Widjajanti LFX
3, Eli Rohaeti
31Department of Chemistry Education , Graduate School Program, Yogyakarta State University, Indonesia 2
Department of Chemistry Education, Faculty of Mathematics and Natural Science, Yogyakarta State University, Indonesia
3
Department of Chemistry Education, Faculty of Mathematics and Natural Science, Yogyakarta State University, Indonesia
a)
Corresponding author: [email protected]
b)
Abstract. Recognizing the importance of the development of critical thinking and science process skills, the instrument should give attention to the characteristics of chemistry. Therefore, constructing an accurate instrument for measuring those skills is important. However, the integrated instrument assessment is limited in number. The purpose of this study is to validate an integrated assessment instrument for measuring students’ critical thinking and science process skills on acid base matter. The development model of the test instrument adapted McIntire model. The sample consisted of 392 second grade high school students in the academic year of 2015/2016 in Yogyakarta. Exploratory factor analysis (EFA) was conducted to explore construct validity, whereas content validity was substantiated by Aiken’s formula. The result shows that the KMO test is 0.714 which indicates sufficient items for each factor and the Bartlett test is significant (a significance value of less than 0.05). Furthermore, content validity coefficient which is based on 8 expert judgments is obtained at 0.85. The findings support the integrated assessment instrument to measure critical thinking and science process skills on acid base matter.
INTRODUCTION
Nowadays, we are in the area of science and technology where scientific knowledge has grown exponentially and technology has progressed at rapid pace. Science education plays a role major for the futures of societies. Globally, countries have continuously sought to improve the quality of science education particularly developing countries. Based on UU 20/2003 the government construct curriculum to produce human resources who are productive, creative, innovative, and affective throughout attitude, skills, and knowledge in integrated manner [1]. Therefore, school should to enable students to integrate their knowledge with problems in daily life. Those potency can be materialized if the science learning process can grow students’ critical thinking and science process skills, so do chemistry as a part of science.
Science process skills are necessary tool to produce and use scientific information, to perform scientific research, and to solve problems [2]. It is more important for the students to learn how to apply science than learning reality, concepts, generalizations, theories and laws in science lessons [3]. Moreover science process skills have correlation with critical thinking skills because it has a close relationship with the mastery concept [4]. Upon the statements of experts, students should be prepared to cope with this world with higher level skills involving critical thinking and science process skills, so that they can solve problems in education learning and other fields.
One of the matters in chemistry that need critical thinking and science process skills is acid and base because is connected with others matter such as chemistry reaction, equilibrium, and stoichiometry [6]. Acid and base necessary closely related to everyday life. Thus, assessing students in acid and base matter should cover critical thinking and science process skills indicators which can be measured by using integrated assessment. By realizing the importance of integrated assessment instrument, the goal of this research study was to validate an integrated assessment instrument for measuring students’ critical thinking and science process skills on acid base matter. This instrument contains 11 items which each item cover two indicators at once.
RESEARCH METHODS
Three peer reviewers from postgraduate students and eight expert judgments which consist of four teachers and four lecturers participated. All teachers who taught chemistry in grade XI worked in different school. The integrated assessment instrument was administered to a total of 392 high school students in grade XI in the academic year of 2015/2016 at five schools in capital city of Yogyakarta. This research adapted development model of test by McIntire through nine steps which were (a) defining the test universe, audience, and purpose; (b) developing a test plan; (c) composing the test items; (d) writing the administration instructions; (e) conduct piloting test; (f) conduct item analysis; (g) revising the test; (h) validation the test; and (i) complete the test manual. The initial product was served by peer reviewers and validated by expert judgments.
Integrated assessment instrument was validated in order to represent what it is supposed to measure. Validation process involved theory and evidence collection to support interpretation against test score [7]. Content validity through Likert scale was processed from validation score and analyzed by using Aiken’s V [8]. Obtained V coefficient was matched to table of right-tail probabilities for selected values of the validity coefficient by Aiken [9]. If the coefficient less than 0.4 then the validity is poor, 0.4 – 0.8 is average, and more than 0.8 is good [10]. The mathematical form of the Aiken’s V is [9]:
!= !
[! !−1 ]
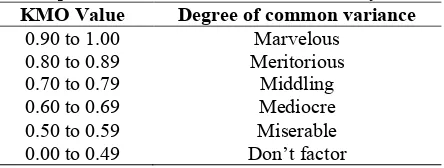
Collected data were coded, initially in Excel spread-sheet, and then transferred to SPSS 16.0 data editor for data analysis. Exploratory factor analysis (EFA) is a powerful tool for explicating construct. Interpretation from this analysis is used to describe estimation upon dimension which can be measured from integrated assessment instrument. Thus, EFA is used as an assumption of unidimensionality. Factor analysis began with examine the adequacy of the sample, then computer arranged variance-covariance to calculate eigen value. The eigen value is used to calculate the percentage of explained variance, at once describe scree plot [11]. Factor analysis output covers Kaiser-Meyer-Olkin Measure of Sampling Adequacy (KMO), Bartlett’s test, scree plot, and ant- images matrices. Table 1 shows the interpretation of the KMO [12].
Table 1. Interpretation Guidelines for the Kaiser-Meyer-Olkin Test
associated with sentence structure. Because the time allocation of just 90 minutes, all items should can be understood by students and do not use the term elusive. In addition to considering the use of language, revision of the instrument was also done on the acid and base concept.
Content Validity and Interpretation
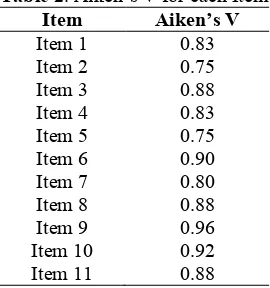
Besides the qualitative data, in the validation process is obtained quantitative data based on validation sheet. Quantitative data analysis used Aiken formula to calculate content-validity coefficient based on the validation by 8 expert judgments. Data analysis of content validity is shown in Table 2. Based on Table 2, the lowest Aiken’s V index is item 2 and 5 which is obtained at 0.75, while the highest is item 9. The result indicates that all items are valid in content based on table of right-tail probabilities for selected values of the validity coefficient by Aiken [9]. Overall content validity coefficient of integrated assessment instrument which is based on 8 expert judgments is obtained at 0.85.In addition, valid item is stated on good category when Aiken’s V index located at the significance level 1% is more than 0.8 [10].
Unidimensionality means each item only measure one dimension, which is students’ ability in chemistry. Thus, each item is expected only to measure students’ ability in chemistry on acid base matter. Factor analysis began with examine the adequacy of the sample, then computer arranged variance-covariance to calculate eigen value. The eigen value is used to calculate the percentage of explained variance, at once describe scree plot. The output covers Kaiser-Meyer-Olkin Measure of Sampling Adequacy (KMO), Bartlett’s test, scree plot, and anti-image matrices.
KMO measure of sampling adequacy was 0.714, and Bartlett’s test of sphericity was significant (χ2 = 446.201, p < 0.05). Both the KMO and Bartlett’s test suggested that factor analysis was feasible because obtained KMO is more than 0.5 and Bartlett’s test has significance less than 0.05 [12]. In addition, based on Table 1 the KMO is in category middling. In other words, the sample size of 392 students is enough. Bartlett’s test provides evidence that the observed correlation matrix is statistically different from a singular matrix, conforming that linear combinations exist. In summary, the result of KMO and Bartlett’s test is shown in Table 3.
Table 3. Result of KMO and Bartlett’s Test
Kaiser-Meyer-Olkin Measure of Sampling Adequacy 0,714
information. Unidimensionality can be seen from the first eigen values which is more than 20% [13]. In table 4 the first eigen values is 22.539%, so the unidimensionality requirement has been fulfilled. In the other words, the integrated assessment instrument found to comply in the construct validity.
Table 4. Total Explained Variance
Component Initial eigen values
Total % of Variance Cumulative (%)
1 2.479 22.539 22.359
2 1.470 13.365 35.904
3 1.134 10.313 46.217
4 0.996 9.057 55.274
5 0.847 7.702 62.976
6 0.814 7.400 70.375
7 0.789 7.171 77.547
8 0.708 6.439 83.986
9 0.670 6.095 90.081
10 0.583 5.301 95.381
11 0.508 4.619 100.000
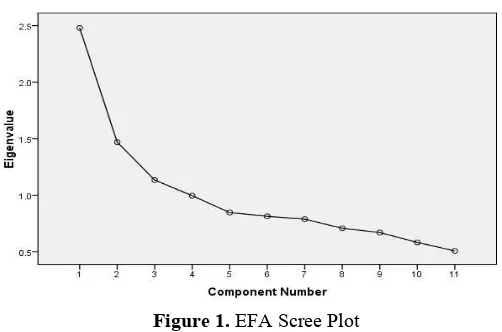
In addition, many factors formed can also be seen through the scree plot. Figure 1 demonstrates the sree plot of the eigen values and factors from the extraction seen in Table 4. The scree plot figure that there are three bends while from component number 4 and so on indicates that sloping graphic has the same eigen values – in other words the eigen values has lower value than factors before. Practically, it is hard to find item that only measure one dimension.
Figure 1. EFA Scree Plot
CONCLUSIONS AND SUGGESTIONS
ACKNOWLEDGMENT
The authors would like to express profound thanks and appreciation to the DP2M DIKTI (Directorate of Higher Education), Ministry of Research, Technology and Higher Education Republic of Indonesia through “Tim Pascasarjana” Research Grant 2016 for the financial support.
REFERENCES
1. Depdiknas, Undang-Undang Republik Indonesia Nomor 20 Tahun 2003 tentang Sistem Pendidikan Nasional
(Depdiknas, Jakarta, 2003).
2. H. Aktamis & Ö. Ergin, Asia-Pacific Forum on Science Learning and Teaching9, 1-2 (2008). 3. S. Karamustafaoğlu, Eurasian Journal of Physics and Chemistry Education 3, 26-38 (2011). 4. R. Chebii, S. Wachanga, & J. Kiboss, Scientific Research 3, 1291-1296 (2012).
5. National Academy of Sciences. National sccience education standards (National Academy Press, Washington, DC, 1996), p.5.
6. G. Demircioğlu, A. Ayas, & H. Demircioğlu, Chemistry Education and Practice6, 36-51 (2005).
7. B. Sumintono & W. Widhiarso, Aplikasi pemodelan rasch pada assessment pendidikan (Trim Komunikata, Cimahi, 2015), p.8.
8. J.M. Miller, Test validation: A literature review (University of Florida, Florida, 2003) 9. L.R. Aiken, Educational and Psychological Measurement45, 131-142 (1985), p.132-133
10. D.N. Kowsalya, V.H. Lakshmi, & K.P. Suresh, International Journal Social Science & Education2, 699-709 (2012).
11. H. Retnawati, Teori respons butir dan penerapannya (Nuh Medika, Yogyakarta, 2014), p.19
12. A.S. Beavers, J.W. Lounsbury, J.K. Richards, S.W. Huck, G.J. Skolits, & S.L. Esquivel, Practical Assessment, Research & Evaluation 18, 1-13 (2013).
13. M.D. Reckase, Journal of Educational Statistics 4, 207-230 (1979).