(Perubahan Karbon Tanah Kumulatif Tahunan Pada Hutan Tanaman
Pinus merkusii di Cianten Jawa Barat)
Harris Herman Siringoringo and Chairil Anwar Siregar
ABSTRAK
Simpanan karbon di alam meliputi simpanan karbon di dalam tanah (below ground) dan simpanan karbon di atas tanah (above ground). Secara global, simpanan karbon di dalam tanah lebih besar dari pada di atas tanah, oleh karena itu tanah mempunyai nilai penting yaitu sebagai sumber karbon (carbon source) dan pengurang karbon (carbon sink). Penelitian dilaksanakan di Lokasi Percobaan hutan tanaman Pinus merkusii dan plot kontrol/baseline di Cianten, Kabupaten Bogor, Jawa Barat. Tujuan utama penelitian ini untuk mengetahui perubahan simpanan karbon tanah secara kumulatif pada kedalaman 0-30cm dari tahun 2001 hingga tahun 2003. Hasil penelitian ini menunjukkan bahwa tidak ada perubahan yang signifikan antara tahun 2001 hingga 2003 pada nilai kandungan karbon tanah, kerapatan tanah, simpanan karbon tanah, serta simpanan karbon tanah kumulatif, baik pada petak hutan tanaman pinus maupun pada petak kontrol. Kandungan karbon tanah pada kedalaman 0-30 cm untuk masing-masing kelas umur tanaman 0 tahun, 1 tahun dan 2 tahun adalah 4.14 9.35%, 4.08 8.83% dan 3.04 7.61%. Kandungan karbon pada plot kontrol tahun 2001, 2002 dan 2003 masing-masing adalah 1.86 5.75%, 2.32 5.79% dan 2.05 4.84%. Kerapatan tanah (BD) hingga kedalaman 0- 30
3 3
cm pada umur tanaman 0 tahun, 1 tahun dan 2 tahun masing-masing adalah 0.38 0.5 Mg/m , 0.38 0.52% Mg/m dan 3
0.32 0.5 Mg/m . Kerapatan tanah pada plot kontrol tahun 2001, 2002 dan 2003 masing-masing adalah 0.47 0.63
3 3 3
Mg/m , 0.43 0.6 Mg/m dan 0.4 1- 0.55 Mg/m . Hasil penelitian juga menunjukkan bahwa simpanan karbon kumulatif pada petak coba hutan tanaman pinus lebih besar daripada simpanan karbon kumulatif pada petak kontrol/hutan sekunder.
Kata kunci : Karbon tanah, kerapatan tanah, simpanan karbon kumulatif ABSTRACT
Important carbon storage in forest vegetation includes below ground carbon storage and above ground carbon storage. Carbon storage under the ground is higher than that above ground, so that soils are critical both as a source and sink of carbon. The main objective of this research is to examine the annual changes of soil carbon storage from year 2001 to year 2003 in the permanent plots of an experimental plantation (new plantation established in the year 2001) and in the permanent plots of control plot/baseline (young secondary forest), in Cianten Experimental Site, Bogor, West Java. Soil carbon content at 0-30 cm depth for 0 year old, 1 year old and 2 year old plantations are 4.14 9.35%, 4.08 8.83% and 3.04 7.61%, respectively. Soil carbon content at control plot for 2001, 2002 and 2003 are 1.86 5.75%, 2.32 5.79% and 2.05 4.84%, respectively. Bulk density at 0-30 cm soil depth for 0 year old, 1 year old, and 2 year old
3 3 3
plantations are 0.38 0.5 Mg/m , 0.38 0.52% Mg/m and 0.32 0.5 Mg/m , respectively. Bulk density at
3 3 3
disaster on each part of the world (increasing temperature, forest fire, hurricane, increasing sea
level). The problem is becoming more serious and great concern has been realistically reflected on
UNFCCC Conference, Rio de Janeiro, December 1992, and The Kyoto Protocol, Japan,
December 1997, in which Indonesia government signed the convention.
The result of the International Convention eventually offers the ultimate International
project on sink program as one of the alternative in controlling carbon emission. Furthermore,
this sink program will be included in the clausal of Clean Development Mechanism (CDM). CDM
is the very important provision of the Kyoto Protocol in which developing countries with tropical
rain forest are to be involved in an effort to decrease carbon emission through the development of
carbon sink, biodiversity, and sustainable forest management.
In the Seventh Conference of the Parties (COP7) meeting, the participating countries agreed
to include afforestation activities into CDM to promote the expansion of industrial tree plantation
in the devastated areas of developing countries in the tropics, which were once covered with thick
tropical rain forest.
In a forest system tree biomass and soil are two major carbon pools. Therefore for estimating
carbon fixation by tree plantation establishment and its change over stand age, it is essential to
know the change in carbon storage in a soil together with carbon in biomass. However, it would be
easy to understand the carbon fixing potential above the ground in the forest by monitoring the
growth of trees. On the other hand, it would be difficult to estimate the carbon fixing potential
under the ground in the forest.
Carbon storage under the ground is no less than that above the ground. On a global scale,
soils are critical both as a source and a sink of carbon. With a global stock about 1500 Pg of soil
organic carbon (SOC), soils hold 2.1 times as much carbon as the atmosphere and 2.7 times more
than standing vegetation (Metting
et al
., 1998). Therefore, it is important to study the carbon fixing
potential under the ground in the forest in order to grasp the forest function on carbon fixing,
which is recognized as the contribution to the mitigation of global warming. The amount of
carbon storage in the soil and its annual changes/transition will be examined in this research.
The main objective of this research is to examine the annual changes of soil carbon from
year 2001 to year 2003 in the permanent plots of an experimental plantation (new plantation
established in the year 2001) and in the permanent plots of control/baseline (young secondary
forest), in Cianten Experimental Site, Bogor, West Java.
II. MATERIAL AND METHODS
A. Soil Sampling Site Description
Experimental site was established in plantation area of
Pinus merkusii
located in Block 24B,
RPH Cianten, BKPH Leuwiliang, KPH Bogor, Perum Perhutani, Unit III West Java. According to
Siringoringo
et al
. (2003), the soil classification is Dystric Nitisol (fine, mixed, active,
isohyperthermic, Typic Hapludult), (USDA-NRCS, 1998).
Soil sampling at 0-30 cm depth was done in respective plot one time each year regularly,
started in December 2001(soon after land preparation) until 2003. For 0-30 cm depth sampling,
soil samples were taken from the soil layers of 0-5 cm, 5-10 cm, 10-20 cm and 20- 30 cm depths,
respectively.
C. Analytical Method and Calculation of Soil Carbon Storage
2
1.
Bulk density (BD) was measured using a 100 cc (20 cm x 5 cm) core cylinder for sampling. The
sampling was performed with four replications for each soil layer, and the four cylinder
samples taken from each soil layer were mixed together to prepare one composite sample for
each layer.
2. Total carbon content was determined by dry-combustion method using a NC analyzer
(Sumigraph NC-900, Sumitomo Chemicals).
3. The amount of carbon stored in each soil layer was calculated by multiplying carbon
concentration, bulk density and thickness of each layer.
D. Experimental Design and Statistical Analysis
Experimental design used for soil study was completely randomized block design (CRBD)
with five (5) replications for permanent control (baseline) plot and four (4) replications for
permanent plantation plots. Land preparation was started in December 2001. P.merkusii
seedlings were planted in early January 2002, with spacing of 2 m by 3 m.
Plot setting used for soil sampling at plantation and control plots is as follows :
1. Plantation plot: 4 plots (30 m x 20 m each) were set in the slashed land
2. Control plot/baseline: 5 plots (10m x 10m each) were set in the young secondary forest.
Carbon change on each depth and on each plot was evaluated with analysis of variance
(ANOVA) using JMP Start Statistics (Sall, J.
et al.
2005). All possible pairs of means were compared
in a One Way ANOVA, and test procedure was conducted using Tukey-Kramer Honestly
Significant Difference (HSD). Procedure of soil sampling was done based on method described by
Hatori (2003).
III. RESULTS AND DISCUSSION
A. Soil Carbon Content
The results of annual soil carbon content of Cianten experimental site are summarized in
Table 1 covering mean value, standard deviations (SD), and coefficient of variation (CV) in each
soil layer from surface down to 30 cm depth.
The average of soil carbon content in 0-5 cm, 5-10cm, 10-20cm, and 20-30cm depths of
plantation plots and baseline plots in Cianten was shown in Figure 1. The level of soil carbon
decrease tremendously as the soil depth increase across all year of observations and land use type.
There is no annual significant change in soil carbon content based on the time of
examination neither on baseline plots nor on plantation plots in the year 2001 to the year 2003.
Figure 1 also illustrates comparison between carbon content of
Pinus merkusii
plantations plot and
that of baseline plot.
Pinus merkusii
plantations plot seemed to have higher soil carbon content in
0-30 cm depth than that of baseline plot. This finding is probably due to the difference of patches of
the soil with different characteristics between baseline plot and
Pinus merkusii
plantation plot, so
scattering of data was very widely. As shown in Table 1, coefficient of variation (CV) of soil
carbon content for baseline plot is more scattered than that of plantation.
Coefficient of variation of
Pinus merkusii
plantation for soil carbon content was in a range
between 10 and 16% for 0- year old plantation, between 20 and 27% for 1 year old plantation, and
between 2 and 25% for 2 year old plantation.Whereas, coefficient of variation of baseline plot
dominated by the young secondary forest between 38% and 72% examined in the year 2001,
between 35 and 48% examined in the year 2002, and between 40 and 73% examined in the year
2003.
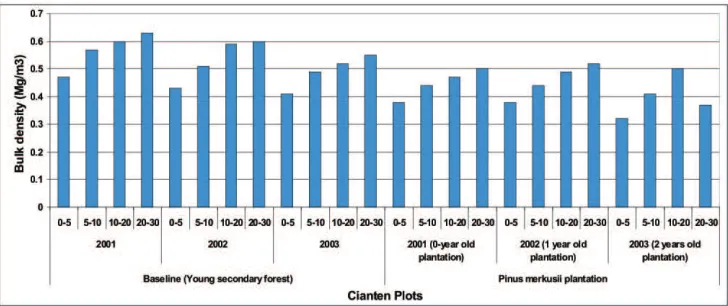
B. Bulk Density
The results of annual soil bulk density value of Cianten are summarized in Table 2, covering
mean value, standard deviations (SD), and coefficient of variation (CV) in each soil layer from the
surface down to 30 cm depth.
The soil bulk density average in 0-5 cm, 5-10cm, 10-20cm, and 20-30cm depths of plantation
plot and baseline plot in Cianten experimental plot was shown in Figure 2. The magnitudes of soil
bulk density increase considerably as the soil depth increase across all year of observations and
land use type.
Table 2. Annual soil bulk density of baseline plots and newly established
Pinus merkusii
plots in
Cianten from year 2001 2003
There is no annual significant change of soil bulk density value from year 2001 to the year
2003 (three times examination) for baseline plot and plantation plot. In most soil profiles the value
of bulk density was the lowest in the uppermost soil layer due possibly to stronger and stable
development of soil structure facilitated by higher organic contents, higher root development and
higher soil faunal activity. However, it may not be reasonable to ascribe the different patterns in
bulk density among the plots to the land use history for agriculture, which may different from
place to place, judging from the remarkably large difference in the value not only in the shallower
parts but also in the deeper parts of soil. Consequently, the inter-plot difference in bulk density
might be due to the inherent characteristics of the respective soils. According to Ohta and Effendy
(1992), bulk densities of Ultisols in East Kalimantan are strongly controlled by their clay contents.
The different patterns in bulk density found between
Pinus merkusii
plantation plots and baseline
plots of Cianten might have been caused also possible differences in clay content among the soils.
Figure 2. Comparison of annual bulk density of baseline plots and newly established
Pinus
merkusii
plantation plot in Cianten among different depths from year 2001 to 2003
C. Carbon Stock
The results of annual carbon stock value of Cianten are summarized in Table 3 covering
mean value, standard deviations (SD), and coefficient of variation (CV) in each soil layer down to
30 cm depth.
Table 3. Annual carbon stock of baseline plots and newly established
Pinus merkusii
plantation
plots in Cianten from year 2001 to year 2003
Plot Depth l plot (young Secondary the year 2001)
The carbon stock in 0-5 cm, 5-10 cm, 10-20 cm, and 20-30 cm depths of plantation plot and
baseline plot in Cianten experimental plot was shown in Figure 3. The amount carbon stock of
the plantation plot in 0-5 cm, 5-10 cm, 10-20 cm, 20-30 cm depths in different ages which was
observed in the year 2001, 2002, and 2003 was 22.39 - 4.2 ton/ha, 21.23 - 3.13 ton/ha, 32.44 3.15
ton/ha, and 23.94 1.98 ton/ha after land preparation (year 2001) ; 21.93 2.74 ton/ha, 20.09 - 2.8
ton/ha, 33.24 - 6.19 ton/ha, 24.36 - 4.51ton/ha in one year old plantation (year 2002) ; 17.97 - 2.79
ton/ha, 18.7 - 3.82 ton/ha, 30.68 - 3.31 ton/ha, 17.42 - 0.31 ton/ha in 2 year old plantation (year
2003), respectively.
Figure 3. Comparison of annual carbon stock of baseline plots and newly established
Pinus
merkusii
plantation plot in Cianten among different depths from year 2001 to 2003
While the carbon stock of the baseline plot in 0-5 cm, 5-10 cm, 10-20 cm, 20-30 cm depths in
different ages was 14.4 - 3.94 ton/ha, 11.65 - 6.76 ton/ha, 16.02 - 7.29, 12.1 - 6.56 ton/ha in the
year 2001; 13.94 - 3.51 ton/ha, 12.44 - 3.43 ton/ha, 19.34 - 7.89 ton/ha, 14.54 - 5.0 ton/ha in the
year 2002; and 12.21 - 3.81ton/ha, 9.85 - 5.26 ton/ha, 14.62 - 8.59 ton/ha, 13.02 - 8.42 ton/ha,
respectively.
There is no annual significant change of amount of soil carbon stock from the year 2001 to
the year 2003 on the baseline plots and the plantation plots.
D. Cumulative carbon stock
plot/control plot in Cianten experimental plot in the year 2001, 2002, 2003 are shown in Table 5.
The cumulative carbon stock in 0-30cm soil layers was 54,17 ton/ha, 60,26 ton/ha, 49,7 ton/ha
for permanent baseline plot observed in the year 2001, 2002, 2003, respectively. The comparison
of cumulative carbon stock mean value of baseline based on annual observation, from the year
2001 to year 2003, did not differ significantly (one-way ANOVA, P > 0.05).
Table 4. Annual cumulative carbon stock of baseline plots and newly established
Pinus merkusii
plantation plots in Cianten from year 2001 to year 2003
Plot Depth the year 2001)
Figure 4. Comparison of annual cumulative carbon stock of baseline plots and newly
established
Pinus merkusii
plantation plots in Cianten Experimental Site among
different depths from year 2001 to year 2003
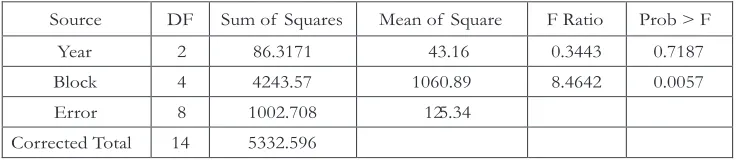
Table 5. Analysis of Variance of cumulative carbon stock for baseline by the year
Mean while, the cumulative soil carbon stock for 0, 1, 2 year-old plantation (observed in the
year 2001, 2002, 2003) was 100 ton/ha, 99,2 ton/ha, 84,77 ton/ha, respectively. The comparison
of mean value of cumulative soil carbon stock of the
Pinus merkusii
plantation from year 2001 to
year 2003 was done and the difference is not significant (one-way ANOVA, P > 0.05). The results
of the analysis of variance for cumulative soil carbon stock for the plantation by the year are
shown Table 6.
Table 6. Analysis of Variance of soil carbon stock cumulative for plantation by the year
Source DF Sum of Square Mean of Square F Ratio Prob > FSource DF Sum of Squares Mean of Square F Ratio Prob > F
Year 2 86.3171 43.16
Block 4 4243.57 1060.89
0.3443
8.4642
0.7187
0.0057
Error 8 1002.708 12 5.34
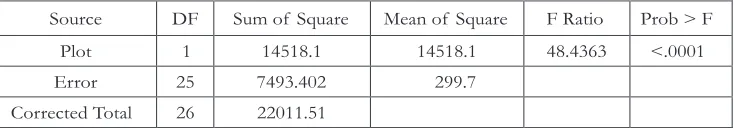
The comparison of mean value of cumulative soil carbon stock between plantation and
baseline across all year of observation was done, and the difference is highly significant (one-way
ANOVA, P < 0.01). The result of the analysis of variance for cumulative soil carbon stock
between plantation plots and baseline plots are shown Table 7. The cumulative carbon stock
occurred in the pines plantation appears to be tremendously higher than that in the baseline. Note
that the cumulative carbon stock occurring in baseline ranged from 50 to 60 ton/ha, meanwhile
the cumulative carbon stock resulting in pine plantation site ranged from 85 to 100 ton/ha from 0
to 30 cm soil depth.
Table 7. Analysis of Variance of cumulative soil carbon stock by plots (baseline and plantation
plots
Source DF Sum of Square Mean of Square F Ratio Prob > F
Plot 1 14518.1 14518.1 48.4363 <.0001
Error 7493.402 299.7
Corrected Total 25
26 22011.51
IV. CONCLUSION
There is no significant annual changes of soil carbon content, soil bulk density, soil carbon
stock, and cumulative soil carbon stock in both the
Pinus merkusii
plantation plot and baseline plot
from year 2001 to year 2003.
The cumulative soil carbon stock of
Pinus merkusii
plantation is much higher than that of
baseline in Cianten Experimental Site, Bogor, West Java.
The cumulative carbon stock in 0-30cm soil layers was 54.17 ton/ha, 60.26 ton/ha, and 49.7
ton/ha for permanent baseline plot in the year 2001, 2002, 2003, respectively. Meanwhile, the soil
carbon stock cumulative was 100 ton/ha, 99.2 ton/ha, 84.77 ton/ha for 0-year old plantation,
1-year old plantation, 2-1-years old plantation, respectively.
REFERENCES
Hatori, H.,2003. Soil Analysis Report. Carbon Fixing Forest Management Project. Japan
International Cooperation Agency and Forestry Research and Development Agency.
Ministry of Forestry, Indonesia.
Kalimantan, Indonesia, III. Clay minerals, free oxides and exchangeable cations,
Soil Sci. Plant
Nutr.
(in press).
Siringoringo, H.H., Chairil A.S., H. Hatori, 2003 : Analysis of soil carbon accumulation of
Pinus
merkusii
plantation in Cianten, West Java. Bulletin Penelitian Hutan, No. 634 : 93 -104.
Sall, J., Lee Creighton, Ann. Lehman. 2005. JMP Start Statistics. A Guide to Statistics and Data
Analysis Using JMP and JMP in Software. Thomson Learning Academic Resource Center.
Third Edition.
th