Lampiran 1 : Informed Consent
LEMBARAN PENJELASAN KEPADA ORANG TUA ATAU WALI CALON SUBYEK
PENELITIAN
Ibu Yth,
Saya dr. Iqbal Pahlevi Adeputra Nasution, SpBA dari Fakultas Kedokteran USU akan
melakukan penelitian dengan judul
: “
Karakterisasi Protein Nonstruktural NSP4 Rotavirus
Sebagai Enterotoxin Virus Yang Menginduksi Terjadinya Invaginasi Pada Anak
”.
Penelitian ini mengenai untuk mencari penyebab terjadinya invaginasi sehubungan dengan
keluhan yang dialami anak ibu saat ini.Penelitian ini bertujuan untuk mengetahui adanya
infeksi rotavirus dan berbagai risiko yang mungkin berhubungan dengan terjadinya penyakit
invaginasi.
Ibu Yth, manfaat yang akan ibu peroleh dari penelitian ini adalah dengan adanya hasil dari
penelitian ini maka dapat menjawab pertanyaan dari setiap orang tua yang anaknya
mengalami penyakit invaginasi seperti yang dialami anak ibu saat ini dan juga dapat segera
dapat diambil langkah-langkah pencegahan agar tidak terjadi lagi anak yang terkena
invaginasi dan mencegah terjadinya komplikasi yang dapat ditimbulkan oleh penyakit
invaginasi seperti kerusakan maupun kebocoran dari usus yang mengalami invaginasi.
akan bertanggung jawab untuk memberikan pengobatan, penjelasan dan membantu untuk
mengatasi masalah/efek samping tersebut.
Ibu Yth, partisipasi dari ibu dan anak ibu bersifat sukarela, semua
biaya penelitian ini tidak dibebankan kepada ibu. Tidak akan terjadi
perubahan mutu pelayanan dari dokter, apabila ibu tidak bersedia mengikuti
penelitian ini anak ibu akan tetap mendapatkan pelayanan kesehatan sesuai
dengan standar prosedur pelayanan.
Bila ibu masih belum jelas menyangkut tentang penelitian ini, maka setiap saat dapat
ditanyakan langsung kepada saya atau ibu dapat menghubungi saya melalui HP (
081328272121 ) atau di Departemen Ilmu Bedah FK-USU RSUP Haji Adam Malik Medan
jam 08.00
–
14.00 wib setiap hari kerja.
Ibu Yth, pada penelitian ini identitas ibu dan anak ibu akan dirahasiakan, hanya
dokter peneliti, anggota penelitian dan anggota komite etik yang bisa melihat data ibu
ataupun anak ibu.
Bila penelitian ini dipublikasikan kerahasiaan data ibu akan tetap dijaga. Setelah ibu
memahami berbagai hal yang menyangkut penelitian ini, diharapkan ibu yang anaknya telah
terpilih pada penelitian ini dapat mengisi dan menandatangani lembaran persetujuan
penelitian.
Medan,
Peneliti
LEMBARAN PERSETUJUAN SETELAH PENJELASAN (INFORMED CONSENT)
Saya yang bertanda tangan dibawah ini :
Nama :
Umur :
Jenis Kelamin :
Alamat :
Adalah benar orang tua dari :
Nama :
Umur :
Jenis Kelamin :
Alamat :
No MR :
Setelah saya mendapat penjelasan tentang penelitian ini, saya
memahaminya dan menyatakan bersedia dengan penuh kesadaran dan
tanpa paksaan dari pihak manapun, maka dengan ini saya menyatakan
bersedia untuk mengikut sertakan anak saya yang namanya seperti tersebut
di atas didalam penelitian ini.
Apabila dikemudian hari anak saya mengundurkan diri dari penelitian
ini, maka saya sebagai orang tuanya tidak akan dituntut apapun.
Medan,2013
Peserta Penelitian
Lampiran 3 : Surat Keterangan Telah Melaksanakan Penelitian di Laboratorium Terpadu FK USU
OUTPUT ANALISIS
HASIL ANALISIS UNIVARIAT
HASIL ANALISIS BIVARIAT
Crosstabs
Notes
25-JAN-2015 22:47:50
TATISTIK\bedah\IQBAL\data 25 januari
orking Data File 55
Handling sing issing values are treated as missing.
ch table are based on all the cases with
valid data in the specified range(s) for
all variables in each table.
tRotavirus BY invaginasi
=AVALUE TABLES
ICS=CHISQ RISK
UNT EXPECTED ROW COLUMN
UND CELL.
invaginasi
ly for a 2x2 table
Risk Estimate
e
Confidence Interval
er Upper
TATISTIK\bedah\IQBAL\data 25 januari
2015\data dr Iqbal 25 jan 2015.sav
orking Data File 55
ch table are based on all the cases with
valid data in the specified range(s) for
all variables in each table.
atgizi katsuku BY invaginasi
=AVALUE TABLES
ICS=CHISQ RISK
UNT EXPECTED ROW
UND CELL.
Crosstab
) have expected count less than 5. The minimum expected count is 6,18.
ly for a 2x2 table
e
Confidence Interval
er Upper
jk (Laki-Laki / Perempuan) 1,346 ,415 4,362
ginasi = invaginasi 1,118 ,707 1,770
ginasi = diare ,831 ,405 1,705
s 55
katgizi * invaginasi
t 35,0 20,0 55,0
) have expected count less than 5. The minimum expected count is 6,55.
ly for a 2x2 table
Risk Estimate
e
Confidence Interval
s 55
) have expected count less than 5. The minimum expected count is 8,00.
ly for a 2x2 table
Risk Estimate
e
Confidence Interval
er Upper
Confidence Interval
r Upper
6,74 ,851 ,00 ,85 5,30 8,55
e Interval for Mean 5,01
68
26
nge 10 -1 2 5 13
-,324 ,512 ,107 ,483 -1,085 ,758
,234 ,992 -,267 ,893 -1,377 1,990
rwise noted, bootstrap results are based on 1000 bootstrap samples
Bootstrap
Notes
26-JAN-2015 16:21:33
TATISTIK\bedah\IQBAL\data 25 januari
orking Data File 55
ETHOD=SIMPLE
ES TARGET=usia Neutrofil INPUT=invaginasi
CILEVEL=95 CITYPE=PERCENTILE
T-Test
Notes
26-JAN-2015 16:21:34
TATISTIK\bedah\IQBAL\data 25 januari
2015\data dr Iqbal 25 jan 2015.sav
orking Data File 34994
Handling sing issing values are treated as missing.
ch analysis are based on the cases with no
missing or out-of-range data for any
variable in the analysis.
Group Statistics
tistic
Bootstrapa
as Error
Confidence Interval
wer Upper
35
6,74 -,04 ,82 5,21 8,37
5,037 -,223 1,073 2,632 6,796
20
rwise noted, bootstrap results are based on 1000 bootstrap samples
Independent Samples Test
est for Equality of
Variances t-test for Equality of Means
. iled) rence r Difference
nce Interval of the
Bootstrap for Independent Samples Test
fference
Bootstrapa
Error -tailed)
Confidence Interval
wer Upper
assumed ,393 -,050 1,070 -1,785 2,482
not assumed ,393 -,050 1,070 -1,785 2,482
assumed 22,479 -,002 1,530 ,001 19,453 25,567
not assumed 22,479 -,002 1,530 ,001 19,453 25,567
rwise noted, bootstrap results are based on 1000 bootstrap samples
Crosstabs
Notes
TATISTIK\bedah\IQBAL\data 25 januari
2015\data dr Iqbal 25 jan 2015.sav
orking Data File 55
Handling sing issing values are treated as missing.
ch table are based on all the cases with
valid data in the specified range(s) for
all variables in each table.
tNSP4 BY invaginasi
=AVALUE TABLES
ICS=CHISQ RISK
UNT EXPECTED ROW
,005 1 ,942
est 1,000 ,617
r Association ,005 1 ,943
s 55
) have expected count less than 5. The minimum expected count is 2,91.
ly for a 2x2 table
Risk Estimate
e
Confidence Interval
26-JAN-2015 16:53:31
TATISTIK\bedah\IQBAL\data 25 januari
2015\data dr Iqbal 25 jan 2015.sav
orking Data File 55
Handling sing issing values are treated as missing
RESSION VARIABLES invaginasiRL
D=ENTER jk katgizi katsuku katRotavirus
katNSP4 Neutrofil
ERIA=PIN(0.05) POUT(0.10) ITERATE(20)
CUT(0.5).
00:00:00,02
00:00:00,06
nd: LOGISTIC REGRESSION
cannot use string variables longer than 8 bytes. The values will be truncated.
Case Processing Summary
effect, see classification table for the total number of cases.
28 1,000
27 ,000
38 1,000
17 ,000
Block 0: Beginning Block
Classification Tablea,b
cluded in the model.
is ,500
Variables in the Equation
S.E. ld df . (B)
Variables not in the Equation
Omnibus Tests of Model Coefficients
quare df .
rminated at iteration number 20 because maximum iterations has
been reached. Final solution cannot be found.
Predicted
Variables in the Equation
S.E. (B)
Logistic Regression
Notes
26-JAN-2015 16:58:47
TATISTIK\bedah\IQBAL\data 25 januari
orking Data File 55
Handling sing issing values are treated as missing
RESSION VARIABLES invaginasiRL
D=ENTER jk katsuku katRotavirus katNSP4
Neutrofil
ERIA=PIN(0.05) POUT(0.10) ITERATE(20)
CUT(0.5).
00:00:00,00
00:00:00,00
Warnings
nd: LOGISTIC REGRESSION
cannot use string variables longer than 8 bytes. The values will be truncated.
effect, see classification table for the total number of cases.
Block 0: Beginning Block
Classification Tablea,b
Predicted
invaginasiRL
0 20 ,0
0 35 100,0
tage 63,6
cluded in the model.
is ,500
Variables in the Equation
S.E. ld df . (B)
,560 ,280 3,986 1 ,046 1,750
Variables not in the Equation
re df .
,246 1 ,620
8,442 1 ,004
,005 1 ,942
45,225 1 ,000
s 45,905 5 ,000
Block 1: Method = Enter
Omnibus Tests of Model Coefficients
quare df .
rminated at iteration number 20 because maximum iterations has
been reached. Final solution cannot be found.
Variables in the Equation
ntered on step 1: jk, katsuku, katRotavirus, katNSP4, Neutrofil.
Logistic Regression
Notes
26-JAN-2015 17:01:37
TATISTIK\bedah\IQBAL\data 25 januari
2015\data dr Iqbal 25 jan 2015.sav
orking Data File 55
RESSION VARIABLES invaginasiRL
D=ENTER jk katRotavirus katNSP4 Neutrofil
(katRotavirus)=Indicator
(jk)=Indicator
(katNSP4)=Indicator
)
ERIA=PIN(0.05) POUT(0.10) ITERATE(20)
CUT(0.5).
00:00:00,02
00:00:00,02
Warnings
nd: LOGISTIC REGRESSION
cannot use string variables longer than 8 bytes. The values will be truncated.
55 100,0
effect, see classification table for the total number of cases.
Dependent Variable Encoding
Block 0: Beginning Block
cluded in the model.
is ,500
Variables in the Equation
S.E. ld df . (B)
,560 ,280 3,986 1 ,046 1,750
Variables not in the Equation
re df .
Omnibus Tests of Model Coefficients
,000a ,730 1,000
rminated at iteration number 20 because maximum iterations has
been reached. Final solution cannot be found.
Classification Tablea
Variables in the Equation
S.E. xp(B)
Logistic Regression
Notes
26-JAN-2015 17:03:59
TATISTIK\bedah\IQBAL\data 25 januari
2015\data dr Iqbal 25 jan 2015.sav
orking Data File 55
Handling sing issing values are treated as missing
RESSION VARIABLES invaginasiRL
D=ENTER katRotavirus katNSP4 Neutrofil
(katRotavirus)=Indicator
(katNSP4)=Indicator
)
ERIA=PIN(0.05) POUT(0.10) ITERATE(20)
0 ,0
55 100,0
es 0 ,0
55 100,0
effect, see classification table for the total number of cases.
Dependent Variable Encoding
Block 0: Beginning Block
tage 63,6
cluded in the model.
is ,500
Variables in the Equation
S.E. ld df . (B)
,560 ,280 3,986 1 ,046 1,750
Variables not in the Equation
re df .
Omnibus Tests of Model Coefficients
quare df .
72,103 3 ,000
72,103 3 ,000
Model Summary
likelihood ell R Square rke R Square
,000a ,730 1,000
rminated at iteration number 20 because maximum iterations has
been reached. Final solution cannot be found.
Classification Tablea
Variables in the Equation
S.E. (B)
ntered on step 1: katRotavirus, katNSP4, Neutrofil.
Logistic Regression
26-JAN-2015 17:06:28
TATISTIK\bedah\IQBAL\data 25 januari
2015\data dr Iqbal 25 jan 2015.sav
orking Data File 55
Handling sing issing values are treated as missing
RESSION VARIABLES invaginasiRL
D=ENTER katRotavirus Neutrofil
(katRotavirus)=Indicator
)
ERIA=PIN(0.05) POUT(0.10) ITERATE(20)
effect, see classification table for the total number of cases.
Block 0: Beginning Block
Classification Tablea,b
cluded in the model.
Variables in the Equation
S.E. ld df . (B)
,560 ,280 3,986 1 ,046 1,750
Variables not in the Equation
re df .
8,442 1 ,004
45,225 1 ,000
s 45,281 2 ,000
Block 1: Method = Enter
Omnibus Tests of Model Coefficients
,000a ,730 1,000
rminated at iteration number 20 because maximum iterations has
been reached. Final solution cannot be found.
Classification Tablea
Variables in the Equation
S.E. (B)
Logistic Regression
Notes
26-JAN-2015 17:07:55
TATISTIK\bedah\IQBAL\data 25 januari
2015\data dr Iqbal 25 jan 2015.sav
orking Data File 55
RESSION VARIABLES invaginasiRL
D=ENTER katRotavirus
(katRotavirus)=Indicator
)
ERIA=PIN(0.05) POUT(0.10) ITERATE(20)
CUT(0.5).
effect, see classification table for the total number of cases.
(1)
28 1,000
27 ,000
Block 0: Beginning Block
Classification Tablea,b
cluded in the model.
is ,500
Variables in the Equation
S.E. ld df . (B)
,560 ,280 3,986 1 ,046 1,750
Variables not in the Equation
re df .
8,442 1 ,004
s 8,442 1 ,004
Block 1: Method = Enter
quare df .
terminated at iteration number 4 because parameter estimates
changed by less than ,001.
Classification Tablea
Variables in the Equation
(B)
C.I.for EXP(B)
er er
1,749 ,627 7,776 1 ,005 5,750 1,682 19,661
-,223 ,387 ,332 1 ,565 ,800
ntered on step 1: katRotavirus.
Notes
26-JAN-2015 17:18:40
TATISTIK\bedah\IQBAL\data 25 januari
2015\data dr Iqbal 25 jan 2015.sav
orking Data File 55
Handling sing issing values are treated as missing.
ased on all cases with valid data for all
variables in the analysis.
BY invaginasiRL (1)
VE(REFERENCE)
COORDINATES
ERIA=CUTOFF(INCLUDE) TESTPOS(LARGE)
of the test result variable(s) indicate
stronger evidence for a positive
actual state.
actual state is Invaginasi.
Area Under the Curve
Test Result Variable(s): Neutrofil
er Bound r Bound
1,000 ,000 ,000 1,000 1,000
nparametric assumption
sis: true area = 0.5
Coordinates of the Curve
Test Result Variable(s): Neutrofil
ater Than or Equal
Toa itivity Specificity
78,50 ,457 ,000
consecutive ordered observed test values.
katneutrofil * invaginasi Crosstabulation
Crosstabs
Notes
26-JAN-2015 21:05:09
TATISTIK\bedah\IQBAL\data 25 januari
2015\data dr Iqbal 25 jan 2015.sav
orking Data File 55
Handling sing issing values are treated as missing.
ach table are based on all the cases with
valid data in the specified range(s) for all
variables in each table.
tRotavirus jk katgizi katsuku katNSP4
katneutrofil BY inv_Ileo_vs_colo
=AVALUE TABLES
ICS=CHISQ RISK
UNT EXPECTED ROW
UND CELL.
00:00:00,02
00:00:00,05
quested 2
[DataSet1] D:\PROJECT\STATISTIK\bedah\IQBAL\data 25 januari 2015\data dr Iqbal 25 jan 2015.sav
katRotavirus * inv_Ileo_vs_colo
r Association ,513 1 ,474
s 35
) have expected count less than 5. The minimum expected count is 1,71.
ly for a 2x2 table
Risk Estimate
ue
Confidence Interval
wer Upper
katRotavirus (A / -) ,432 ,043 4,366
Ileo_vs_colo = ileum ,901 ,699 1,161
Ileo_vs_colo = colon 2,087 ,261 16,658
s 35
jk * inv_Ileo_vs_colo
85,7% 14,3% 100,0%
) have expected count less than 5. The minimum expected count is 1,43.
ly for a 2x2 table
Risk Estimate
ue
Confidence Interval
wer Upper
jk (Laki-Laki / Perempuan) 1,833 ,257 13,063
Ileo_vs_colo = ileum 1,100 ,781 1,549
Ileo_vs_colo = colon ,600 ,117 3,068
s 35
katgizi * inv_Ileo_vs_colo
Crosstab
_Ileo_vs_colo
tal
m on
t 12,9 2,1 15,0
) have expected count less than 5. The minimum expected count is 2,14.
ly for a 2x2 table
Risk Estimate
ue
Confidence Interval
r katgizi (gizi lebih / Gizi kurang
dan gizi baik) 1,147 ,167 7,898
Ileo_vs_colo = ileum 1,020 ,778 1,337
Ileo_vs_colo = colon ,889 ,169 4,671
s 35
katsuku * inv_Ileo_vs_colo
6,807 1 ,009
est ,049 ,036
r Association 4,772 1 ,029
s 35
) have expected count less than 5. The minimum expected count is 2,29.
ly for a 2x2 table
Risk Estimate
ue
Confidence Interval
wer Upper
TATISTIK\bedah\IQBAL\data 25 januari
2015\data dr Iqbal 25 jan 2015.sav
ETHOD=SIMPLE
TARGET=usia Neutrofil
INPUT=inv_Ileo_vs_colo
CILEVEL=95 CITYPE=PERCENTILE
NSAMPLES=1000
TATISTIK\bedah\IQBAL\data 25 januari
2015\data dr Iqbal 25 jan 2015.sav
Handling sing issing values are treated as missing.
ch analysis are based on the cases with no
missing or out-of-range data for any
variable in the analysis.
UPS=inv_Ileo_vs_colo(1 2)
computed for a split file in the Independent Samples table. The split file is: $bootstrap_split=397.
computed for a split file in the Independent Samples table. The split file is: $bootstrap_split=954.
Group Statistics
o tistic
Bootstrapb
as Error
Confidence Interval
wer Upper
30
5,035 -,345 1,314 1,957 7,069
rwise noted, bootstrap results are based on 1000 bootstrap samples
6 samples
Independent Samples Testa
st for Equality of
Variances t-test for Equality of Means
. led) rence r Difference
nce Interval of the
Difference
are computed for one or more split files
Bootstrap for Independent Samples Test
Error
Confidence Interval
wer Upper
assumed -2,400 -,068b 2,394b -7,713b 1,831b
not assumed -2,400 -,068b 2,394b -7,713b 1,831b assumed ,033 ,002b 1,795b -3,858b 2,814b
not assumed ,033 ,002b 1,795b -3,858b 2,814b
rwise noted, bootstrap results are based on 1000 bootstrap samples
8 samples
katNSP4 * inv_Ileo_vs_colo
Crosstab
_Ileo_vs_colo
tal
5 0 5
) have expected count less than 5. The minimum expected count is ,71.
ly for a 2x2 table
Risk Estimate
ue
Confidence Interval
wer Upper
Ileo_vs_colo = ileum 1,200 1,023 1,408
Crosstabs
Notes
25-JAN-2015 22:59:42
TATISTIK\bedah\IQBAL\data 25 januari
2015\data dr Iqbal 25 jan 2015.sav
orking Data File 55
Handling sing issing values are treated as missing.
ch table are based on all the cases with
valid data in the specified range(s) for
tRotavirus BY NSP4
=AVALUE TABLES
ICS=CHISQ RISK
UNT EXPECTED ROW COLUMN
UND CELL.
katRotavirus * NSP4 Crosstabulation
NSP4
20 8 28
) have expected count less than 5. The minimum expected count is 3,93.
ly for a 2x2 table
Risk Estimate
e
Confidence Interval
NSP4 = ,714 ,565 ,903
s 55
Crosstabs
Notes
25-JAN-2015 23:07:42
TATISTIK\bedah\IQBAL\data 25 januari
2015\data dr Iqbal 25 jan 2015.sav
orking Data File 55
Handling sing issing values are treated as missing.
ch table are based on all the cases with
valid data in the specified range(s) for
tNSP4 BY invaginasi
=AVALUE TABLES
ICS=CHISQ RISK
UNT EXPECTED ROW COLUMN
UND CELL.
katNSP4 * invaginasi Crosstabulation
invaginasi
5 3 8
) have expected count less than 5. The minimum expected count is 2,91.
Risk Estimate
e
Confidence Interval
er Upper
TATISTIK\bedah\IQBAL\data 25 januari
2015\data dr Iqbal 25 jan 2015.sav
orking Data File 35
Handling sing issing values are treated as missing.
ch table are based on all the cases with
valid data in the specified range(s) for all
variables in each table.
tRotavirus katNSP4 BY tipe_invaginasi
=AVALUE TABLES
ICS=CHISQ RISK
UNT EXPECTED ROW COLUMN
UND CELL.
katRotavirus * tipe_invaginasi
tipe_invaginasi
) have expected count less than 5. The minimum expected count is 1,03.
ue
katRotavirus (A / -) a
te statistics cannot be computed. They are
only computed for a 2*2 table without
empty cells.
katNSP4 * tipe_invaginasi
Chi-Square Tests
) have expected count less than 5. The minimum expected count is ,43.
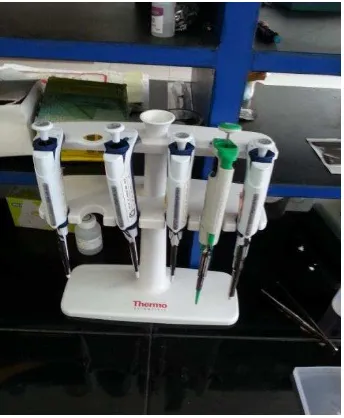
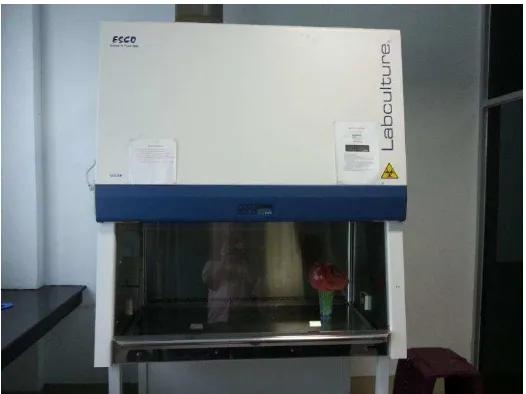
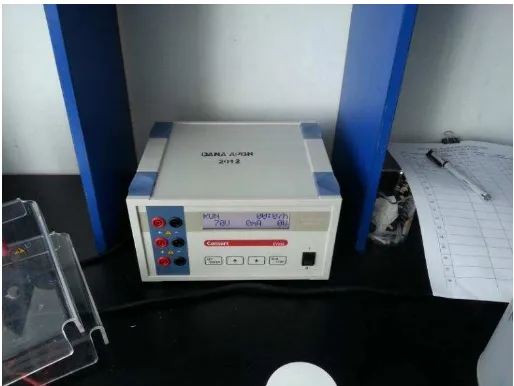
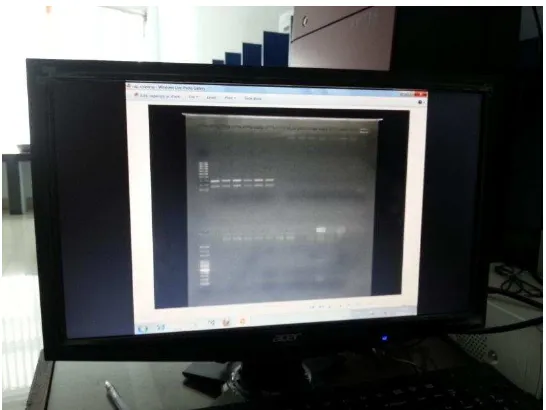
LAMPIRAN 6: DOKUMENTASI PENELITIAN
Gambar a. Micropipette
Gambar c. Thermal Cycler
Gambar e. Chamber Elektroforesis
Gambar g. Gel dari Dokumentasi Sistem
Gambar i. Nanophotometer
Lampiran 7: Keluaran Program Sequence Scanner
....|....| ....|....| ....|....| ....|....| ....|....| ....|....| ....|....|
10 20 30 40 50 60 70
2D ATGGAAAAGC TTACCGACTT CAACTACACA TTGAGTGTAA TCACTCTAAT GAACAGTACA CTACATACAA
8V ... ...C. ... ... ... ... ...
2D TACTGGAGGA TCCAGGGATG GCGTATTTTC CCTATATTGC ATCTGTCCTA ACGGTTTTGT TCACATTGCA
8V ... ... ... ... ... ... ...
2D TAAAGCATCA ATTCCAACAA TGAAAATAGC GTTGAAAACG TCAAAATGTT CGTATAAAGT AGTAAAGTAT
8V ... ... ... ... ... ... ...
9 ... ... ... ... ... ... ...
18 ... ... ... ... ... ... ...
21 ... ... ... ... ... ... ...
51 ... ... ... ... ... ... ...
....|....| ....|....| ....|....| ....|....| ....|....| ....|....| ....|....|
220 230 240 250 260 270 280
2D TGTGTTGTAA CAATTTTTAA CACGTTACTG AAACTAGCAG GTTATAAAGA GCAGATAACT ACTAAAGATG
8V ... ... ... ... ... ... ...
2D AAATAGAAAA ACAAATGGAC AGAGTCGTTA AAGAAATGAG ACGTCAGTTG GAAATGATTG ATAAACTGAC
8V ... ... ... ... ... ... ...
9 ... ... ... ... ... ... ...
2D GAGATAGACA TGACGAAAGA AATTAATCAA AAGAACGTGA AAACGTTAGA AGAATGGGAA AGTGGAAGAA