Vitamin E and Immunity after the Kona
Triathlon World Championship
DAVID C. NIEMAN1, DRU A. HENSON1, STEVEN R. MCANULTY1, LISA S. MCANULTY1, JASON D. MORROW2, ALAA AHMED3, and CHRIS B. HEWARD3
1
Department of Health and Exercise Science, Fischer Hamilton/Nycom Biochemistry Laboratory, Appalachian State University, Boone, NC; 2Departments of Medicine and Pharmacology, Vanderbilt University School of Medicine, Nashville, TN; and3Kronos The Optimal Health Company, Kronos Science Laboratory, Phoenix, AZ
ABSTRACT
NIEMAN, D. C., D. A. HENSON, S. R. MCANULTY, L. S. MCANULTY, J. D. MORROW, A. AHMED, AND C. B. HEWARD. Vitamin E and Immunity after the Kona Triathlon World Championship. Med. Sci. Sports Exerc., Vol. 36, No. 8, pp. 1328 –1335, 2004.
Purpose: To measure the influence of vitamin E ingestion on oxidative stress and immune changes in response to the Triathlon World
Championship in Kona, Hawaii. Methods: Thirty-eight triathletes received vitamin E (VitE) (800 IU·d⫺1
␣-tocopherol) or placebo (Pla) capsules in randomized, double-blind fashion for 2 months before the race event. Blood, urine, and saliva samples were collected the day before the race, 5–10 min postrace, and 1.5 h postrace. Results: Race times did not differ between VitE (N⫽19, 721⫾24 min) and Pla groups (N⫽17, 719⫾27 min, P⫽0.959), and both groups maintained an intensity of⬃80% maximum heart rate during the bike and run portions. Plasma␣-tocopherol was approximately 75% higher in the VitE versus Pla group prerace (24.1⫾1.1 and 13.8⫾1.1mol·L⫺1, P
⬍0.001, respectively) and postrace. Plasma F2-isoprostanes increased 181% versus 97% postrace in the VitE versus Pla groups (P⫽0.044). IL-6 was 89% higher (166⫾28 and 88⫾13 pg·mL⫺1, respectively, P
⫽0.016), IL-1ra was 107% higher (4848⫾1203 and 2341⫾790 pg·mL⫺1, respectively, P
⫽0.057), and IL-8 was 41% higher postrace in the VitE versus Pla groups (26.0⫾3.6 and 18.4⫾2.4 pg·mL⫺1, respectively, P
⫽0.094). Conclusion: These data indicate that vitamin E (800 IU·d⫺1 for 2 months) compared with placebo ingestion before a competitive triathlon race event promotes lipid peroxidation and inflammation during exercise. Key Words: CYTOKINES, F2-ISOPROSTANES, DNA, SALIVARY IGA
H
eavy exertion increases the generation of free rad-icals and reactive oxygen species (ROS) through several pathways including oxidative phosphoryla-tion, increase in catecholamines, prostanoid metabolism, xanthine oxidase, and NAD(P)H oxidase (29). Neutrophils and macrophages migrate to the site of contraction-induced muscle damage, infiltrate the muscle tissue, activate the release of cytokines, and produce additional ROS (3,24). Most ROS are neutralized by a sophisticated antioxidant defense system consisting of a variety of enzymes and nonenzymatic antioxidants including vitamin A, E, and C, glutathione, ubiquinone, and flavonoids (29). Intensive and sustained exercise, however, can create an imbalance be-tween ROS and antioxidants, leading to oxidative stress that can be assessed by measuring lipid peroxidation, protein oxidation, change in status of antioxidant compounds and enzyme activities, and electron spin resonance (16 –19). Less clear is the influence of heavy exertion on oxidativeDNA damage, with some studies reporting increases in DNA damage and strand breakage (11,28), whereas others have found no change in leukocyte or urinary 8-hydroxy-2'-deoxyguanosine (8-OHdG) or 7,8-dihydro-8-oxoguanine (8-oxoG), the most commonly used markers of oxidative DNA modifications (1,25,27).
Vitamin E functions primarily as a nonspecific, chain-breaking antioxidant that prevents the propagation of lipid peroxidation (8). The vitamin is a peroxyl radical scavenger and protects polyunsaturated fatty acids within membranes and in plasma lipoproteins (8). Quantification of F2 -isopros-tanes is the most reliable index of in vivo free-radical gen-eration and oxidative lipid damage (17). The F2 -isopros-tanes are increased in vitamin E-deficiency, and their excretion can be depressed by consuming vitamin E sup-plements (17). Vitamin E plays an important role in the maintenance of immune function, with a marginal defi-ciency impairing immunity, and supplementation with higher than recommended levels enhancing humoral and cell-mediated immunity in the elderly (4). These findings have created interest as to whether or not vitamin E supple-ments may attenuate oxidative stress and immunosuppres-sion during heavy exertion.
Most research has indicated that 1–5 months of vitamin E supplementation (200 –1200 IU·d⫺1
␣-tocopherol) increases plasma levels of␣-tocopherol but has little or no influence on athletic performance or indices of contraction-induced muscle damage (3,6,25), and a variable effect on exercise-induced oxidative stress (12,24,25,29). The equivocal nature
Address for correspondence: David C. Nieman, Dr.P.H., FACSM, Depart-ment of Health & Exercise Science, Appalachian State University, Boone, NC 28608; E-mail: [email protected].
Submitted for publication January 2004. Accepted for publication April 2004.
0195-9131/04/3608-1328
MEDICINE & SCIENCE IN SPORTS & EXERCISE® Copyright © 2004 by the American College of Sports Medicine
of these results are related to research design issues including the timing and mode of exercise, age and fitness levels of the subjects, amount and form of the vitamin E supplement, and methodology for assessing oxidative stress (24,29).
The effect of vitamin E supplementation on the inflam-matory and immune response to intensive and prolonged exercise is largely unstudied and equivocal (5,21,26). The relationship between ROS and immunity is still being de-scribed, but mounting evidence suggests a linkage (9,18,19). IL-10 has emerged as an anti-inflammatory cytokine with antioxidant properties and has been hypothesized to play a role in gene expression and the biosynthesis of oxidative stress-related cofactors, such as ROS and inflammatory cytokines (9). ROS generation and antioxidant status has been linked to immune alterations in certain disease states and the aging process, but this relationship is largely un-studied within the context of human athletic endeavor (9,15).
In a previous study by our research team, vitamin C supplementation failed to influence exercise-induced oxida-tive stress and perturbations in immunity during an ultra-marathon (19). Vitamin C provides in vivo antioxidant pro-tection primarily as an aqueous-phase peroxyl and oxygen radical scavenger. We reasoned that because vitamin E prevents the propagation of lipid peroxidation, this supple-ment had a higher potential than vitamin C to operate as a countermeasure to exercise-induced changes in lipid peroxi-dation and immunity. The purpose of this study was to measure the influence of vitamin E ingestion on oxidative stress and immune changes after the Triathlon World Cham-pionship in Kona, Hawaii. Thirty-eight triathletes received vitamin E (800 IU·d⫺1
D-␣-tocopherol) or placebo capsules in randomized, double-blind fashion for 2 months before the race event. We hypothesized that within the context of severe exertion, vitamin E supplementation would attenuate exercise-induced increases in inflammatory cytokines, oxi-dative stress, and immune alterations.
METHODS
Subjects.The 2002 Kona Triathlon World
Champion-ship was held October 19, beginning at 7:00 a.m. The race included a 3.9-km ocean swim, 180-km bike race and 42-km run, and was held in Kailua-Kona, Hawaii. Thirty-eight male (N ⫽ 28) and female (N ⫽ 10) triathletes who had qualified for the Kona Triathlon World Championship vol-unteered to be subjects in this study. Informed consent was obtained from each subject, and the experimental proce-dures were in accordance with the policy statements of the American College of Sports Medicine and the institutional review board of Appalachian State University. All but two athletes complied with research requirements and completed the triathlon. The afternoon before the race, subjects com-pleted a questionnaire providing demographic and training data.
Research design and diet records.Thirty-eight
triathletes received vitamin E (800 IU·d⫺1
D-␣-tocopherol) or placebo capsules in randomized, double-blind fashion for
2 months before the race event. This level and duration of supplementation was chosen based on unpublished data from a member of our research team showing that the plasma concentration of F2-isoprostanes was reduced in high-risk subjects at this level but not below (J. D. Morrow, personal communication). The vitamin E softgel capsules contained 400 IU D-␣-tocopherol, gelatin, glycerin, soy-bean oil, and purified water, and the placebo capsules con-tained the same ingredients except for D-␣-tocopherol (Ban-ner Pharmacaps, High Point, NC). Subjects ingested two capsules each day for 2 months before and the day of the race. Blood, urine, and saliva samples were collected the day before the race (4 – 6 p.m.), 5–10 min postrace, and 1.5 h postrace. During the 2-month period of vitamin E/placebo supplementation, subjects followed a diet (from a detailed food list) that prohibited foods or supplements that were high in vitamin E (more than 100 IU·d⫺1
), or vitamin A and C (greater than 200% of recommended levels). Two weeks before the race event, subjects listed all food and beverage intake in a 3-d food record. The athletes’ food records were reviewed by the project dietitians during the first blood-collection session, and were then analyzed using the Food Processor nutrient analysis software program (ESHA Re-search, Salem OR). During the race, subjects ingested food and fluids ad libitum, with a postrace questionnaire used by project dietitians to estimate intake. Subjects were instructed to avoid supplements high in vitamins E or C on the day of the race.
Race performance data. Body mass was measured
the afternoon before the race, 5–10 min postrace, and 1.5 h postrace. A three-site skinfold test was used to determine body composition the afternoon before the race. Environ-mental temperature and humidity data were obtained from the local weather station. During the postrace sample col-lection session, athletes were asked to recall swim, bike, and run race times, and bike and run mean heart rates from their personal heart rate monitors. Total race times were obtained from the race website.
Blood cell counts, hormones, glucose.Blood
sam-ples were drawn from an antecubital vein with subjects in the seated position. Routine complete blood counts (CBC) and serum glucose were performed by a clinical hematology laboratory. Other blood samples were centrifuged in sodium heparin tubes, and plasma was aliquoted, transported in dry ice, and then stored at⫺80°C. Plasma cortisol was assayed in duplicate using a competitive enzyme immunoassay kit provided by R&D Systems, Inc. (Minneapolis, MN) with a minimum detectable cortisol concentration of 1.6 nmol·L⫺1
. The intra-assay coefficient of variation (CV) was less than 10%. Plasma volume changes were estimated using the method of Dill and Costill (7).
Oxidative measurements.Blood samples were
im-mediately centrifuged at 4°C for 10 min. The plasma was aliquoted into cryotubes and snap frozen in liquid nitrogen. Urine and plasma samples were transported on dry ice and then stored at⫺80°C until analysis. Plasma F2-isoprostane, urinary F2-isoprostane, 8-OHdG, and 8-oxoG, and plasma
␣- and␥-tocopherol were analyzed by gas chromatography
mass spectrometry (14), liquid chromatography tandem mass spectrometry (14), and high performance liquid chro-matography (10), respectively. All urine measures were normalized by expressing results as a ratio to creatinine. Lipid hydroperoxides (ROOH) were analyzed using a spec-trophotometric kit proved by Caymen Chemicals (Cat. 705002) (Ann Arbor, MI). The interassay CV was less than 5% and intra-assay CV less than 10%.
Lymphocyte subsets.The proportions of T cells
(CD3⫹), B cells (CD19⫹), natural killer (NK) cells
(CD3⫺CD16⫹CD56⫹) and activated T-cells (CD69⫹) were
determined in whole blood preparations and absolute num-bers calculated using CBC data to allow group comparisons of lymphocyte subset concentrations. Lymphocyte pheno-typing was accomplished by two-color fluorescent labeling of cell surface antigens with mouse anti-human monoclonal antibodies conjugated to fluorescein-isothiocyanate (FITC) and phycoerythrin (PE) using Simultest™ reagents (Becton Dickinson Immunocytometry Systems, San Jose, CA). For immunophenotyping, 60-L aliquots of heparinized whole blood from each sample were added to five wells of a 96-well plate. Sixty microliters of CD3/CD16⫹CD56 (BD, cat. 340042), CD3/CD19 (BD, cat. 349211), CD45/CD14 (BD, cat. 340040), CD69 (BD, cat. 341652) or␥1␥2a iso-type control (BD, cat. 340041) were added to the wells, and the samples were incubated in the dark for 20 min on ice with orbital shaking (170 rpm). The cells were then washed with 130 L of phosphate-buffered saline (PBS) and the plate was centrifuged for 5 min at 1500⫻g. The red blood cells were lysed by adding 200 L of 1X FACS Lysing Solution (BD, cat. 349202) for 10 min in the dark, and the cells were pelleted by centrifugation. The lysing step was repeated, the cells washed in 200 L of PBS, and the resulting cell pellet was fixed in 200L of CytofixTMbuffer (BD, cat. 554655). Samples were kept at 4°C in the dark until analyzed by flow cytometry at the Immunogenetics Laboratory with the VA–San Diego Health Care System.
Cytokine measurements.Total plasma
concentra-tions of interleukin-1 receptor antagonist (IL-1ra), interleu-kin-6 (IL-6), interleukin-8 (IL-8), and interleukin-10 (IL-10) were determined using quantitative sandwich ELISA kits provided by R&D Systems, Inc. All samples and provided standards were analyzed in duplicate. A high sensitivity kit was used to analyze IL-6 in the prerace plasma samples. A standard curve was constructed using standards provided in the kits and the cytokine concentrations were determined from the standard curves using linear regression analysis. The assays were a two-step “sandwich” enzyme immuno-assay in which samples and standards were incubated in a 96-well microtiter plate coated with polyclonal antibodies for the test cytokine as the capture antibody. After the appropriate incubation time, the wells were washed and a second detection antibody conjugated to either alkaline phosphatase (IL-6 high sensitivity) or horseradish peroxi-dase (IL-1ra, IL-6, IL-8, IL-10) was added. The plates were incubated and washed, and the amount of bound enzyme-labeled detection antibody was measured by adding a chro-mogenic substrate. The plates were then read at the
appro-priate wavelength (450 ⫺ 570 nm for IL-1ra, IL-6, IL-8, IL-10; 490⫺650 nm for IL-6 high sensitivity). The mini-mum detectable concentration of IL-1ra was⬍22 pg·mL⫺1
, IL-6 ⬍ 0.70 pg·mL⫺1
, IL-6 high sensitivity ⬍0.039 pg·mL⫺1
, IL-8⬍10 pg·mL⫺1
, and IL-10⬍3.9 pg·mL⫺1 . The intra-assay CV was less than 5% for all cytokines.
Salivary samples.Unstimulated saliva was collected
by expectoration into 15-mL plastic, sterilized vials for 4 min. Participants were urged to pass as much saliva as possible into the vials during the 4-min timed session. The saliva samples were centrifuged for 5 min at 200 ⫻ g, immediately frozen and then transported in dry ice, and stored at⫺80°C until analysis. Saliva volume was measured to the nearest 0.1 mL, and salivary IgA was measured by an enzyme linked immunosorbent assay according to proce-dures used in our laboratory in previous studies (18). The data were expressed as sIgA secretion rate (g·min⫺1
). The intra-assay CV was less than 10% for sIgA concentration.
Statistical analysis.Statistical significance was set at
the P ⬍ 0.05 level, and values expressed as mean ⫾ SE. Vitamin E and placebo groups were compared for subject characteristics and race performance measures using inde-pendent t-tests (Tables 1 and 2). Leukocyte subset counts, oxidative and cytokine measures, and hormone values were analyzed using 2 (vitamin E and placebo groups)⫻3 (times of measurement) repeated measures ANOVA. When Box’ s M suggested that the assumptions necessary for the univar-iate approach were not tenable, a multivarunivar-iate approach to repeated measures ANOVA was used. In the latter case, the Pillais trace statistic was used as the test statistic. If the group ⫻time interaction P value was ⱕ 0.05, the change from prerace for the postrace and 1.5-h postrace values was calculated and compared between groups using Student’s t-tests. For these two multiple comparisons across groups, a Bonferroni adjustment was made with statistical signifi-cance set at P ⬍ 0.025. Pearson product-moment correla-tions were used to test the relacorrela-tionship between postrace measures.
RESULTS
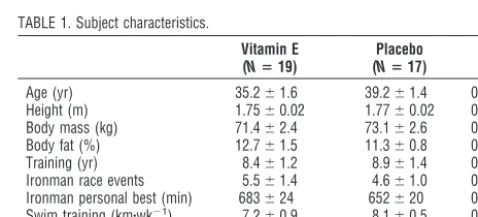
All but two athletes complied with research requirements and completed the Kona Triathlon World Championship race event (N ⫽ 36). Subject characteristics are listed in Table 1 for the vitamin E (N⫽19, 12 males and 7 females) and placebo (N⫽17, 14 males and 3 females) groups. No
TABLE 1. Subject characteristics. Ironman personal best (min) 683⫾24 652⫾20 0.326 Swim training (km䡠wk⫺1) 7.2
⫾0.9 8.1⫾0.5 0.38 Run training (km䡠wk⫺1) 50.1
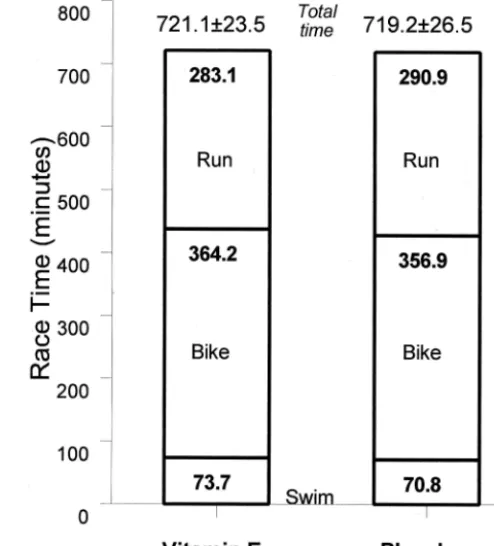
significant group differences were found for basic demo-graphic and training characteristics. Race times did not differ between vitamin E (721 ⫾ 24 min) and placebo groups (719⫾27 min, P⫽0.959) (Fig. 1). Subjects in the vitamin E and placebo groups maintained an intensity of ⬃80% maximum heart rate during the bike (145⫾ 3 and 146⫾2 beats·min⫺1
, P⫽0.780) and run (143⫾4 and 148 ⫾3 beats·min⫺1
, P⫽0.233) portions, respectively. Ambi-ent temperature and relative humidity measured 26°C and 89% at 7:00 am when the race event started, 29°C and 74% from noon to 3:00 p.m., 27°C and 79% at 6:00 p.m., and 26°C and 78% at midnight when the race was stopped. For all subjects combined, body mass was 72.2 ⫾ 2.5 kg the afternoon before the race event, and 70.8⫾ 2.4 kg at race end (mean decrease, 1.4 ⫾ 0.3 kg), and plasma volume decreased 1.5⫾0.6% (no significant differences were mea-sured between groups).
Energy and macronutrient intake did not differ between groups and averaged 3069 ⫾ 174 kcal·d⫺1
(55.2 ⫾ 1.6% carbohydrate, 27.9⫾1.3% fat, and 17.0⫾0.9% protein) 2 wk before the race event, 4393 ⫾344 kcal (88.2 ⫾ 1.5% carbohydrate, 6.4 ⫾ 0.8% fat, and 5.2 ⫾ 0.5% protein) during the race event, and 696 ⫾ 93 kcal (55.0 ⫾ 2.4% carbohydrate, 31.4⫾ 2.2% fat, and 16.2 ⫾ 1.3% protein) during the 1.5-h postrace period. Data from the 3-d dietary record obtained before the race demonstrated that vitamin E intake (including the supplement) was 894⫾36 and 75.2⫾ 27.8 IU·d⫺1
in the vitamin E and placebo groups, respec-tively (P⬍ 0.001). During the race, vitamin E intake was 968⫾ 50 and 378⫾122 IU in the vitamin E and placebo groups, respectively (P⬍0.001). Vitamin C intake was 209 ⫾42 and 246⫾52 mg·d⫺1
2 wk before the race event, and 349⫾ 96 and 784⫾ 183 mg during the race event in the vitamin E and placebo groups, respectively (P⫽0.581 and 0.046, respectively).
Plasma␣-tocopherol was 75% higher in the vitamin E vs placebo group prerace, and this group difference was
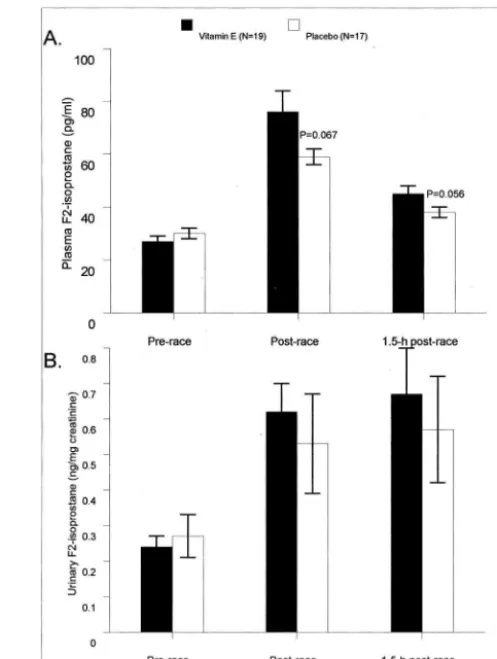
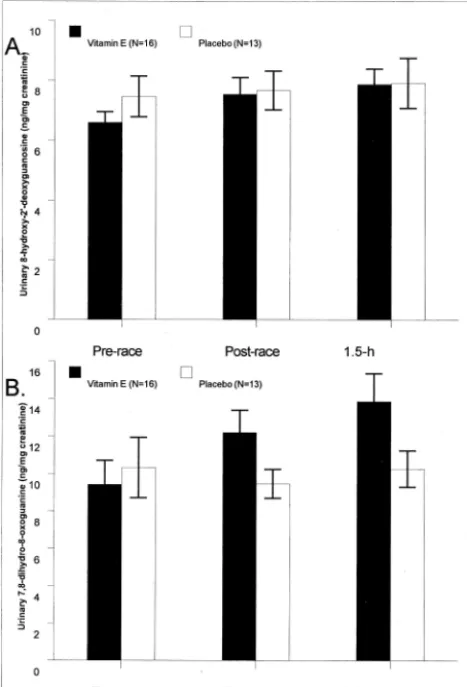
main-tained postrace (group main effect, P ⬍ 0.001) (Fig. 2A). Plasma␥-tocopherol, on the other hand, was 58% lower in the vitamin E versus placebo groups before and postrace (group main effect, P ⬍ 0.001) (Fig. 2B). Plasma F2 -isoprostanes increased 181% versus 97% postrace in the vitamin E versus placebo groups (interaction effect, P ⫽ 0.044) (Fig. 3A). Urine F2-isoprostanes also increased pos-trace (132% for all subjects), but the pattern of change did not differ between groups (P ⫽ 0.651) (Fig. 3B). The pattern of change in plasma lipid hydroperoxides tended to differ between groups (interaction effect, P ⫽ 0.065) and was 2.21 ⫾0.40, 2.08⫾0.42, and 3.05⫾0.46 compared with 2.15⫾0.57, 2.18⫾0.53, and 1.38⫾0.35mol·L⫺1 in the vitamin E and placebo groups prerace, postrace, and 1.5 h postrace, respectively. The 1.5-h postrace values dif-fered significantly between groups (P⫽0.009). No signif-icant changes in urinary 8-OHdG and 8-oxoG were mea-sured after the race event (time effects, P ⫽ 0.151 and 0.124, respectively), and no differences were noted between vitamin E and placebo groups (Fig. 4A&B).
Total blood leukocyte, neutrophil, and monocyte counts rose significantly after the race event (P ⬍0.001), but the patterns of change did not differ between the groups (Fig. 5A). Total blood lymphocyte, T lymphocytes, and natural killer lymphocytes decreased significantly after the race event (P⬍0.001), but the patterns of change did not differ between the groups (Fig. 5B). B lymphocytes increased slightly and were significant in both groups (P ⬍ 0.001) (Fig. 5B). CD69 T lymphocytes dropped slightly but sig-nificantly in both groups (P⫽ 0.047) (Table 2).
FIGURE 1— Race times for the swim, bike, and run portions of the race did not differ significantly between vitamin E and placebo groups (Pⴝ0.959).
TABLE 2. Serum glucose, plasma cortisol, and immune measures.
Vitamin E (Nⴝ19)
Placebo (Nⴝ17)
PValues: Group; Interaction; Time
Serum glucose (mmol䡠L⫺1)
Prerace 4.87⫾0.16 4.70⫾0.15 0.034; 0.08;⬍0.001 Postrace 5.84⫾0.24 6.68⫾0.19
1.5 h postrace 6.24⫾0.18 6.61⫾0.25 Plasma cortisol (nmol䡠L⫺1)
Prerace 570⫾200 270⫾50 0.491; 0.100;⬍0.001 Postrace 1300⫾306 2227⫾576
1.5 h postrace 1305⫾392 1117⫾250 IL-10 (pg䡠mL⫺1)
Prerace 4.3⫾0.7 5.7⫾0.8 0.432; 0.488;⬍0.001 Postrace 63.0⫾11.9 49.4⫾12.0
1.5 h postrace 37.2⫾7.0 28.3⫾7.9 IL-8 (pg䡠mL⫺1)
Prerace 3.3⫾1.0 1.7⫾0.7 0.079; 0.166;⬍0.001 Postrace 26.0⫾3.6 18.4⫾2.4
1.5 h postrace 18.3⫾2.5 12.8⫾2.1 CD69 cell count (109䡠L⫺1)
Prerace 0.020⫾0.003 0.021⫾0.002 0.679; 0.776; 0.047 Postrace 0.023⫾0.004 0.020⫾0.004
1.5 h postrace 0.015⫾0.002 0.014⫾0.004 Salivary IgA secretion rate (g䡠min⫺1)
Prerace 186⫾18 195⫾17 0.406; 0.879;⬍0.001 Postrace 106⫾17 116⫾17
1.5 h postrace 109⫾12 131⫾15
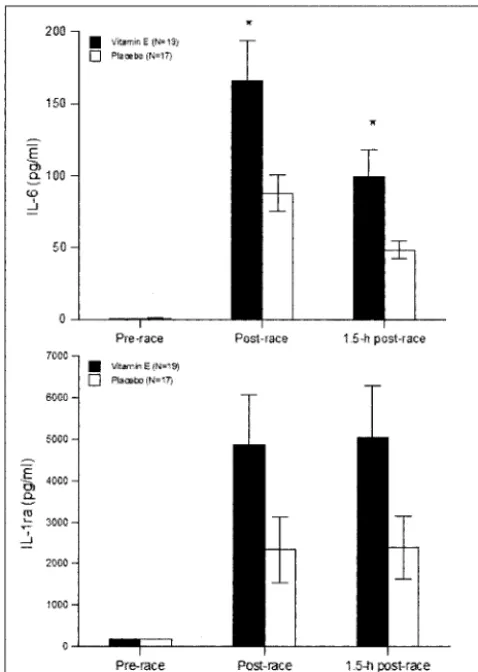
Plasma cortisol rose strongly in both groups following the race event, but the pattern of change did not differ between groups (P ⫽0.100), and the group main effect was not sig-nificant (P ⫽ 0.491) (Table 2). Serum glucose rose signifi-cantly postrace in both groups, and there was a nonsignificant tendency for higher postrace levels in the placebo group (Table 2). Increases in plasma IL-6, IL-1ra, IL-8, and IL-10 were measured in all subjects following the race (P⬍0.001) (Figs. 6A and B, Table 2). Group main effects and interaction effects were P⫽0.017 and P⫽0.059 for IL-6, respectively, and P⫽ 0.089 and P⫽0.057 for IL-1ra, respectively (Fig. 6). IL-6 was 89% higher (166⫾28 and 88⫾13 pg·mL⫺1
, respectively, P ⫽0.016), IL-1ra was 107% higher (4848⫾1203 and 2341⫾ 790 pg·mL⫺1
, respectively, P ⫽ 0.057), and IL-8 was 41% higher (26.0⫾3.6 and 18.4⫾2.4 pg·mL⫺1
, respectively, P⫽ 0.094), postrace in the vitamin E versus placebo group. The salivary IgA secretion rate decreased significantly by 42% following the race, but the pattern of change did not differ between groups (Table 2).
Immediately postrace, plasma ␣-tocopherol levels were positively correlated with plasma IL-6 (r⫽0.41, P⫽0.013) but not IL-1ra (r⫽0.19, P⫽ 0.278), IL-8 (r⫽0.29, P⫽ 0.091), IL-10 (r⫽0.29, P⫽0.082), or plasma F2 -isopros-tanes (r ⫽ 0.23, P ⫽ 0.185). ␥-tocopherol levels were
negatively correlated with IL-6 (r ⫽ ⫺0.41, P ⫽ 0.014) immediately postrace. Immediately postrace, plasma F2 -isoprostanes were significantly correlated with plasma IL-6 (r ⫽ 0.56, P ⬍ 0.001), IL-8 (r ⫽ 0.56, P ⬍ 0.001), and IL-1ra (r⫽0.53, P⬍0.001) but not IL-10 (r⫽0.30, P⫽ 0.076).
DISCUSSION
Contrary to our hypothesis, 2 months of ␣-tocopherol supplementation did not attenuate increases in plasma cy-tokines, changes in blood leukocyte subsets, decreases in salivary IgA output, or oxidative stress in athletes compet-ing in the Triathlon World Championship in Kona, Hawaii. Unexpectedly, plasma F2-isoprostanes increased nearly two-fold, and IL-6, IL-1ra, and IL-8 were markedly higher in the vitamin E compared with placebo group. Athletes with the highest plasma␣-tocopherol levels had the highest postrace levels of plasma IL-6. Plasma cytokine levels in the vitamin E group far exceeded levels we have previously reported in subjects after competitive 42.2-km marathon race events, whereas levels in the placebo group were similar to post-marathon race values (20).
FIGURE 2—A and B. Plasma␣-tocopherol was significantly higher and␥-tocopherol lower in the vitamin E compared with placebo group before and after the race (group main effects, P<0.001). ** P<0.001, vitamin E compared with placebo group at time point.
FIGURE 3—A and B. The pattern of change in plasma F2-isoprostanes
was significantly different between vitamin E and placebo groups (interaction effect, P ⴝ 0.044) (A). Numbers above bars represent student t-test P values for the change from prerace between groups. Urinary F2-isoprostanes also increased postrace, but the pattern of
There is increasing evidence that depending on the dose and experimental conditions, vitamin E can exert antioxi-dant, neutral, or pro-oxidant effects (8,23). High doses of
␣-tocopherol combined with high oxidative stress may cre-ate␣-tocopherol radicals that may initiate processes of lipid peroxidation by themselves (23). When antioxidant net-works are balanced, however, this pro-oxidant action of vitamin E radicals is inhibited by co-antioxidants such as vitamin C that can reduce the radical back to vitamin E (8,23). The athletes in this study avoided vitamin C supple-ments but still ingested high amounts of vitamin C (about 3 times recommended levels) and other nutrients, but this intake may have been insufficient to inhibit vitamin E pro-oxidant effects given the high dose of vitamin E consumed and the extreme physiological and oxidative stress expe-rienced during the race. Vitamin C intake was substan-tially higher in the placebo group during the race for no apparent reason other than random outcome, but we do not know if this influenced our results. In previous stud-ies by our team, vitamin C compared with placebo sup-plements did not counter exercise-induced oxidative and immune changes (19).
Of the eight naturally occurring forms of vitamin E, only the␣-tocopherol form of the vitamin is maintained in human
plasma (8). Other naturally occurring forms of vitamin E including␥-tocopherol do not contribute toward meeting the vitamin E requirement established by the Food and Nutri-tion Board of the Institute of Medicine because they are not converted to ␣-tocopherol by humans and are poorly rec-ognized by the␣-tocopherol transfer protein in the liver (8). Nonetheless,␥-tocopherol is a major form of vitamin E in U.S. diets and has important physiological functions in the body. Recent evidence indicates that␥-tocopherol inhibits pro-inflammatory prostaglandin E2 and leukotriene B4, de-creases TNF-␣ and 8-isoprostane production, and in gen-eral, attenuates inflammation-mediated damage (13). In our study, athletes in the vitamin E group experienced signifi-cantly reduced plasma ␥-tocopherol levels, and this may have contributed to the pro-oxidative and pro-inflammatory changes measured postrace. It is unclear, however, by what mechanisms a reduction in plasma ␥-tocopherol levels might have promoted an increase in markers of oxidative stress and inflammation after exercise.
Our findings of increased plasma and urinary F2 -isopros-tane and plasma lipid hydroperoxides are indicative of in-creased oxidative stress. These observations are similar to
FIGURE 4 —A and B. No changes in urinary 8-OHdG and 8-oxoG were measured after the race event (time effects, Pⴝ0.151 and 0.124, respectively).
FIGURE 5—A and B. Total blood leukocyte (denoted by numbers at the top of the bars), neutrophil, and monocyte counts rose significantly after the race event (time effect, P<0.001), but the patterns of change did not differ between the groups (A). Total blood lymphocyte (de-noted by numbers at the top of the bars), T lymphocytes, and natural killer lymphocytes decreased significantly following the race event (P <0.001), and B lymphocytes increased (P<0.001), but the patterns of change did not differ between the groups (B).
those we have previously reported in two studies of athletes competing in ultramarathon races (18,19). Lipid hydroper-oxides originate primarily from oxidation of omega-3 and omega-6 fatty acids found in lipoproteins, and F2-isopros-tane from arachidonic fatty acids esterified in phospholipids (17,29). Triathletes with the highest plasma F2-isoprostanes levels recorded the highest plasma concentrations of IL-6, IL-1ra, and IL-8. Oxidative stress factors may interact with certain immune function factors during disease and immu-nosenescence and act as one mediator of inflammation by inducing apoptosis of leukocytes and biosynthesis of in-flammatory cytokines (15). Little is known regarding the link between oxidative stress and immune changes induced by long-duration and high-intensity aerobic exercise. In mice, lymphocyte damage after exhaustive running has been related to oxidative damage in lymphoid tissues (2). A link between oxidative stress and suppression of cellular
immu-nity has been described in men after intense, short bouts of exercise (30). In previous studies of ultramarathoners, we reported a weak but significant correlation between F2 -isoprostane and IL-10 (18,19), a finding supported in the present study. Redox- and oxidant-mediated pathways play a role in the expression, distribution, and functional prop-erties of IL-10, and this cytokine and other antiinflammatory cytokines may emerge as important links between oxidative stress and inflammatory processes during intensive and pro-longed exercise (9).
Despite the extreme exercise stress experienced by the triathletes in this study, no significant increases were mea-sured in DNA oxidative stress using urinary 8-OHdG and 8-oxoG, and no differences were measured between vitamin E and placebo groups. Hartmann and Niess (11) reported that vitamin E supplementation over a 2-wk period reduced the exercise-induced DNA damage measured in subjects running on treadmills to exhaustion. Other investigators have found no evidence of DNA oxidative damage after heavy exertion, but differences in methodology have made comparison between studies difficult (1,25,27). Ra´dak et al. (22) have shown that DNA repair enzymes are up-regulated in human skeletal muscle after a marathon race, protecting the athlete against excessive DNA damage. Our data suggest that world class triathletes do not show evidence of in-creased DNA oxidative stress using urinary 8-OHdG and 8-oxoG after ⬃12 h of intensive competition.
In summary, 2 months of vitamin E supplementation at a dose of 800 IU·d⫺1␣-tocopherol did not attenuate increases in plasma cytokines, perturbations in other measures of immunity, or oxidative stress in triathletes competing in the Triathlon World Championship race event. To the contrary, athletes in the vitamin E compared with placebo group experienced greater lipid peroxidation and increases in plasma levels of several cytokines after the triathlon. De-spite these indications that vitamin E exerted pro-oxidant and pro-inflammatory effects, race performance did not differ between athletes in the vitamin E and placebo groups. Further research is warranted, however, to measure the potential effect of frequent large-dose vitamin E supplemen-tation on the long-term health status of ultra-athletes.
We express appreciation to several individuals for their assis-tance in this study: Jeff Zachwieja, Kris Osterberg, the Gatorade Team, Laura Benezra, Cathy Nieman, Rebecca Bailey, Mary Whit-lock, Linda Robinson, and Penny Mack.
This study was supported by a grant from the Gatorade Sports Science Institute.
Jason D. Morrow is supported by NIH grants GM15431, CA77839, and DK48831, and is the recipient of a Burroughs Well-come Fund Clinical Scientist Award in Translational Research.
REFERENCES
1. ALMAR, M., J. G. VILLA, M. J. CUEVAS, J. A. RODRIGUEZ-MARROYO,
C. AVILA, and J. GONZALEZ-GALLEGO. Urinary levels of 8-hy-droxydeoxyguanosine as a marker of oxidative damage in road cycling. Free Radic. Res. 36:247–253, 2002.
2. AZENABOR, A. A., and L. HOFFMAN-GOETZ. Intrathymic and intrasplenic oxidative stress mediates thymocyte and
spleno-cyte damage in acutely exercised mice. J. Appl. Physiol. 86: 1823–1827, 1999.
3. BEATON, L. J., D. A. ALLAN, M. A. TARNOPOLSKY, P. M. TIIDUS, and
S. M. PHILLIPS. Contraction-induced muscle damage is unaffected by vitamin E supplementation. Med. Sci. Sports Exerc. 34:798 – 805, 2002.
4. BEHARKA, A., S. REDICAN, L. LEKA, and S. N. MEYDANI. Vitamin E
status and immune function. Methods Enzymol. 282:247–263, 1997. 5. CANNON, J. G., S. N. MEYDANI, R. A. FIEDLING, et al. Acute phase
response to exercise. II. Associations between vitamin E, cytokines, and muscle proteolysis. Am. J. Physiol. 260:R1235–R1240, 1991. 6. DAWSON, B., G. J. HENRY, C. GOODMAN, et al. Effect of vitamin C
and E supplementation on biochemical and ultrastructural indices of muscle damage after a 21 km run. Int. J. Sports Med. 23:10 –15, 2002.
7. DILL, D. B., and D. L. COSTILL. Calculation of percentage changes
in volumes of blood, plasma, and red cells in dehydration. J. Appl.
Physiol. 37:247–248, 1974.
8. FOOD ANDNUTRITIONBOARD, INSTITUTE OFMEDICINE. Dietary Refer-ence Intakes for Vitamin C, Vitamin E, Selenium, and Carotenoids.
Washington, DC: National Academy Press, 2000, pp. 186 –217. 9. HADDAD, J. J., and C. S. FAHLMAN. Redox- and oxidant-mediated
regulation of interleukin-10: an anti-inflammatory, antioxidant cytokine? Biochem. Biophys. Res. Commun. 297:163–176, 2002. 10. HAIDARI, M., F. JAVADI, M. KADKHODAEE, and A. SANATI. Enhanced
susceptibility to oxidation and diminished vitamin E content of LDL from patients with stable coronary artery disease. Clin.
Chem. 47:1234 –1240, 2001.
11. HARTMANN, A., and A. M. NIESS. Vitamin E prevents
exercise-induced DNA damage. Mutat. Res. Lett. 346:195–202, 1995. 12. ITOH, H., T. OHKUWA, Y. YAMAZAKI, et al. Vitamin E
supplemen-tation attenuates leakage of enzymes following 6 successive days of running training. Int. J. Sports Med. 21:369 –374, 2000. 13. JIANG, Q., and B. N. AMES. Gamma-tocopherol, but not
alpha-tocopherol, decreases proinflammatory eicosanoids and inflamma-tion damage in rats. FASEB J. 17:816 – 822, 2003.
14. LIANG, Y., P. WEI, R. W. DUKE, et al. Quantification of
8-iso-prostaglandin-F2␣and 2–3-dinor-8-iso-prostaglandin-F2␣in hu-man urine using liquid chromatography-tandem mass spectrome-try. Free Radic. Biol. Med. 34:409 – 418, 2003.
15. LIN, Y., R. HUANG, N. SANTANAM, Y. G. LIU, S. PARTHASARATHY,
and R. P. HUANG. Profiling of human cytokines in healthy indi-viduals with vitamin E supplementation by antibody array. Cancer
Lett. 187:17–24, 2002.
16. MASTALOUDIS, A., S. W. LEONARD, and M. G. TRABER. Oxidative
stress in athletes during extreme endurance exercise. Free Radic.
Biol. Med. 31:911–922, 2001.
17. MORROW, J. D., and L. J. ROBERTS. The isoprostanes: unique
bioactive products of lipid peroxidation. Prog. Lipid Res. 36:1–21, 1997.
18. NIEMAN, D. C., C. L. DUMKE, D. A. HENSON, et al. Immune and
oxidative changes during and following the Western States En-durance Run. Int. J. Sports Med. 24:541–547, 2003.
19. NIEMAN, D. C., D. A. HENSON, S. R. MCANULTY, et al. Influence of vitamin C supplementation on oxidative and immune changes following an ultramarathon. J. Appl. Physiol. 92:1970 –1977, 2002.
20. NIEMAN, D. C., D. A. HENSON, L. L. SMITH, et al. Cytokine changes
after a marathon race. J. Appl. Physiol. 91:109 –114, 2001. 21. PETERSEN, E. W., K. OSTROWSKI, T. IBFELT, et al. Effect of vitamin
supplementation on cytokine response and on muscle damage after strenuous exercise. Am. J. Physiol. Cell Physiol. 280:C1570 – C1575, 2002.
22. RADAK´ Z., P. APOR, J. PUCSUK, et al. Marathon running alters the
DNA base excision repair in human skeletal muscle. Life Sci. 72:1627–1633, 2003.
23. RIETJENS, I. M. C. M., M. G. BOERSMA, L.DEHAAN, et al. The pro-oxidant chemistry of the natural antioxidants vitamin C, vita-min E, carotenoids and flavonoids. Environ. Toxicol. Pharmacol. 11:321–333, 2002.
24. SACHECK, J. M., and J. B. BLUMBERG. Role of vitamin E and oxidative stress in exercise. Nutrition 17:809 – 814, 2001. 25. SACHECK, J. M., P. E. MILBURY, J. G. CANNON, R. ROUBENOFF, and
J. B. BLUMBERG. Effect of vitamin E and eccentric exercise on
selected biomarkers of oxidative stress in young and elderly men.
Free Radic. Biol. Med. 34:1575–1588, 2003.
26. SINGH, A., D. A. PAPANICOLAOU, L. L. LAWRENCE, E. A. HOWELL,
G. P. CHROUSOS, and P. A. DEUSTER. Neuroendocrine responses to
running in women after zinc and vitamin E supplementation. Med.
Sci. Sports Exerc. 31:536 –542, 1999.
27. SUMIDA, S., K. OKAMURA, T. DOI, M. SAKURAI, Y. YOSHIOKA, and Y. SUGAWA-KATAYAMA. No influence of a single bout of exercise on urinary excretion of 8-hydroxy-deoxyguanosine in humans.
Bio-chem. Mol. Biol. Int. 42:601– 609, 1997.
28. TSAI, K., T. G. HSU, K. M. HSU, et al. Oxidative DNA damage in human peripheral leukocytes induced by massive aerobic exercise.
Free Radic. Biol. Med. 31:1465–1472, 2001.
29. URSO, M. L., and P. M. CLARKSON. Oxidative stress, exercise, and
antioxidant supplementation. Toxicology 189:41–54, 2003. 30. VIDER, J., J. LEHTMAA, T. KULLISAAR, et al. Acute immune response
in respect to exercise-induced oxidative stress. Pathophysiology 7:263–270, 2001.