Gadjah Mada International Journal of Business September-December 2010, Vol. 12, No. 3, pp. 415–434
Supriyadi*
Faculty of Economics and Business, Universitas Gadjah Mada, Yogyakarta, Indonesia
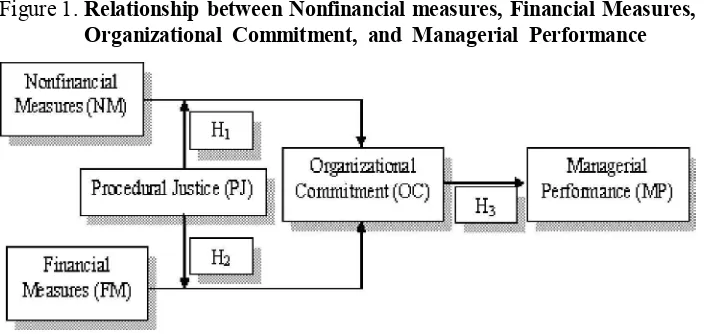
This study extends prior studies on the effectiveness of the Balanced Scorecard (BSC) to improve managerial performance done by Lau and Mosser (2008) and Lau and Sholihin (2005). Specifically, the study empirically tests the moderating effects of procedural justice on the relationship between the financial and nonfinancial dimensions of BSC and managerial performance. It also tests the impact of organizational commitment on performance. Based on survey data from 76 respondents, the results indicate that perceived procedural justice in the use financial and nonfinancial dimensions of the BSC is associated with managers’ organizational commitment. It further finds that organizational commitment is positively related to performance. The study extends the literature by providing empirical evidence about the moderating effect of procedural justice on the relationship between the financial and nonfinancial dimensions of BSC and organizational commitment.
THE MODERATING EFFECT OF
PROCEDURAL JUSTICE ON THE
EFFECTIVENESS OF THE BALANCED
SCORECARD IN IMPROVING MANAGERIAL
PERFORMANCE THROUGH
ORGANIZATIONAL COMMITMENT
Keywords:balanced scorecard; organizational commitment; financial measures; managerial performance; moderating effect; nonfinancial measures; procedural justice
Introduction
Since Kaplan and Norton (1992) introduced the balanced scorecard (BSC), more companies have replaced US Fortune 1000 firms. Kaplan and Norton (2001) also report that the BSC has been adopted by not only profit-oriented organizations, but also non-profit organizations and government entities. Moreover the results of an unpublished survey conducted by the
The purposes of this study is to examine the moderating effect of pro-cedural justice on the effectiveness of employing the financial and nonfinan-cial dimensions of BSC as managers’ performance measures in improving managerial performance. The study extends Lau and Sholihin (2005) study and completes Lau and Moser’s study (2008) by evaluating the moderating effect of procedural justices on the relationship between the BSC mea-sures and organizational commitment.
Procedural justice is expected to strengthen the effect of employing the ploying the four perspectives of the BSC measure in judging managerial performance. Using the structural equa-tion analysis, they map the direct and indirect relationships between nonfi-nancial measures (three of the four
subjective and bias measures. On the other hand, Lau and Mosser (2008) indicated that nonfinancial measures represent complete and accurate mea-sures and, that why they are perceived more fair than financial measures, which represent narrow and rigid mea-sures.
Furthermore, since evaluating managerial performance is a process, then the fairness in evaluation proce-dures will be perceived through the length of the evaluation process and that is why the fairness of the proce-dures might be gradually perceived during the process, not as a conse- quence of the process. Hence, the fair- ness in evaluation process is not medi-ating but moderating the relationship between the BSC measures and manager’s job satisfaction, as ex-plained by the contingency theory (Fiedler 1983). The second objective of this study is to address this issue by evaluating the moderating effect of procedural justice on the effectiveness of the BSC performance measures.
Finally, the last objective of the study is to investigate the relationships of the variables of interests using mul-tiple regression approach since the theory (contingency theory) and logi-procedural fairness, organizational commitment, and managerial
perfor- mance using structural equation analy-sis. They find significant relationships among variables, but in fact their rela-tionships model among variables is complicated and is difficult to inter-pret to the real business conditions.
The study conducts surveys using 76 part-time MBA students at Gadjah Mada University as a sample. First, it predicts that procedural justice will strengthen the positive relationship between nonfinancial (financial) mea-sures and organizational commitment. Second , it also expects that organiza- tional commitment will positively af- fect managerial performance. The re-sults of the study show that managers’ perceptions on the procedural justice of the use of the financial and nonfi-nancial dimensions of BSC signifi- cantly strengthen the relationship be-tween nonfinancial measures and or-ganizational commitment (supporting Lau and Moser 2008), and between financial measures and organizational commitment (supporting Lau and Sholihin 2005). Finally, the study also finds that the relationship between or-ganizational commitment and mana-gerial performance is positive.
Literature Review and
Hypothesis Development
The Balance Scorecard
The BSC system provides a com-plete view of business unit perfor-mance based on a set of financial and non-financial measures, namely finan-cial, customer relationships, internal business processes, and learning and growth performances. Kaplan and Norton (1996a) include a diverse set of performance measures in order to completely derive the business unit strategy into a cause-and-effects rela-measures) and specific measures to each business unit (unique measure), Slovic and McPhillamy (1974) sug-gest that decision makers (evaluators) will focus on common measures and underuse of unique measures. Lipe and Salterio (2000) using experimen-tal design conclude that most of the participants only consider common measures, ignoring unique measures when they compare performance of two different business units.
Some factors have been indicated to affect evaluators’ judgmental bias
in assessing managers’ performance using the BSC. Kaplan and Norton (1996b) suggest that the lack of align-ment between compensation and the BSC performance measurement sys-tems may affect the effectiveness of implementing the BSC. Lipe and Salterio’s (2000) experimental re-search concludes that general human to modify or clarify the BSC-based performance evaluation procedures (Liedtka et al. 2008).
Moderating Effect of Procedural
Justice
Procedural justice1 refers to the fairness of the managerial performance measurement process used to judge, evaluate, and reward subordinates’ performance (McFarlin and Sweeney 1992; Lind and Tyler in Lau and Sholihin 2005; and Greenberg 1987). Procedural justice theory is expanded from the equity theory for resource allocation process (Greenberg 1987). Similarly, Laventhal (1980) suggests that fairness of the judgmental process toward decision-making will be re-flected into the procedural justice of the decision process. That is, proce-dural fairness refers to fairness of the rate information, non-bias decision maker, and conformity to moral val-ues.
Earlier studies documented that there are various ways to relate the effects of procedural justice on mana-tice, is independently related to atti-
tude toward the decision and the orga-nization. On the other hand, Korsgaard and Roberson (1995) found that re-gardless of the fairness of the decision, procedural justice will promote posi-tive behavior of the related parties. Based on a meta-analysis of twenty- five years of organizational justice re- searches, Colquitt et al. (2001) docu-mented that procedural justice had moderate correlations with system-ref-erenced evaluation of authority. This result indicates that procedural justice within managerial performance evalu-ation consistently affects managerial performance. However, the effect is various between two ends of direct vs. indirect effects.
In the context of the BSC, the combination of financial and non-fi-nancial performance measures is to relate between short-term operational control and the long-term vision and strategy of the business (Kaplan and Norton 1992, 1996a, 2001). The BSC employs a multi-dimensional approach by including both financial and non-financial measures in order to com- bine the more traditional control meth-ods (financial measures) with the new firm’s emerging success-leading-indi-cators (non-financial measures) (Otley 1999). Amir and Lev (1996) concluded that the non-financial measure will increase the value-relevant of the fi-nancial measures related to the value of the subject telephone-company. Therefore, the study employs the two
1 This study uses the term “justice” and “fairness” interchangeably. Some prior studies also used
perspectives, financial and non-finan-cial measures in implementing the BSC since both perspectives might appro-priately not be used separately.
It has been documented that the use of the BCS in evaluating manage-rial performance is closely related to the managers’ perception on the fair-ness of performance evaluation pro- cess. Referring to Laventhal’s proce-dural justice rules (1980), the finan-cial measures relate to the consistency rule since the measures are consis-tently applied across time and persons or divisions, while the non-financial measures relate to the representative- ness rule since they represent the val-ues, concerns and perspectives of each division. Furthermore, both the finan-cial and non-finandivision. Furthermore, both the finan-cial measures also accommodate the rules of evaluative-ness, accurate information, non-bias decision maker, and conformity to moral values.
However, managers may perceive procedural justice differently between nonfinancial and financial measures since both measures have different chcharacteristics. Lau and Buckland (2001) show that managers perceive financial measures as more fair than nonfinancial measures because finan- cial measures are objective and truth-ful, while nonfinancial measures are subjective and biased. On the other hand, Lau and Mosser (2008) indicate managers perceive nonfinancial mea- sures as more fair than financial mea-sures since nonfinancial measures are complete and accaccurate, while fi-nancial measures are narrow and rigid.
One possible reason explaining this inconsistent evidence is the impor- tance of the process in evaluating per-formance. Since measuring managers’ performance using the BSC is a pro-cess, then the fairness in evaluation procedures will be perceived through the length of the evaluation process. Hence, managers will gradually per-ceive procedural justice during the process, not as a consequence of the process.
Ha1: Managers’ perception on proce-dural fairness of performance evaluation criteria strengthens the relationship between nonfi-nancial criteria and managers’ organizational commitment Kaplan and Norton (1996a) argue that the financial measures are able to summarize the readily measurable and important economic consequences of the actions of division managers. Fur-Hence, the study proposes that the procedural justice is expected to posi-tively improve the effectiveness of using financial measures to improve managers’ organizational commit- ment. The study states the second hy-pothesis as follows.
Ha2: Managers’ perception on proce-dural fairness of performance evaluation criteria strengthens the relationship between finan-cial criteria and managers’ or-ganizational commitment. Some earlier researches in be- havioral aspects of performance mea-surement systems and participative budgeting have consistently docu-mented that organizational commit-ment mediates the relationship between some behavioral effort variables and organizational performance (Lau and Moser 2008; Lau and Sholihin 2005; Porter et al. 1974; Mowday et al. 1979; among others). Organizational
com-mitment is the strength of employees’ involvement in a particular organiza-tion. The concepts of organizational commitment can be referred to as the condition with which employees will stay with the organization because they tional performance. They differenti-ate organizational commitment into affective and continuance commit-ment. Affective commitment refers to emotional attachment to, identifica- tion with, and involvement in the orga-nization, while continuance commit- ment refers to perceived costs associ-ated with leaving the company. They documented that affective commitment correlated positively and continuance commitment correlated negatively with job performance. Accordingly, the study proposes the third hypothesis as follows.
Ha3: Managers’ organizational com-mitment is positively related to managers’ managerial perfor-mance
fi-nancial measures) on organizational commitment. Finally, the organiza-tional commitment, in turn, will affect managerial performance.
Methodology
Respondents
The hypotheses are tested using primary data collected from part-time MBA students at Universitas Gadjah Mada, Indonesia. There are 76 stu-dents in three classes of management control systems subject (MCS) in the academic years of 2007/2008 and 2008/ 2009 who participate in the study. The selection of students in MCS classes is to assure that the respondents have basic knowledge of and are familiar with the topic and being asked about the use of BSC in the performance measurement system. The researcher distributes questionnaires to the re-spondents at the last session of the class meeting. The researchers put the questionnaires in the front of the class and announce to the students that there
is a study asking the students who are willing to voluntarily participate in the study related to the BSC performance measurement system to take a ques-tionnaire and fill it out before the class begins. It is also announced that it will take around 15-20 minutes to fill out the questionnaire, and that the study does not have any relationship with the MCS class.
The questionnaire is accompanied by a cover letter describing the objec- tive of the study and assurance of re-sponse confidentiality. After the cover letter, the second page of the question-naire asks the respondent to write a brief description of demography data, followed by a description of a mission, strategy, and the plan of using the BSC by the business unit to measure effec-tiveness of strategy implementation, questions relating to measuring vari-ables in interests on the third to sixth pages, consecutively. Seventy nine stu-dents from 108 listed students (70.37%) in the three MCS-classes participate in the study. Three responses are excluded from further analysis due to incom-Figure 1.Relationship between Nonfinancial measures, Financial Measures,
plete or incorrect responses, and hence leaving 76 usable responses, of which 57 percent of them are men and 43 percent are women. The non-response bias among different times in three different classes is tested based on mean comparisons for the four vari-ables used in the study (Hair 2006). The results show that there are no significant differences among means from three MCS classes.
Table 1 depicts the distribution of demography data. The average age of respondents is 33 years with an aver-age working experiences of ten years, the shortest working experience of four years and the longest working experi-ence of fourteen years. Most of the respondents (94%) are involved in the managerial function of monitoring, evaluating, and/or supervising subor-dinates in their current positions. This condition indicates that most of the respondents have enough experiences functioning as a manager in their com-
panies. Finally, 89 percent of respon-dents work in the service industry (59% in general and 30% in financial ser- vices) and 11 percent work in the manu-facturing industry.
Variables Measurement
The BSC Measures
The purpose of the study is to examine individual behavior responses to the four perspectives of performance measures used in the BSC, namely learning and growth, internal business, customer, and financial perspectives. The study employs four items of per- formance measures for each perspec-tive (sixteen items for all perspectives) used by Lipe and Salterio (2000) with view wording modifications. However, the study selects only a set of the BSC measures for one division (ReadWear division) used by Lipe and Salterio’s (2000) study, since it is more appropri- ate with Indonesian business environ-ments. They use two sets of the BSC measures for two different divisions Table 1. Distribution of Demography Data for Respondents
Man Woman Total
Number of Repondents 43 (57%) 33 (43%) 76 (100%)
Average Age 34 years 30 years 33 years
Working Experience 10 years 9 years 10 years Company Background:
Manufacturing 6 (8%) 2 (3%) 8 (11%)
Services 28 (37%) 17 (22%) 45 (59%)
Financial 9 (12%) 14 (18%) 23 (30%)because their subjects are asked to compare the performance of two divi-sions using the BSC measures.
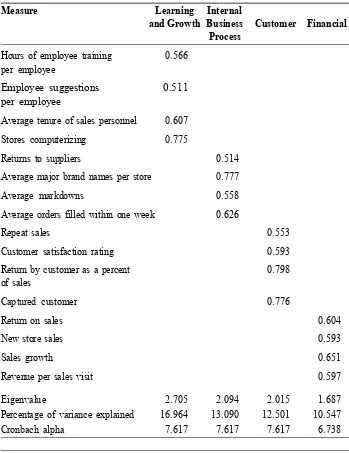
The study selected Lipe and Salterio’s (2000) instrument based on three reasons. First, as suggested by Kaplan and Norton (1996), Lipe and Salterio’s instrument has been specifi- cally developed based on division strat-egy introduced in their experiment. Second, they decided to select sixteen items of measures based on the consid-eration that individual cognitive ca-pacity to appropriately process cues of information is between fifteen to twenty cues. Moreover, Lipe and Salterio (2000) and Liedtka et al. (2007) indicate that measuring individual per-formance based on too few variables may not represent the real conditions; however, employing too many vari-ables may complicate the process. The final reason is that Lipe and Salterio (2000) have done a pilot testing for their instrument to groups of MBA and accounting students resulting in valid representative of the BSC categories. The items for learning and growth perspectives are hours of employee training per employee, employee sug-gestions per employee, average tenure of sales personnel, and stores comput-erizing. The four items used in internal business perspective include returns to suppliers, average major brand names/store, average markdowns, and average orders filled within one week. The items used in customer perspec-tive are repeat sales, returns by cus-tomer as percentage of sales, customer
satisfaction rating, and captured cus-tomer. Finally, the four items for fi-nancial perspectives include return on sales, new store sales, sales growth, and revenue per sales visit.
and growth perspective is 2.705, inter-nal business is 2.094, customer is 2.015, and financial is 1.687; and those ex-plain 16.96, 13.09, 12.50, and 10.55 percent of variances for each measure, respectively. These indicate that the
four perspectives significantly corre-spond to the BSC measurement per-spectives. Additionally, all four items also significantly load to their respec-tive perspectives with loading factors ranging from 0.511 to 0.798.
Table 2. Factor Analysis and Eigenvalue for all BSC Perspectives
Measure Learning Internal
and Growth Business Customer Financial Process
Hours of employee training 0.566
per employee
Employee suggestions 0.511 per employee
Average tenure of sales personnel 0.607
Stores computerizing 0.775
Returns to suppliers 0.514
Average major brand names per store 0.777
Average markdowns 0.558
Average orders filled within one week 0.626
Repeat sales 0.553
Customer satisfaction rating 0.593
Return by customer as a percent 0.798 of sales
Captured customer 0.776
Return on sales 0.604
New store sales 0.593
Sales growth 0.651
Revenue per sales visit 0.597
Eigenvalue 2.705 2.094 2.015 1.687
Percentage of variance explained 16.964 13.090 12.501 10.547
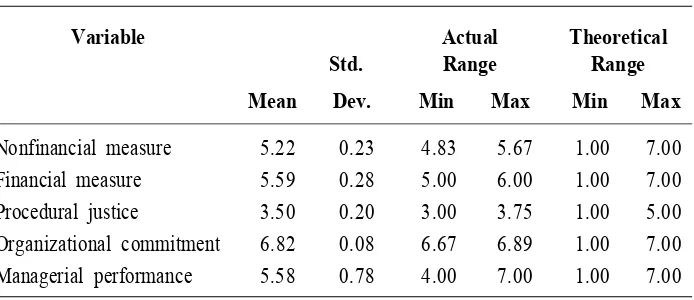
In the analysis, the nonfinancial perspective scores (customers, inter-nal business, and learning and growth perspectives) are combined into one variable. The data used for regression analysis (hypothesis tests) is the aver- age scores of raw data for each vari- able of interest, except for a manage- rial performance variable (see expla- nation under sub-heading of Manage- rial Performance). The average of non-financial performance is the mean of 16 items’ scores of nonfinancial per-formance measures, the average score of financial performance is the mean of the four items’ scores of financial performance measures, the average score of procedural justice is the mean of the four items’ scores of procedural justice measures, and the average score of organizational commitment is the mean of the nine items’ score of orga-nizational commitment measures. Table 2 presents the results of factor analysis and eigenvalue for validity test of the instruments and Table 3 provides the descriptive statistics of
all variables used in the regression analysis.
Procedural Justice
Using the BSC measures to judge overall managers’ performance will involve subjective perceptions of the user on “the meaning” of the BSC measures. This condition is likely to affect the ethical (justice) perception of managers being evaluated using the BSC. Two forms of justice may be involved in the process, namely dis-tributive justice and procedural jus- tice. The concepts of distributive jus-tice are developed based on the equity principle. It states that distributive jus-tice sustains when the allocation of the outputs (benefits and/or costs) within a group is proportional to the contribu-tion of group members. On the other hand, the concepts of procedural jus-tice rely on the fairness of the rules and processes involved in the activity. The study relates to the justice perception of using the BSC (as a rule) to evaluate managers’ performance (as a process). Table 3. Descriptive Statistics of Variables Used in Hypothesis Testing
Variable Actual Theoretical
Std. Range Range
Mean Dev. Min Max Min Max
Hence, the interest of the study is the concepts of procedural justice.
Following Lau and Moser (2008) and Lau and Sholihin (2005), the study employs McFarlin and Sweeney’s (1992) instrument to measure manag-ers’ perception of procedural justice. The questionnaires ask subjects to rat-ing the procedural justice of perfor-mance evaluation process using a 5- point Likert scale (1 has the least im-portance and 5 has the most impor- tance) on four items used in the perfor-mance evaluation process. The four
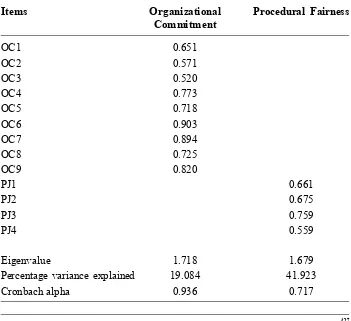
items include evaluating employee per- formance, determining employee pro-motions, determining salary increases, and communicating performance feed-back. Table 4 presents the results of the factor analysis of the four proce-dural justice items. The rotated factor loadings for these items of procedural justice range from 0.559 to 0.759 and load on a single factor with an eigen-value of 1.679 that explains 41.923 percent of the variances. The mean score is 3.50 with the standard devia-tion of 0.20 (see Table 3), and Cronbach alpha of 0.717 indicating valid mea-sures.
Table 4. Factor Analysis and Eigenvalue for Procedural Fairness and Organizational Commitment
Items Organizational Procedural Fairness
Commitment
OC1 0.651
OC2 0.571
OC3 0.520
OC4 0.773
OC5 0.718
OC6 0.903
OC7 0.894
OC8 0.725
OC9 0.820
PJ1 0.661
PJ2 0.675
PJ3 0.759
PJ4 0.559
Eigenvalue 1.718 1.679
Percentage variance explained 19.084 41.923
Organizational Commitment
Similar to Lau and Moser (2008), the study employs Mowday et al.’s (1974) instrument to measure organi-zational commitment. The question- naires ask subjects to rate their agree-ment on nine statements using a 7-point Likert scale (1 is strongly dis-agree and 7 is strongly agree) such as “I tell my friends that this organization is a great place to work for” and “I am proud to tell others that I am part of this organization.” Table 4 presents the results of the factor analysis of the nine with the standard deviation of 0.08 (see Table 3), and Cronbach alpha of o.936 indicating valid measures.
Managerial Performance
The study employs Moahoney’s (1963) managerial performance instru-ment that has been widely used in prior studies (Lau and Moser 2008; Lindquist 1995; and Brownell 1982; among others). The questionnaires ask subjects to rate nine-dimensions of areas of managerial performance us-ing a 7-point Likert scale (1 is strongly disagree and 7 is strongly agree). These dimensions are planning, coordinat-ing, evaluatcoordinat-ing, investigatcoordinat-ing, super- vising, staffing, negotiating, represent-mance. Hence, to provide assurance that the measure reflects the eight di-mension scores, the researcher regress the eight performance dimensions (as independent variables) on overall score (as dependent variables). The results show that the eight performance vari-ables can explain around 58.8 percent of the variance in the overall perfor-mance variable, and this exceeds the minimum benchmark of 55 percent suggested by Mahoney et al. (1963). The mean score for managerial perfor- mance is 5.58 with the standard devia-tion of 0.78 (see Table 3)
Hypothesis Tests
This study expects that procedural justice will strengthen the relationship between the BSC measures (financial and nonfinancial) and the organiza-tional commitment. It is also expected that the organizational commitment will positively and significantly affect managerial performance. Regression analyses are used to test the hypoth-eses. Equation 1 depicts these two regression models.
NM= nonfinancial measure FM= financial measure PJ= procedural justice
MP = managerial performance The first hypothesis is supported when 4 is significant with a positive sign. Similarly, the second hypothesis is supported when 5 is significant with a positive sign, while the last hypothesis is supported when 1 is also significant with a positive sign.
Results of Hypothesis Tests
The study runs the regression model using SPSS version 15.0. Table 5 presents the results of running the moderating regression model based on 76 observation data. The descriptive statistics for the data used in the re-gression models are presented in Table 3.
The results of regressing the mod-erating model indicate that the model is reliably used to test the hypotheses with the goodness of fit F-value of 9.788 and significant at p-value of 0.000. All independent variables in the model can explain 36.9 percent varia-tions in the organizational commit-ment (adjusted R2 = 0.369). Further-more, all independent variables are
also significant at a= 1 percent (except variable Nonfinancial Measure * Pro-cedural Justice at a= 5%). Interest-ingly, all the coefficient relationships between the main individual variables of nonfinancial measure, financial measure, and procedural justice and organizational commitment have sig-nificant negative signs, while earlier studies document positive signs. When a one-tail t-test isused with the expec-tation of positive direction, then the negative coefficient will be consid- ered as insignificant. These results re-flect that procedural justice is neither related to the BSC measures nor orga-nizational commitment, but it inter-acts with the BSC measures to modify the relationship form of the BSC mea-sures and organizational commitment (Sharma et al. 1981). Thus, the proce-dural justice can function as a pure moderator variable in the relationship.2 Table 5 also shows that the coef-ficient of (Nonfinancial Measure * Procedural Justice) is 0.986 with t-value of 2.348 and at a of 5 percent indicating strong support to the first hypothesis. As expected procedural justice significantly strengthens the positive effect of using the nonfinan-
cial measure when assessing manage-2 The moderating model is robust since there are insignificant direct relationship between
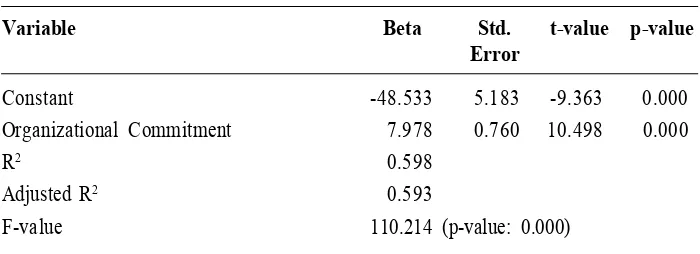
Table 6. The Regression Results of the Managerial Performance (MP) Model
MP = 0 + 1 OC + 2
Variable Beta Std. t-value p-value
Error
Constant -48.533 5.183 -9.363 0.000
Organizational Commitment 7.978 0.760 10.498 0.000
R2 0.598
Adjusted R2 0.593
F-value 110.214 (p-value: 0.000)
Table 5. The Results of the Organizational Commitment (OC) Moderating Regression Model
OC = 0 + 1 NM + 2 FM + 3 PJ + 4 NM*PJ+ 5 FM*PJ + 1
Variable Beta Std. t-value p-value
Error
Constant 34.808 8.188 4.251 0.000
Nonfinancial Measure -3.966 1.458 -2.721 0.008 Financial Measure -2.205 0.699 -3.155 0.002 Procedural Justice -7.258 2.337 -3.105 0.003 Nonfinancial Measure * Procedural Justice 0.986 0.420 2.348 0.022 Financial Measure * Procedural Justice 0.616 0.199 3.096 0.003
R2 0.411
Adjusted R2 0.369
F-value 9.788 (p-value: 0.000)
rial performance through organiza- tional commitment. Similarly, the re- sults also significantly support the sec-ond hypothesis when the coefficient of (Financial Measure * Procedural Jus-tice) is 0.616 with t-value of 3.096 and at the a of 1 percent. As expected procedural justice significantly
process of managerial performance measurement systems will improve the effectiveness of implementing the BCS as a part of performance evaluation system.
Table 6 presents the simple re-gression results to test the third hy-pothesis that managers’ organizational commitment is positively related to managers’ managerial performance. The results of the regression indicate that the model is reliably used to test the hypotheses with the goodness of fit F-value of 110.214 and significant at p-value of 0.000. The independent variable in the model can explain 59.3 percent variations in the managerial performance (adjusted R2 = 0.593). As expected the coefficient of organiza- tional commitment (7.978) was posi-tively significant with t-value of 10.498 and p-value of 0.000 supporting hy-pothesis three.
Conclusion, Discussion, and
Limitation
The aim of this study is to exam-ine the moderating effects of proce-dural justice on the effectiveness of the BSC performance measures in improving managerial performance through organizational commitment. The study remodels the mediating ef- fect of procedural justice on the rela-tionship between the BSC measure and managerial performance found in prior studies, into the moderating ef-fect based on the contingency theory. The results of this study support previous studies in organizational and
three perspectives into one dimension may reduce the appropriateness of the measure when, in fact, respondents
interpret the measures differently. Fu- ture studies can deal with this limita-tion by separating the nonfinancial measures into three dimensional mea-sures.
References
Amir, A., and B. Lev. 1996. Value relevance of nonfinancial information: The wireless communications industry. Journal of Accounting and Economics 22: 3-30. Anthony, R. N., and V. Govindarajan. 2005. Management Control Systems (11th Ed.)
Chicago, IL: Irwin.
Brownell, P. 1982. The role of accounting data in performance evaluation, budgetary participation, and organizational effectiveness. Journal of Accounting Research 20 (1) Spring: 12-27.
Cohen, R. L. 1987. Distributive justice: Theory and research. Social Justice Research 1 (1): 19-40.
Cohen, A. 1993. Organizational commitment and turnover: A meta analysis. Academy of Management Journal 36 (5): 1140-1157.
Colquitt, J. A., D. E. Conlon, M. J. Wesson, C. O. L. H. Porter, and K. Yee Ng. 2001. Justice at the Millennium: A meta-analytic review of 25 years of organizational justice research. Journal of Applied Psychology 86 (3): 425-445.
Fiedler, F. E. 1983. ‘Assessing the validity of fiedler’s contingency model of leadership effectiveness: A closer look at Strube and Garcia.’ Psychological Bulletin 93: 404– 8.
Fisher, J. 1992. Use of nonfinancial performance measures. Journal of Cost Management (Spring): 31-38.
Folger. 1987. Distributive and procedural justice in the workplace. Social Justice Research 1 (2): 143-160.
Greenberg, J. 1987. A taxonomy of organisational justice theories. Academy of Manage-ment Review 12 (1): 9-22.
Hair, J. F., R. L. Tatham, R. E. Anderson, and W. Black. 2006. Multivariate Data Analysis. New Jersey: Prentice Hall.
Jaros, S., J. Jermier, J. Koehler, and T. Sincich. 1993. Effects of Continuance, affective and moral commitment on the withdrawal process: An evaluation of eight structural equation models. Academy of Management Journal 36: 951-995.
Kaplan, S. E., and J. T. Mackey. 1992. An examination of the association between organizational design factors and the use of accounting information for managerial performance evaluation. Journal of Management Accounting Research 4: 116-130. Kaplan, R. S., and D. P. Norton. 1992. The balanced scorecard – measures that drive
———. 1993. Putting the balanced scorecard to work. Harvard Business Review 71 (5): 134-42.
———. 1996a. Using the balanced scorecard as strategic management system. Harvard Business Review 74 (1): 75-85.
———. 1996b. The Balanced Scorecard: Translating Strategy into Action. Boston, MA: Harvard Business School Press.
———. 2001. Transforming the balanced scorecard from performance measurement to strategic management: Part 1. Accounting Horizons 15 (1): 87-104.
Korsgaard, M. A., and L. Roberson. 1995. Procedural justice in performance evaluation: The role of instrumental and non-instrumental voice in performance appraisal discussions. Journal of Management 21 (4): 657-669.
Lau, C. M., and A. Moser. 2008. Behavior Effects of Nonfinancial Performance Measures: The Role of Procedural Fairness. Behavioral Research in Accounting 20 (2): 55-71. Lau, C. M., and M. Sholihin, 2005. Financial and nonfinancial performance measures: How do they affect job satisfaction? The British Accounting Review 37: 389-413. Lau, C. M., and E. Lim. 2002. The intervening effects of participation on the relationship
between procedural justice and managerial performance. British Accounting Review 34: 55-78.
Lau, C. M., and C. Buckland, 2001. Budgeting-role of trust and participation: a research note. ABACUS 37: 369-388.
Lau, C. M., L. C. Low, and I. Eggleton. 1995. The impact of reliance on accounting performance measures on job-related tension and managerial performance: Addi-tional evidence. Accounting, Organizations and Society 20 (5): 359-381.
Laventhal, G. S., J. Karuza Jr., and W. R. Fry, 1980. Beyond fairness: A theory of allocation preferences. In G. Mikula, Justice and Social Interaction: 167-218. Bern, Switzerland: Hans Huber Publishers.
Libby, T., 1999. The influence of voice and explanation on performance in a participative budgeting setting. Accounting, Organizations and Society 24 (2): 125-137. Libby, T., S. E. Salterio, and A. Webb. 2004. The balanced scorecard: The effects of
assurance and process accountability on managerial judgment. The Accounting Review 79 (4): 1075-1094.
Liedtka, S. L., B. K. Church, and M. R. Ray. 2008. Performance Variability, Ambiguity Intolerance, and Balanced Scorecard-Based Performance Assessments. Behavioral Research in Accounting 20 (2): 73-88.
Lindquist, T. 1995. Fairness as antecedent to participative budgeting: Examining the effects of distributive justice, procedural justice and referent cognitions of satisfac-tion and performance. Journal of Management Accounting Research 7: 122-147. Lipe, M. G., and S. E. Salterio. 2000. The balanced scorecard: Judgmental effects of
common and unique performance measures. The Accounting Review 75 (3): 283-298. ———. 2002. A note on the judgmental effects of the balanced scorecard’s information
Mahoney, T., T. Jerdee, and S. Carroll. 1963. Development of Managerial Performance: A Research Approach. Cincinnati, OH: South-Western Publishing Company. Marr, B., Neely, A., Bourne, M., Franco, M., Wilcox, M., Adams, C., Mason, S., &
Kennerley, M. (2004). Business performance measurement - What is the state of use in large US Firms? Proceedings of PMA 2004 Conference. UK Edinburgh, July 2004. McFarlin , D., and P. Sweeney. 1992. Distributive and procedural justice as predictors of satisfaction with personal and organizational outcomes. Academy of Management Journal 35 (3): 626-637.
Mowday, R. T., R. M. Steers, and L. W. Porter. 1979. The measurement of organizational commitment. Journal of Vocational Behavior 14 (2): 224-247.
Otley, D. T. 1999. Performance management: A framework for management control systems research. Management Accounting Research 10 (4): 363-382.
Porter, L. W., R. M. Steers, R. T. Mowday, and P. V. Boulian. 1974. Organizational commitment, job satisfaction, and turnover among psychiatric technicians. Journal of Applied Psychology 39 (5): 603-609.
Rigby, D. (2001). Management Tools and Techniques: A Survey. California Management Review 43 (2), 139-160.
Sharma, S., R. M. Durand, and O. Gur-Arie. 1981. Identification and Analysis of Moderator Variables. Journal of Marketing Research (August): 291-300.
Slovic, P., and D. MacPhillamy, 1974. Dimensional commensurability and cue utilisation in comparative judgment. Organisational Behavior and Human Performance 11: 172-194.