The Stability Analysis of the Lusi Mud Volcano Embankment Dams
using FEM with a Special Reference to the Dam Point P10.D
Agustawijaya, D.S.1,2) and Sukandi2)
Abstract: Since the eruption of the Lusi Mud volcano in Sidoarjo, East Java, on May 2006, soil embankment dams have been built to keep hot mud within the ponds. Unfortunately, since the dams were sitting on poor weak ground, land subsidence intensively occurred around the dams. A finite element method (FEM) was, then, applied to evaluate the stability of the dams particularly of the dam point P10.D, being considered as the most unstable point over 29 other dam points. Results show that the dam displacements in vertical and horizontal directions were high. The total displacements of the final design were about 1.5 m in both static- and dynamic-state conditions. These modelled data show a similar trend with field measurement data. The dam had only a factor of safety of about 1.1, and the dam might fail through a deep slide mode.
Keywords: Deep slide, displacement, embankment dam, factor of safety, stability.
Introduction
A mud volcano has been erupting in Porong–
Sidoarjo since 29 May 2006. It has displaced about
30,000 people, and covered an area of nearly 6.3 km2
[1]. This geological phenomenon has been
interna-tionally well known as Lusi (Lumpur Sidoarjo).
Although the Lusi mud volcano is not the first mud volcano around East Java [2, 3], it is the worst in terms of disaster to the people and environment around the location [4]
Since the beginning of the eruption, embankment dams have been built surrounding the Lusi mud volcano to stop hot mud flowing all over the area. These embankment dams became hot mud ponds prior to the dredging process to the Porong River. The embankment dams were constructed from pebble-soil materials to meet a flexible design. Unfor-tunately, such a design could not avoid three main problems at the field: weak ground, land subsidence, and mud pressure.
The dams are sitting on soft grounds made of clay and silt soils, which were never compacted before the construction of the dams.
1 Department of Civil Engineering, Mataram University, Jl.
Maja-pahit 62 Mataram, Lombok – INDONESIA
E-mail: [email protected]; [email protected]
2 BPLS, Jl. Gayung Kebon Sari 50 Surabaya - INDONESIA
Note: Discussion is expected before November, 1st 2012, and will be published in the “Civil Engineering Dimension” volume 15, number
1, March 2013.
Received 28 April 2012; revised 31 July 2012; accepted 16 August 2012.
The reason of this poor procedure was due to a limited time available in emergency conditions to safe people and existing infrastructures from hot mud flow. Land subsidence and mud pressure have occurred since the beginning of the eruption.
The construction of the embankment dams was conducted in five stages [5]. The original design was constructed with the dam crown and mud levels of +5.0 m and +1.2 m from the mean sea level (MSL), respectively. This first design was only intended for holding the mud temporally within the ponds; and was constructed in two parts: outer and inner dams.
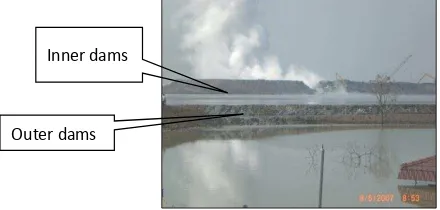
The the inner dams functioned as the main coffer-dam for holding hot mud around the crater (Figure 1). Soon after the mud volume exceeded the capacity of the ponds, following the collapse of the inner dams, the outer dams were then rebuilt for the second stage. The elevation of the dams was con-sequently increased in each subsequent stage, reach-ing the level of +11.0 m from the MSL in the final design, allowing the construction of retaining walls around the dams.
Inner dams
Outer dams
One of the 29 dam points surrounding the Lusi mud volcano is P10.D, which is considered as the most unstable dam location due to a high rate of sub-sidence of about 0.013 m/month [6]. This paper aims to model the stability of the dams by applying a finite element method package. The analysis was focused on dam point P10.D.
Deformation Analysis
The finite element method of the Plaxis software package [7], which is able to model the deformation of weak dam ground in two-dimensional conditions with a reasonable accuracy, was used for analysing the stability of the dam.
The two-dimensional plain strain concept [8] is, then, adopted, as the concept is suitable to the dam configuration that the z-axis, parallel to the dam axis, is assumed to be longer than the cross-x and vertical-y axes in the three Cartesian-coordinates.
The Mohr-Coulomb failure concept is then applied. This concept is an elasto-plastic model representing stresses causing strains until yield in elastic conditions; subsequently, plastic behaviour after yielding is due to the increase of strains [9]. Parameters applied in this modelling are elasticity modulus (E), Poisson’s ratio (), effective cohesion (c'), and effective friction (').
The Estimation of Safety Factor
In general, the stability analysis of the dams is to predict failure modes and estimate the safety factor of the slope of the dams being investigated. The design should consequently follow these criteria. By using the Plaxis package, the phi-c reduction is then applied for estimating the safety factor.
This phi-c reduction procedure is to reduce the available values of soil strength parameters, c' and ', automatically until the soil fails [10, 11]. The benefit of this procedure is that assumptions are not needed anymore in determining the position of the failure plane of the soil. Thus, the failure plane will be established naturally on the zone that the soil strength could not resist the mobilised shear stresses [10, 12]. The safety factor is, therefore, estimated, as follows [10]:
c' = available effective cohesion c'f = effective cohesion at failure
ϕ' = available effective friction
ϕ'f = effective friction at failure
The SRF is strength reduction factor, for which the SRF value corresponding to failure is the value of the factor of safety (FoS). [13], and S1-S2-S6-S7-S8-S9 at depths of 30 meters for DCP tests [14]. These data were then correlated to develop a stratigraphic model of the grounds, as can be seen in Figure 2.
The stratigraphy of the ground consists of five soft layers: sandy silt, silty sand, silty clay, clayed silt, and sandy silt from the top to the bottom layers, respectively. All layers had standard penetration test values of N <13 (number of blows/30 cm penetration) [15]. The softest layer was the fourth layer of clay materials, which had only an N value of about 5, and the value of Dutch cone penetration resistance, qc, of
8 kg/cm2 at the depths of 8-28 m.
The Dam Point P10.D
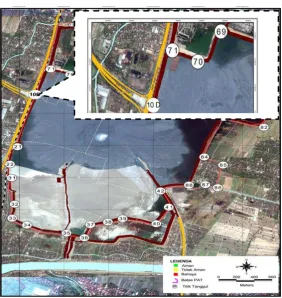
The dam point P10.D is located at the N-W side of the Lusi mud volcano (Figure 3). The dam was designed to have an elevation of +11.0 m from the MSL, and it was constructed on the ground elevation of +1.2 from the MSL. The dam had a slope scale of 1 : 1.25 (H : V). The construction of the dam was divided into three sequences: original design, reviewed design, and the final design with retaining wall.
The original design assumed that the predicted mud elevation was only up to +3.5 m, so the dam was designed to have an elevation of +5.0 m from the MSL. But, soon after the mud reached the elevation of the dam, the dam design was, then, reviewed. The reviewed design was constructed in three levels of elevation: +6.7 m, +8.0 m and +10.0 m. The final dam design had an elevation of +11.0 m, constructed with retaining walls (Figure 4).
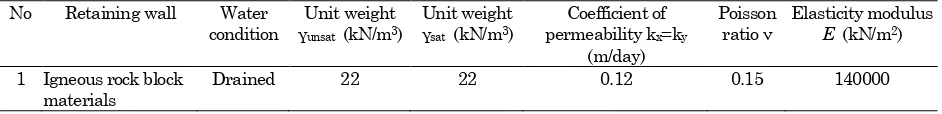
steel wire parameters were neglected and only rock blocks materials were considered in this stability
modelling. Typical properties of rock block are presented in Table 2.
Figure 2. Stratigraphic Model of the Embankment Dams
Displacement
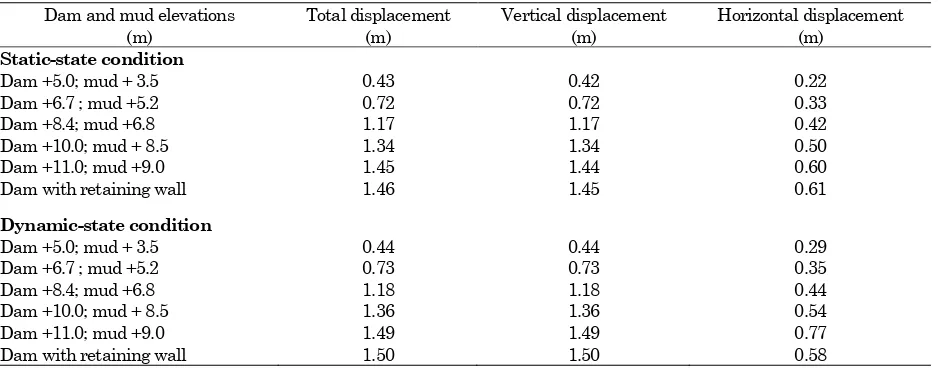
A deformed mesh was applied in the numerical finite element method analysis for estimating the displacements of the dam point P10.D. The ground and the structure of the dam were assumed to displace in horizontal and vertical directions [10]. Total displacements, that are absolute accumulated displacements u combined from the horizontal (x) and vertical (y) components at all nodes, at the end of the current calculation step, displayed on a plot of the geometry [7], were also possibly calculated in this modelling. Results of displacement analysis for all designs can be seen in Table 3.
As can be seen in Table 3, in general, there was an increase in displacement in each stage of design of the dam point P10.D for both conditions: static- and dynamic-state. But, it seems that displacements in dynamic-state conditions were slightly higher than that in static-state conditions. In the case of total displacements, the increase of the displacements in dynamic-state conditions could be about 2.8% com-pared to that in static-state conditions. This could mean that any change in stress configuration, for instance due to land subsidence, would put some addition into the displacements.
Figure 4. The Design of the Dam Point P10.D
Table 1. Input Parameters for Ground and Dam Materials of the Dam Point P10.D No Ground and dam
Unfortunately, a retaining wall might contribute some additional weights to the dam structure in terms of total and vertical displacements. The additional weight could result in the increase of the displacements for about 0.7%. The retaining wall working as a counter weight pressure to the dam might only be found in dynamic-state conditions for horizontal displacements. The retaining wall reduced the horizontal displacements for about 25% from that of the dam without the retaining wall.
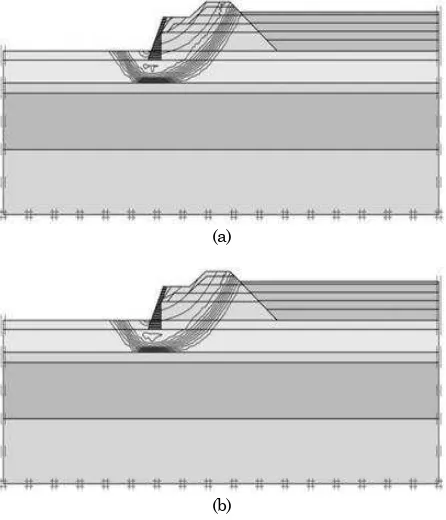
In terms of vertical displacement distribution, the distributions were similar in both static and dynamic-state conditions (Figure 5). It seems that the whole body of the P10.D dam displaced vertically through the centre of the body.
(a)
(b)
Figure 5. Distribution of Vertical Displacements for the Final Design: a) Static-state Conditions; b) Dynamic-state Conditions
(a)
(b)
Figure 6. Distribution of Horizontal Displacements for the Final Design: a) Static-state Conditions; b) Dynamic-state Conditions
When the horizontal displacement is analysed, the movement of the body was to the downstream direction of the dam (Figure 6). There was a horizontal displacement concentration under the toe of the retaining wall, which means that mud loads play an important role in this downstream movement. The increase of mud elevation from the original design to the final design might result in the increase of the horizontal displacements of 0.39 m.
Ground Movement
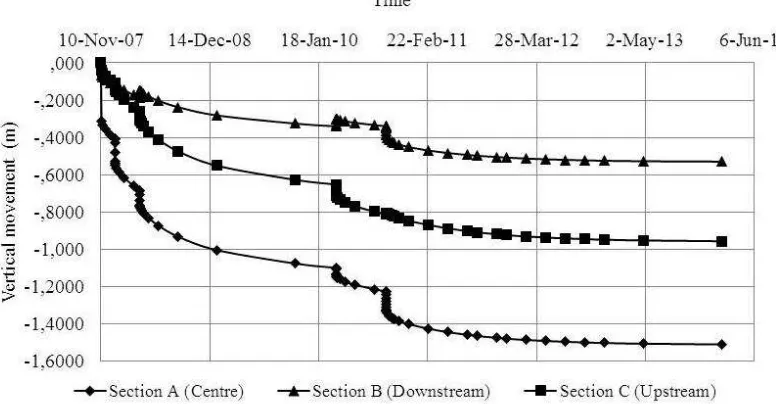
In ground movement analysis, the dam point P10.D was divided into three sections: A, B, and C (Figure 7). It was assumed that the weight working on the dam ground caused movement in vertical and
hori-Table 3. Displacements of the Dam Point P10.D Dam and mud elevations
zontal directions. The movement could sink down the dam, and cause heaving on the toe of the dam.
In Figure 8, the vertical ground movement in the centre of the dam (section A) was higher than that in the sections B and C. The upstream section C had higher vertical ground movements than that in the downstream section B. All vertical ground move-ments seem to work with time in each sequence. In the final design, the vertical ground movement of the section A was up to -1.5 m, which could be reached in five years after the first construction of the dam.
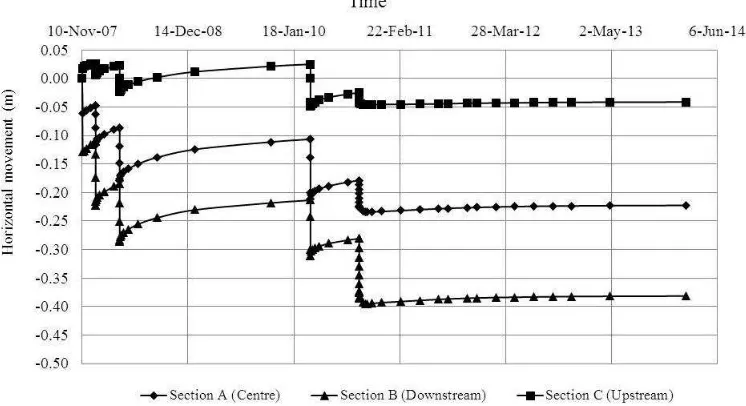
Horizontal ground movements on the same sections are shown in Figure 9. The highest horizontal ground movement was on the section B, which is the downstream wall of the dam. The horizontal ground movement on the section B reached the value of over -0.4 m in three years after the first construction. The horizontal ground movement from the upstream to the downstream of the dam seems to be influenced by mud loads, as the mud increased from +3.5 m to +9.0 m, the rate of horizontal ground movements was -0.08 m.
Figure 7. Ground Section of the Dam Point P10.D.
Excess Pore Pressure
Excess pore water pressures occurred during the dam construction, where the weight of the dam expelled out the water within the ground pores. During the construction the ground pore water pressures increased in each stage, and the pressures increased up to -11.0 kN/m2 in the second stage
when the elevation of the dam was +6.7 m and the elevation of the mud was +5.2 m. As the ground was dominantly made of soft materials, which were clay and silt materials, the excess pore pressures will then work with time, as can be seen in Figure 10. The pressures could disappear after one year of the final design construction.
These excess pore water pressures contributed into the deterioration of the ground stability, as the effective normal forces working on the ground decreased. The low effective normal forces would reduce the factor of safety of the ground.
GPS Measurement
Field Global Position System (GPS) surveys were
conducted during the period of December 2008–
December 2010 around the Lusi mud volcano [16], and the nearest location to the P10.D shown in Figure 11, was DG-4. Results show that after six months since December 2008, the ground of DG-4 had already subsided for about 0.14 m, then an
Figure 9. Horizontal Movement versus Time of the Ground of the Dam Point P10.D
abrupt vertical movement occurred for about 0,5 m in September 2009. Since then, continuous vertical movements were recorded until December 2010, which reached about 1.36 m. In comparison with the modelled data shown in Table 3, it seems that the modelled data reasonably agreed with these field measurements. As modelled data shows the ground movement might reach the value about 1.5 m for the final design, the field GPS measurement shows a similar trend.
The Factor of Safety
The estimation of the factor of safety was applied for each design. The original design had a factor of safety (FoS) of 1.88 in both static- and dynamic-state conditions, then the FoS reduced when the elevations of the dam and mud increased. The reduction was up to 0.74 that is about 39% from the original design to the fifth stage design when the elevation of the dam was +11.0 m, and the elevation mud was +9.0 m. Unfortunately, the retaining wall reduced slightly the FoS value, as the FoS from 1.14 to 1.12 in both static- and dynamic-state conditions (Table 4).
Failure distribution shows that the dam could fail in a deep slide mode, as can be seen in Figure 12. The slide cut deeply the body of the embankment dam
through the ground. The toe of the embankment dam seems to be the concentration of stresses working under the weight of the embankment body.
(a)
(b)
Figure 12. Deep Slide Modes of Failure of the Final Design of the Dam Point P10.D: a) Static-state Conditions; b) Dynamic-state Conditions
Figure 11. GPS data of Vertical Movement of DG-4 the Nearest Location to the Dam Point P10.D
Table 4. Safety Factors in Static- and Dynamic-state Conditions of the Dam Point P10.D
Dam and mud elevations (m) Safety factor in static-state conditions Safety factor in dynamic-state conditions
Dam +5.0; mud + 3.5 1.88 1.88
Dam +6.7; mud +5.2 1.54 1.54
Dam +8.4; mud 6.8 1.47 1.46
Dam +10.0; mud +8.5 1.32 1.31
Dam +11.0; mud + 9.0 1.14 1.14
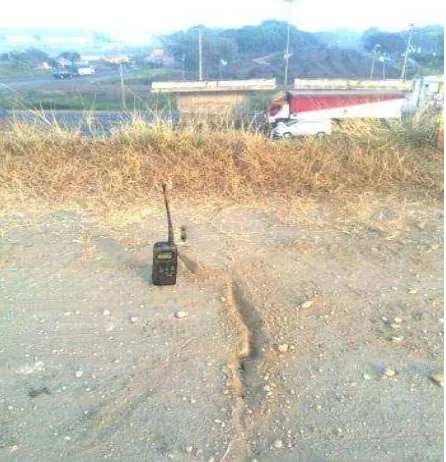
At the field, as shown as a low FoS by the model, the dam experienced a number of failures. As can be seen in Figure 13, on February 2011, a failure occurred on the toe of the dam. The dam was then immediately reconstructed for remedial measures. Unfortunately, on August 2011, a crack was subsequently found across the crown of the dam (Figure 14). Then, on December 2011, a crack line was also found on the downstream flank of the dam (Figure 15). Thus, based on these findings, it seems that the dam has certainly stability problems, as a number of current dam failures have occurred since the final design was finished in 2010.
Figure 13. Failure on the Toe of the Dam Point P10.D on February 2011.
Figure 14. Crack Line across the Dam Point P10.D on August 2011.
Figure 15. Crack Line on the Downstream Flank of the Dam Point P10.D on December 2011.
Regarding these failure phenomena, one of three problems discussed in this paper, mud pressure, is considered to be the only possible remedial measure for increasing the low FoS, as the other two problems are difficult to solve. As can be seen in Table 4, reducing the dam and mud elevations, for example to be +8.5 and +7.0 m, respectively, could in theory increase the FoS by 0.2. But, as a matter of fact, the dam has already been constructed up to the elevation of +11.0 m with a retaining wall, so the only possible way is to lower down the mud level. For example, the dam with an elevation of +11.0 m and mud level of +5.0 m could have a FoS of up to 1.3. Although, this FoS is still low, it might be adequate for a temporary dam structure for keeping mud within the ponds prior to dredging processes.
Conclusion
measure, that is mud level reduction, is necessary to increase the factor of safety up to a value of 1.3, which might be acceptable for a temporary dam structure.
Acknowledgement
The Authors acknowledge supports provided by the BPLS of Indonesia (Sidoarjo Mud Agency). This paper was part of research conducted by the BPLS of Indonesia and the Authors under a special program of Underground Monitoring and Geodetic Measure-ment Surveys currently run by the BPLS of Indo-nesia. The Authors thank sincerely to all research team members of the BPLS of Indonesia. The second Author would like also to thank Gadjah Mada University for laboratory supports during the post-graduate study in Civil Engineering.
References
1. Mazzini, A., Svensen, N. H., Akhmanov, G.G.,
Aloisi, G., Planke, S., Malthe-Sørenssen, A., Istadi, B., Triggering and Dynamic Evolution of
the Lusi Mud Volcano, Indonesia, Earth and
Planetary Science Letters, 261, 2007, pp. 375– 388.
2. Istadi, B.P., Pramono, G.H., Sumintadireja, P., Alam, S., Modeling Study of Growth and Potential Geohazard for Lusi Mud Volcano: East
Java, Indonesia, Marine and Petroleum Geology,
26, 2009, pp. 1724-1739.
3. Sawolo, N., Sutriono, E., Istadi, B.P., Darmoyo, A.B., The Lusi Mud Volcano Triggering Contro-versy: Was it caused by Drilling?, Marine and Petroleum Geology, 26, 2009, pp. 1766-1784.
4. Agustawijaya, D.S., Penanggulangan Semburan
dan Penanganan Luapan Lumpur Sidoarjo: Peranan Ilmu dan Rekayasa Kebumian dalam
Pengelolaan Bencana, Prosiding Seminar
Nasio-nal Ikatan Geograf Indonesia (in Indonesian), Surabaya, 2010, pp 16-28.
5. Anonym, Final Report of Basic Design:
RE-Design and DED Parts for Embankment Dams of Mud Holding and Mud Re-Flowing to the East Side of the Mud Volcano Crater (in Indonesian),
PT. Virama Karya-BPLS, Surabaya, 2007.
6. Anonym, Final Report of Geodetic Measurement
Surveys (in Indonesian),BPLS, Surabaya, 2011.
7. Brinkgreve, R.B.J., Plaxis 2D, V8, Delft
Univer-sity of Technology & Plaxis b.v. Delft, The Netherlands, 2007.
8. Zienkiwicz, O.C., The Finite Element Method,
Third Edition, Tata McGraw-Hill Publishing Co. Ltd, New Delhi, 1997.
9. Ugai, K., A Method of Calculation of Total Factor
of Safety of Slopes by Elasto-Plastic FEM, Soils
and Foundations, 29(2), 1989, pp.190-195.
10. Chang, Y. L. and Huang, T. K., Slope Stability Analysis using Strength Reduction Technique,
Journal of the Chinese Institute of Engineers, 28(2), 2005, pp.231-240.
11. Griffieths, D. V. and Lane, P. A., Slope Stability
Analysis by Finite Elements, Geotechnique,
49(3), 1999, pp.387-403.
12. Zheng, H, Tham, L.G., Liu, D., On Two Defini-tions of the Factor of Safety Commonly used in the Finite Element Slope Stability Analysis,
Computers and Geotechnics, 33, 2006, pp.188-nesian), Survey Report, ITS-BPLS, Surabaya, 2007.
15. ASTM D1586-08, Standard Test Method for
Standard Penetration Test (SPT) and Split-Barrel Sampling of Soils, 2008.
16. Anonym, Final Report of Geodetic Measurement