PROSIDING
Peranan Matematika dan Statistika dalam
Menyikapi Perubahan Iklim
VOLUME 2/NO.1/2014
ISN : 2337-392X
SEMINAR NASIONAL MATEMATIKA,
STATISTIKA, PENDIDIKAN MATEMATIKA,
DAN KOMPUTASI
Jurusan Matematika
Fakultas Matematika dan Ilmu Pengetahuan Alam
Universitas Sebelas Maret Surakarta
Jl. Ir. Sutami 36 A Solo - Jawa Tengah
ii
Tim Prosiding
Editor
Purnami Widyaningsih, Respatiwulan, Sri Kuntari,
Nughthoh Arfawi Kurdhi, Putranto Hadi Utomo, dan Bowo Winarno
Tim Teknis
Hamdani Citra Pradana, Ibnu Paxibrata, Ahmad Dimyathi,
Eka Ferawati, Meta Ilafiani, Dwi Ardian Syah,
dan Yosef Ronaldo Lete B.
Layout
&
Cover
iii
Tim
Reviewer
Drs. H. Tri Atmojo Kusmayadi, M.Sc., Ph.D.
Dr. Sri Subanti, M.Si.
Dr. Dewi Retno Sari Saputro, MKom.
Drs. Muslich, M.Si.
Dra. Mania Roswitha, M.Si.
Dra. Purnami Widyaningsih, M.App.Sc.
Drs. Pangadi, M.Si.
Drs. Sutrima, M.Si.
Drs. Sugiyanto, M.Si.
Dra Etik Zukhronah, M.Si.
Dra Respatiwulan, M.Si.
Dra. Sri Sulistijowati H., M.Si.
Irwan Susanto, DEA
Winita Wulandari, M.Si.
Sri Kuntari, M.Si.
iv
Steering Committee
Prof. Drs.Tri Atmojo Kusmayadi, M.Sc., Ph.D.
Prof. Dr. Budi Murtiyasa, M.Kom.
Prof. Dr. Dedi Rosadi, M.Sc.
Prof. Dr. Ir. I Wayan Mangku, M.Sc.
Prof. Dr. Budi Nurani, M.S.
Dr. Titin Siswantining, DEA
Dr. Mardiyana, M.Si.
v
KATA PENGANTAR
Puji syukur dipanjatkan kepada Tuhan Yang Maha Esa sehingga
prosiding seminar nasional Statistika, Pendidikan Matematika dan
Komputasi ini dapat diselesaikan.
Prosiding ini bertujuan mendokumentasikan dan
mengkomunika-sikan hasil presentasi paper pada seminar nasional dan terdiri atas 95
paper
dari para pemakalah yang berasal dari 30 perguruan
tinggi/politeknik dan institusi terkait. Paper tersebut telah dipresentasikan
di seminar nasional pada tanggal 18 Oktober 2014. Paper didistribusikan
dalam 7 kategori yang meliputi kategori Aljabar 14%, Analisis 9%,
Kombinatorik 8%, Matematika Terapan 14%, Komputasi 7%, Statistika
Terapan 27%, dan Pendidikan Matematika 19%.
Terima kasih disampaikan kepada pemakalah yang telah
berpartisipasi pada desiminasi hasil kajian/penelitian yang dimuat pada
prosiding ini. Terimakasih juga disampaikan kepada tim
reviewer
, tim
prosiding, dan
steering committee
.
Semoga prosiding ini bermanfaat.
vi
DAFTAR ISI
Halaman
Halaman Judul
………..………..
i
Tim Prosiding
………..…………
.
ii
Tim
Reviewer
………..…………
.
iii
Steering Committee
………..……
iv
Kata Pengantar
………...
...
v
Daftar Isi
………..……….
vi
BIDANG ALJABAR
1
Bentuk-Bentuk Ideal pada Semiring (
Dian Winda
Setyawati………..
D
nxn(
Z
+), +, )
1
2
Penentuan Lintasan Kapasitas Interval Maksimum dengan Pendekatan
Aljabar Max-Min Interval
M. Andy Rudhito
dan D. Arif Budi Prasetyo...
………
.
8
3
Karakterisasi Aljabar Pada Graf Bipartit
Soleha
, Dian W. Setyawati………
………..………
.
18
4
Semigrup Bentuk Bilinear Terurut Parsial Reguler Lengkap dalam Batasan
Quasi-Ideal
Fuzzy
Karyati
, Dhoriva Urwatul Wutsqa………...
26
5
Syarat Perlu dan Cukup Ring Lokal Komutatif Agar Ring Matriksnya
Bersih Kuat (-Regular Kuat)
Anas Yoga Nugroho, Budi Surodjo
………..
34
6
Sifat-sifat Modul Komultiplikasi Bertingkat
Putri Widi Susanti, Indah Emilia Wijayanti
………
..
42
7
Ideal dari Ring Polinomial
F
2n[
x
]
mod
(
x
n-1) untuk Kontrol Kesalahan
dalam Aplikasi Komputer
Komar Baihaqi dan Iis Herisman
……….………
49
9
Submodul Hampir Prima
Dyana Patty
,
Sri Wahyuni
….………….……….……….
55
Subgrup Normal suatu Grup Perkalian dari Ring Pembagian yang Radikal
atas Subring Pembagian Sejati
Juli Loisiana Butarbutar dan Budi Surodjo
………..
64
Sifat dan Karakterisasi Submodul Prima Lemah
S(N)
Rosi Widia Asiani, Sri Wahyuni
………..
73
Modul Distributif dan Multiplikasi
Lina Dwi Khusnawati, Indah Emilia Wijayanti
………
vii
Penjadwalan Keberangkatan Kereta Api di Jawa Timur dengan
Menggunakan Model Petrinet dan Aljabar Max-plus
Ahmad Afif, Subiono ………
92
\
Optimalisasi Norm Daerah Hasil dari Himpunan Bayangan Matriks Aljabar
Maks-Plus dengan Sebagian Elemen Ditentukan
Antin Utami Dewi, Siswanto, dan Respatiwulan
………
107
Himpunan Bayangan Bilangan Bulat Matriks Dua Kolom dalam Aljabar
Maks-Plus
Nafi Nur Khasana, Siswanto, dan Purnami Widyaningsih
.………
112
BIDANG ANALISIS
Ruang 2-Norma Selisih
Sadjidon, Mahmud Yunus, dan Sunarsini
…….………..
120
Teorema Titik Tetap Pemetaan Kontraktif pada Ruang
C
[
a,b
]-
Metrik (ℓ
p,
d
C[a,b])
Sunarsini,
Sadjidon, Mahmud Yunus………..………..
124
Generalisasi Ruang Barisan Yang Dibangkitkan Oleh Fungsi Orlicz
Nur
Khusnussa’adah
dan Supaman
………..………..
132
Gerakan Kurva Parameterisasi Pada Ruang Euclidean
Iis Herisman dan Komar Baihaqi
…….………..
141
Penggunaan Metode Transformasi Diferensial Fraksional dalam
Penyelesaian Masalah Sturm-Liouville Fraksional untuk Persamaan Bessel
Fraksional
Marifatun, Sutrima, dan Isnandar Slamet
……….………..
148
Konsep Topologi Pada Ruang
C
[a,b]
Muslich
……….………..
155
Kekompakan Terkait Koleksi Terindeks Kontinu dan Ruang Topologis
Produk
Hadrian Andradi, Atok Zulijanto
……….………..
162
A Problem On Measures In Infinite Dimensional Spaces
Herry Pribawanto Suryawan
..
………..
171
Masalah Syarat Batas Sturm-Liouville Singular Fraksional untuk
Persamaan Bessel
Nisa Karunia, Sutrima, Sri Sulistijowati
H
………
179
BIDANG KOMBINATORIK
Pelabelan Selimut (a,d)-H-Anti Ajaib Super pada Graf Buku
viii
Digraf Eksentrik Dari Graf Hasil Korona Graf Path Dengan Graf Path
Putranto Hadi Utomo, Sri Kuntari, Tri Atmojo
Kusmayadi ………
193
Super (a, d)-H-Antimagic Covering On Union Of Stars Graph
Dwi Suraningsih, Mania Roswitha, Sri Kuntari
………
198
Dimensi Metrik pada Graf
Umbrella
Hamdani Citra Pradana dan Tri Atmojo Kusmayadi
………
202
Dimensi Metrik pada Graf
Closed Helm
Deddy Rahmadi dan Tri Atmojo Kusmayadi
. ………
..
210
Pelabelan Selimut (
a,b
)-
C
s+2-Anti Ajaib Super pada Graf
Generalized
Jahangir
Anna Amandha, Mania Roswitha, dan Bowo Winarno
………
215
Super (
a,d
)-H-Antimagic Total Labeling On Sun Graph
Marwah Wulan Mulia, Mania Roswitha
,
and Putranto Hadi Utomo
……
223
Maksimum dan Minimum Pelabelan pada Graf
Flower
Tri Endah Puspitosari, Mania Roswitha, Sri Kuntari
…………...………
..
231
BIDANG MATEMATIKA TERAPAN
2
Penghitungan Volume Konstruksi dengan Potongan Melintang
Mutia Lina Dewi
………..
.
238
4
Pola Pengubinan Parabolis
Theresia Veni Dwi Lestari dan Yuliana Pebri Heriawati
………
..
247
5
Analisis Kestabilan Model Mangsa Pemangsa Hutchinson dengan Waktu
Tunda dan Pemanenan Konstan
Ali Kusnanto, Lilis Saodah, Jaharuddin
……….
.
257
6
Susceptible Infected Zombie Removed (SIZR) Model with Quarantine and
Antivirus
Lilik Prasetiyo Pratama, Purnami Widyaningsih, and Sutanto
……….
264
7
Model Endemik
Susceptible Exposed Infected Recovered Susceptible
(
SEIRS
) pada Penyakit Influenza
Edwin Kristianto dan Purnami Widyaningsih
………...
272
9
Churn Phenomenon Pengguna Kartu Seluler dengan Model
Predator-Prey
Rizza Muamar As-Shidiq, Sutanto, dan Purnami Widyaningsih
…………
279
Pemodelan Permainan
Flow Colors
dengan
Integer Programming
Irfan Chahyadi
,
Amril Aman, dan Farida Hanum
………..
283
Optimasi Dividen Perusahaan Asuransi dengan Besarnya Klaim
Berdistribusi Eksponensial
ix
Permasalahan Kontrol Optimal Dalam Pemodelan Penyebaran Penyakit
Rubono Setiawan
………..
300
Model Pengoptimuman
Dispatching
Bus pada Transportasi Perkotaan:
Studi Kasus pada Beberapa Koridor Trans Jakarta
Farida Hanum,
Amril Aman, Toni Bakhtiar, Irfan Chahyadi
………..
306
Model Pengendalian Epidemi dengan Vaksinasi dan Pengobatan
Toni Bachtiar dan Farida Hanum
………..
315
How Realistic The Well-Known Lotka-Volterra Predator-Prey Equations
Are
Sudi Mungkasi
………..
323
Aplikasi Kekongruenan Modulo pada Algoritma Freund dalam
Penjadwalan Turnamen
Round Robin
Esthi Putri Hapsari, Ira Kurniawati
………..
334
BIDANG KOMPUTASI
Aplikasi Algoritma Enkripsi Citra
Digital
Berbasis
Chaos
Menggunakan
Three Logistic Map
Suryadi MT, Dhian Widya
………
344
Implementasi Jaringan Syaraf Tiruan Untuk Mengklasifikasi Kualitas Citra
Ikan
Muhammad Jumnahdi
……….….
352
Sistem Pengkonversi Dokumen eKTP/SIM Menjadi Suatu Tabel
Nurul Hidayat,
Ikhwan Muhammad Iqbal, dan Muhammad Mushonnif
Junaidi
………...
360
Kriptografi Kurva Eliptik Elgamal Untuk Proses Enkripsi-Dekripsi Citra
Digital Berwarna
Daryono Budi Utomo,
Dian Winda Setyawati dan Gestihayu Romadhoni F.R373
Penerapan
Assosiation Rule
dengan Algoritma Apriori untuk Mengetahui
Pola Hubungan Tingkat Pendidikan Orang Tua terhadap Indeks Prestasi
Kumulatif Mahasiswa
Kuswari Hernawati
………...
384
Perancangan Sistem Pakar Fuzzy Untuk Pengenalan Dini Potensi
Terserang Stroke
Alvida Mustika R., M Isa Irawan dan Harmuda Pandiangan
………..
394
Miniatur Sistem Portal Semiotomatis Berbasis Sidik Jari pada Area
Perpakiran
x
BIDANG STATISTIKA
1
Uji Van Der Waerden Sebagai Alternatif Analisis Ragam Satu Arah
Tanti Nawangsari
………
..
417
2
Analisis Faktor-Faktor Yang Mempengaruhi Keberhasilan Mahasiswa
Politeknik (Studi Kasus Mahasiswa Polban)
Euis Sartika
………...…
..
425
3
Distribusi Prior Dirichlet yang Diperumum sebagai Prior Sekawan dalam
Analisis Bayesian
Feri Handayani, Dewi Retno Sari Saputro
…………...………
439
5
Pemodelan Curah Hujan Dengan Metode
Robust
Kriging Di Kabupaten
Sukoharjo
Citra Panindah Sari, Dewi Retno Sari S, dan Muslich
………
444
6
Premi Tunggal Bersih Asuransi Jiwa Endowment Unit Link Dengan
Metode Annual Ratchet
Ari Cahyani, Sri Subanti, Yuliana Susanti
……….……….
453
7
Uji Siegel-Tukey untuk Pengujian Efektifitas Obat Depresan pada Dua
Sampel Independen
David Pratama dan Getut Pramesti
………..………
462
8
Aplikasi
Almost Stochastic Dominance
dalam Evaluasi Hasil Produksi Padi
di Indonesia
Kurnia Hari Kusuma, Isnandar Slamet, dan Sri Kuntari
………
..
470
9
Pendeteksian Krisis Keuangan Di Indonesia Berdasarkan Indikator Nilai
Tukar Riil
Dewi Retnosari, Sugiyanto, Tri Atmojo
………...
.
475
Pendekatan
Cross-Validation
untuk Pendugaan Data Tidak Lengkap pada
Pemodelan AMMI Hasil Penelitian Kuantitatif
Gusti Ngurah Adhi Wibawa dan Agusrawati
………
483
11
Aplikasi Regresi Nonparametrik Menggunakan Estimator Triangle pada
Data Meteo Vertical dan Ozon Vertikal, Tanggal 30 Januari 2013
Nanang Widodo, Tony Subiakto, Dian Yudha R, Lalu Husnan W
……….
493
12
Pemodelan Indeks Harga Saham Gabungan dan Penentuan Rank
Correlation dengan Menggunakan Copula
Ika Syattwa Bramantya, Retno Budiarti, dan I Gusti Putu Purnaba
……..
502
13
Identifikasi Perubahan Iklim di Sentra Produksi Padi Jawa Timur dengan
Pendekatan
Extreme Value Theory
Sutikno dan Yustika Desi Wulan Sari
………..
513
15
Analisis Data Radiasi Surya dengan Pendekatan Regresi Nonparametrik
Menggunakan Estimator Kernel Cosinus
xi
16
Pengujian Hipotesis pada Regresi Poisson Multivariate dengan Kovariansi
Merupakan Fungsi dari Variabel Bebas
Triyanto, Purhadi, Bambang Widjanarko Otok, dan Santi Wulan Purnami
533
17
Perbandingan Metode Ordinary Least Squares (OLS), Seemingly
Unrelated Regression (SUR) dan Bayesian SUR pada Pemodelan PDRB
Sektor Utama di Jawa Timur
Santosa, AB, Iriawan, N, Setiawan, Dohki, M
………
544
19
Studi Model Antrian M/G/1: Pendekatan Baru
Isnandar Slamet
………
557
20
Pengaruh Pertumbuhan Ekonomi dan Konsumsi Energi Terhadap Emisi
CO
2di Indonesia: Pendekatan Model Vector Autoregressive (VAR)
Fitri Kartiasih
………...……….
567
21
Estimasi Parameter Model Epidemi
Susceptible Infected Susceptible
(
SIS
)
dengan Proses Kelahiran dan Kematian
Pratiwi Rahayu Ningtyas, Respatiwulan, dan Siswanto
.………….………
578
22
Pendeteksian Krisis Keuangan di Indonesia Berdasarkan Indikator Harga
Saham
Tri Marlina, Sugiyanto, dan Santosa Budi Wiyono
……….
584
23
Pemilihan Model Terbaik untuk Meramalkan Kejadian Banjir di
Kecamatan Rancaekek, Kabupaten Bandung
Gumgum Darmawan, Restu Arisanti, Triyani Hendrawati, Ade Supriatna
592
24
Model Markov
Switching Autoregressive
(
MSAR
) dan Aplikasinya pada
Nilai Tukar Rupiah terhadap Yen
Desy Kurniasari, Sugiyanto, dan Sutanto
………
.
602
25
Pendeteksian Krisis Keuangan di Indonesia Berdasarkan Indikator
Pertumbuhan Kredit Domestik
Pitaningsih, Sugiyanto, dan Purnami Widyaningsih
………
608
26
Pemilihan Model Terbaik untuk Meramalkan Kejadian Banjir di Bandung
dan Sekitarnya
Gumgum Darmawan, Triyani Hendrawati, Restu Arisanti
………
615
27
Model Probit Spasial
Yuanita Kusuma Wardani, Dewi Retno Sari Saputro
………
623
28
Peramalan Jumlah Pengunjung Pariwisata di Kabupaten Boyolali dengan
Perbandingan Metode Terbaik
Indiawati Ayik Imaya, Sri Subanti
………..……
... 628
29
Pemodelan Banyaknya Penderita Demam Berdarah
Dengue
(DBD) dengan
Regresi
Kriging
di Kabupaten Sukoharjo
xii
Ekspektasi Durasi Model Epidemi
Susceptible Infected
(
SI
)
Sri Kuntari, Respatiwulan, Intan Permatasari
……….
646
BIDANG PENDIDIKAN
3
Konsep Pembelajaran Integratif dengan Matematika Sebagai Bahasa
Komunikasi dalam Menyongsong Kurikulum 2013
Surya Rosa Putra, Darmaji, Soleha, Suhud Wahyudi,
………
.
653
4
Penerapan Pendidikan Lingkungan Hidup Berbasis Pendidikan Karakter
dalam Pembelajaran Matematika
Urip Tisngati
……….
664
5
Studi Respon Siswa dalam Menyelesaikan Masalah Matematika
Berdasarkan Taksonomi SOLO (Structure of Observed Learned Outcome)
Herlin Widia, Urip Tisngati, Hari Purnomo Susanto
………
..
677
7
Desain Model Discovery Learning pada Mata Kuliah Persamaan
Diferensial
Rita Pramujiyanti Khotimah, Masduki
………
.. 684
8
Efektivitas Pembelajaran Berbasis Media Tutorial Interaktif Materi
Geometri
Joko Purnomo, Agung Handayanto, Rina Dwi Setyawati
………
693
10
Pengembangan Modul Pembelajaran Matematika Menggunakan
Pendekatan Problem Based Learning (PBL) Pada Materi Peluang Kelas
VII SMP
Putri Nurika Anggraini, Imam Sujadi, Yemi Kuswardi
………
703
11
Pengembangan Bahan Ajar Dalam Pembelajaran Geometri Analitik Untuk
Meningkatkan Kemandirian Mahasiswa
Sugiyono\, Himmawati Puji Lestari
………..………
711
13
Pengembangan Strategi Pembelajaran Info Search Berbasis PMR untuk
Meningkatkan Pemahaman Mata Kuliah Statistika Dasar 2
Joko Sungkono, Yuliana, M. Wahid Syaifuddin
………
724
14
Analisis Miskonsepsi Mahasiswa Program Studi Pendidikan Matematika
Pada Mata Kuliah Kalkulus I
Sintha Sih Dewanti
………..………..…….
731
Kemampuan Berpikir Logis Mahasiswa yang Bergaya Kognitif Reflektif
vs Impulsif
Warli
……….
742
Model Pembelajaran Berbasis Mobile
xiii
Profil Gaya Belajar Myers-Briggs Tipe Sensing-Intuition dan Strateginya
Dalam Pemecahan Masalah Matematika
Rini Dwi Astuti, Urip Tisngati, Hari Purnomo Susanto
………
.. 760
Penggunaan Permainan Matematika Berbasis Lingkungan Hidup untuk
Menningkatkan Minat dan Keterampilan Matematis Peserta Didik
Rita Yuliastuti
………..
772
Tingkat Pemahaman Peserta PLPG Matematika Rayon 138 Yogyakarta
Tahun 2014 Terhadap Pendekatan Saintifik Pada Kurikulum 2013
Berdasarkan Kuesioner Awal dan Akhir Pelatihan
Beni Utomo, V. Fitri Rianasari dan M. Andy Rudhito
………
..
784
Pengembangan Perangkat Pembelajaran Matematika Melalui Pendekatan
RME dengan CD Interaktif Berbasis Pendidikan Karakter Materi Soal
Cerita Kelas III
Sri Surtini, Ismartoyo, dan Sri Kadarwati
……….
791
E-Learning Readiness Score Sebagai Pedoman Implementasi E-Learning
Nur Hadi Waryanto
………..
805
Pengembangan Lembar Kerja Siswa (LKS) Matematika Realistik di SMP
Berbasis Online Interaktif
Riawan Yudi Purwoko, Endro Purnomo
………..
817
IbM APE Matematika Bagi TK Pinggiran Di Kota Malang
323
PREY EQUATIONS ARE
Sudi Mungkasi
Department of Mathematics, Faculty of Science and Technology, Sanata Dharma University, Mrican, Tromol Pos 29, Yogyakarta 55002, Indonesia. Email: [email protected]
ABSTRACT. This paper gives assessment to the Lotka-Volterra predator-prey equations. A review of the mathematical model and solutions are presented. Our description is given with examples to help in understanding the behavior of the solution to the problem. The judgment on how realistic the model is given. This paper can be used as a reference for pedagogical purposes.
Keywords: Lotka-Volterra, predator-prey, population growth, biological
model, realistic model
1. INTRODUCTION
An attempt to define mathematically the relationship between the population of a predator and that of its prey is the development of the Lotka-Volterra predator-prey equations. These equations were originally developed by Lotka (1925) and Volterra (1926) independently. This model can be found in some textbooks written such as by Chaston (1971), Cronin (1980), Grossman and Turner (1974). New developments of this model are done by some authors, such as Lin (2011), Liu, Ren, and Li (2011), Pang and Wang (2004), Shen and Li (2009).
In this paper, we investigate the behaviour of the solution to the Lotka-Volterra predator-prey equations by examples. We present the effects of increasing populations and the effects of the change of initial conditions. We discuss the existence of a stable configuration of the populations and the effects of the change of growth rate of the populations. How realistic the model is also discussed.
The remaining of this paper is organized as follows. Section 2 presents a review of the Lotka-Volterra predator-prey. Section 3 gives the assessment on how realistic the Lotka-Volterra model is. In Section 4 we wrap up the paper with some remarks.
2. AREVIEWOFTHELOTKA-VOLTERRAMODEL
In this section, we review the behavior of the solution to the Lotka-Volterra predator-prey equations. The effects of some changes are described by examples.
The Lotka-Volterra predator-prey equations
2 1 1
1 rN pN N
dt
dN
, (1)
2 2 1
2 pN N dN
dt dN
Seminar Nasional Matematika 2014 324 Prosiding
Here, N1 is the population of a prey species (for example, rabbits), N2 is the population of the predator species (for example, foxes), r is the doubling rate of the prey species, p is the rate of predation of the predator on the prey and d is the death rate of the predator.
2.1. The effects of increasing population
Suppose that we have the growth rate of prey r2, the death rate of predator d5, the predation rate p2, the initial population of prey (rabbits) N1(0)0.5, and the
initial population of predators (foxes) N2(0)1 . When the population of rabbits
increases, the population of foxes decreases slightly but then increases sharply. An increase of the population of foxes leads to a decrease of the population of rabbits. Figure 1 represents the fluctuation of the two species.
Figure 1: Graph for the population of rabbits (solid-line) and that of foxes (dash-line) where r2, d5, p2, N1(0)0.5, and N2(0)1.
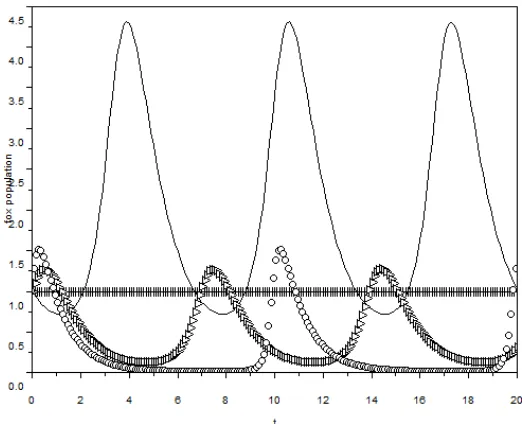
Table 1: Experiment for various initial conditions for the populations.
) 0 ( 1
N N2(0) Type of line in Figure 2
0.5 1.0 Solid line (---)
1.0 0.5 Pluses (++++)
2.0 2.0 Triagles ()
5.0 5.0 Circles (oooo)
Seminar Nasional Matematika 2014 325 Prosiding
2.2. Change of the rates and that of initial conditions
Running the script with the growth rate of prey r1, the death rate of predator 10
d , and the predation rate p1 leads to a longer cycle-period than that presented in Subsection 2.1. In this case, the population of foxes sometimes „disappears‟. In other words, in some specific time the population of foxes is very close to zero, but it is not zero theoretically. The population of foxes increases dramatically when the population of rabbits is about maximum. The increase of the population of foxes affects the population of rabbits to go down sharply, and then it is followed by a very sharp decrease of the number of foxes.
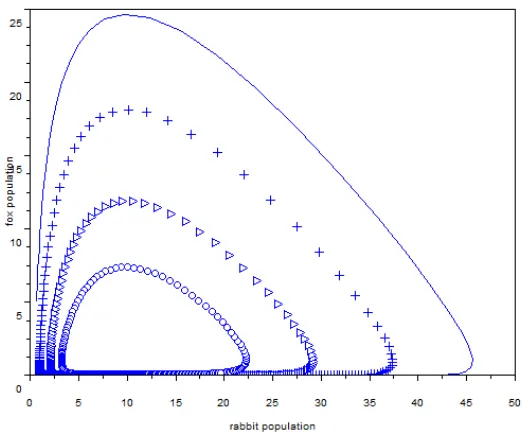
If the initial conditions are changed, the ranges of populations change. From Figure 2, the maximum number of rabbits and foxes changes, but the trends are the same. In this experiment, we take the initial conditions as shown in Table 1.
Figure 2: Phase portraits for various initial conditions of the populations
of rabbits and foxes with r1, d10, p1 based on Table 1.
2.3. Existence of stable configuration
A stable configuration exists for every set of parameters r, d, and p constants where
p non-zero (for Lotka-Volterra equations the parameters are all positive). In addition, we have to notice that only N10 and N20 are feasible since negative values of the populations are not realistic. Furthermore, the populations are stable if there are no changes of the populations over time. This means
0
2
1
dt dN dt dN
, (3)
Consequently, we have rN1pN1N20, and pN1N2dN20. By solving these two
Seminar Nasional Matematika 2014 326 Prosiding
0
1
N and N2 0; (4)
p d N1 and
p r
N2 . (5)
If the initial conditions is N1(t)0 and N2(t)0 for t0, then the population of rabbits
is always 0, and the population of foxes is also always 0. Assuming that the initial conditions are non-zero populations, N1(t)0 and N2(t)0 for t0, then the stable
configuration for every set of parameters r, d, and p is that
p d N1 ,
p r
N2 , (6)
where p is non-zero. Therefore, for r1,d 10, p1, the stable population for rabbits is
10 1
N and the stable population for foxes is N21.
Two remarks that should be noted are:
Remark A If the initial conditions is N10 and N2 0 then equations (1), (2) becomes
1
1 rN
dt dN
. (7)
The solution for this equation is N1kexp(rt) for some k, where k is positive to be realistic. In this case, the population of rabbits grows exponentially, while the population of foxes is always 0.
Remark B If the initial conditions is N10 and N20 then equations (1), (2) becomes
2
2 d N
dt dN
. (8)
The solution for this equation is N2exp(dt) for some
, where
is positive to be realistic. In this case, the population of foxes drops exponentially and asymptotically towards 0, while the population of rabbits is always 0.2.4. Effects of increasing growth rate of the prey and that of increasing predation
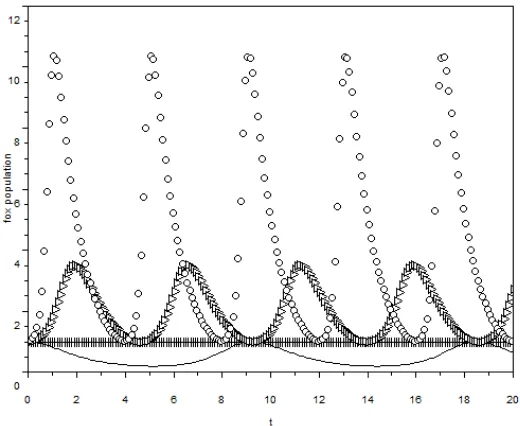
The higher the growth rate of rabbits leads to the more periodic cycles of both populations, unless the populations are stable. Furthermore, the range of rabbit population is larger when the growth rate of rabbits is higher. Figure 3 represents rabbit population with various growth rates of rabbits related to the experiment in Table 2. Note that, in this experiment, we take four different growth rates of rabbits, other parameters are fixed and the initial conditions are also fixed as shown in Table 2.
Seminar Nasional Matematika 2014 327 Prosiding
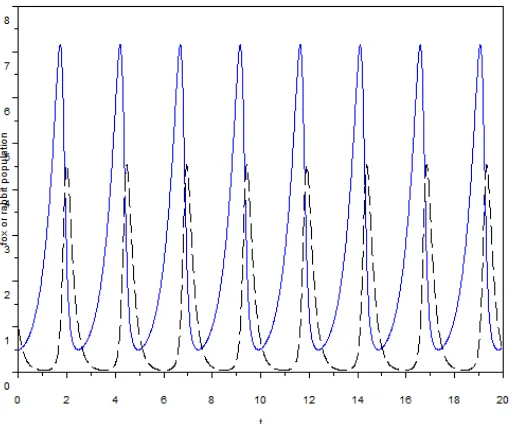
On the contrary, the higher the predation rate affects the longer period for a cycle of the system unless the populations are stable. In other words, the cycles of both populations are less periodic when the predation rate is higher as shown in Figures 5 and 6. Note that, now, we take four different predation rates, other parameters are fixed and the initial conditions are also fixed as in Table 3.
2.5. A case regarding the doubling rate of the prey species
Given that rabbits breed once every 15 days with an average litter size of three, that male and female rabbits are born in equal proportions, and that rabbits are always eaten by foxes before they die of other causes. We can find the correct value of r as follows.
Let the initial population of rabbits is N1(0), that is 21N1(0) males and (0)
1 2 1N
females. After 15 days all females breed with an average litter size of three so that the new population of rabbits is
) 0 ( ) 0 ( 3 ) 0 ( ) 15
( 2 1
5 1 2 1 1
1 N N N
N . (9)
If there is no foxes in the system, then p0 and the equation for the population of rabbits is
1
1 rN
dt dN
. (10)
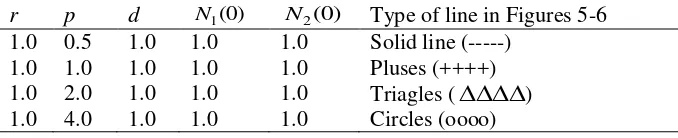
Table 2: Setting parameter values with various growth rates of rabbits.
r p d N1(0) N2(0) Type of line in Figures 3-4 0.5 1.0 1.0 1.0 1.0 Solid line (---)
1.0 1.0 1.0 1.0 1.0 Pluses (++++) 2.0 1.0 1.0 1.0 1.0 Triagles () 4.0 1.0 1.0 1.0 1.0 Circles (oooo)
Table 3: Setting parameter values with various predation rates.
r p d N1(0) N2(0) Type of line in Figures 5-6
Seminar Nasional Matematika 2014 328 Prosiding
Figure 3: Rabbit population with various growth rates of rabbits based Table 2.
Figure 4: Fox population with various growth rates of rabbits based on Table 2.
Integrating the previous equation, we obtain
rdtN dN
1 1
. (11)
Seminar Nasional Matematika 2014 329 Prosiding
Figure 5: Rabbit population with various predation rate based on Table 3.
Figure 6: Fox population with various predation rate based on Table 3.
Since we have the value of N1(t) for t0, then kN1(0). Consequently, the population
of rabbits in the time-step t is
t r
e N t
Seminar Nasional Matematika 2014 330 Prosiding
Substituting () 2 1(0)
5
1 t N
N for t15 in the above equation, we get
52ln 15
1
r . (13)
2.6. A case regarding the death rate of the predator and the rate of predation
Foxes live an average of three years in the wild but survive only three days without food. We can find the correct values of p and d as follows. Let the initial population of foxes is N2(0). If there is no food, i.e. there is no rabbits, then one third of the foxes die
and only two thirds of foxes are still alive in the following day. This means that
) 0 ( 3 2 ) 1 ( 2 2 N
N . (14)
If there is no rabbits in the system, then p0 and the equation for the population of foxes is
2
2 dN
dt dN
. (15)
Solving it in a similar way to that in Subsection 2.5., we get N2(t)edt,
is constant. Since we have the value of N2(t) for t0 , then N2(0) . Consequently, thepopulation of foxes in the time-step t is
t d
e N t
N2( ) 2(0) . (16) Substituting () 3 2(0)
2
2 t N
N for t1 in the above equation, we get
ln( )ln 32
3
2
d . (17)
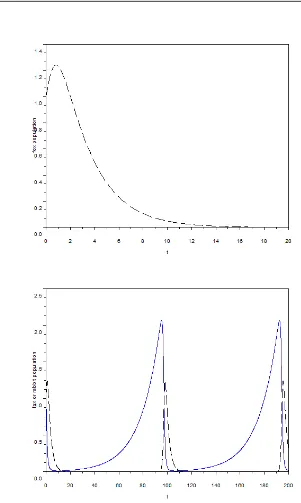
Given that each fox eats one rabbit per day. It means that the rate of predation of the predator on prey is one, and we write p1. If these conditions together with those in Subsection 2.5 are correct, foxes can still survive, but the period of the cycle is becoming much larger. When we look at the time from 0 to 20 unit-time, it seems that foxes cannot survive. Figure 7 represents this phenomenon.
However, if we look at a longer duration, say between 0 and 200 unit-time, it is clear that the foxes can survive still as well as the rabbits. Figure 8 represents the cycle for both populations for the time between 0 and 200 unit-time. The solid-line is the population of rabbits and the dash-line is the population of foxes.
3. HOW REALISTIC THE LOTKA-VOLTERRA MODEL
These Lotka-Volterra equations are not very realistic in terms of explaining the interaction between predators and preys, and are limited under conditions that are used to build the model, but qualitatively we can say that this model is fair-realistic. It is understandable that there is no such model that is really perfect to explain the real system.
Recall the statement in Subsection 2.1.: “when the fox population is at a maximum, the rabbit population is declining and that decline induces a drop in the number of foxes; the reduction of predators allows the rabbits to thrive followed by an increase in the
Seminar Nasional Matematika 2014 331 Prosiding
that the equations are realistic. However, once again we should be aware that these equations are just a simplification of the real system. These equations are limited to the assumptions that are used to build the model. There are many other facets which are not included in the equations to describe the interaction between the two populations, for example the ability of the preys to find a refuge which makes it impossible for them to be caught, and changes in the environment conditions.
One of the weaknesses of these equations is that there is an unbounded exponential growth for the rabbit population when there are no predators (see Remark A in Subsection 2.3.). If we consider this weakness in the real world, those equations are not realistic. In the real world, the population of rabbits is not only influenced by the population of foxes. Both populations may be affected by space, climate, pollution, diseases, etc. The unbounded exponential growth of the population is one of the reasons which makes that the model is not realistic.
In addition, in place of exponential growth for the rabbits when there are no predators, it can be supposed that the growth is logistic so that
2 1 2 1 1
1 rN gN pN N
dt
dN
(18)
2 2 1
2 pN N dN
dt dN
(19)
which includes equations (1), (2) as a special case with g0. Furthermore, if we suppose that Aoof rabbits can find a refuge, the model becomes
2 1
2 1 1
1 rN gN p (N A )N
dt dN o (20) 2 2 1
2 p(N A )N dN
dt dN
o
(21)
We can still generalise Lotka-Volterra equations with more general assumptions to make the model more realistic. One of the more general forms is that so called Rosenzweig-MacArthur model (Jones and Sleeman, 1983).
4. CONCLUSION
We have investigated the Lotka-Volterra predator-prey equations. Our presentation yields nice pedagogical materials. This paper can be extended to the use of a computer software for the investigation of the considered model.
ACKNOWLEDGEMENT
Seminar Nasional Matematika 2014 332 Prosiding
Figure 7: Population of foxes r(1/15)ln
5/2 , dln
3/2
, p1 with initial conditions N1(0)1 and N2(0)1 from 0 to 20 unit-time.Figure 8: Population of rabbits (solid line) and foxes (dashes) where
5/2 ln ) 15 / 1 (
Seminar Nasional Matematika 2014 333 Prosiding
REFERENCES
[1] Chaston, I. 1971. Mathematics for Ecologists. London: Butterworth.
[2] Cronin, J. 1980. Differential Equations: Introduction and Qualitative Theory. New York: Marcel Dekker.
[3] Grossman, S. I., Turner, J. E. 1974. Mathematics for the Biological Sciences. New York: Macmillan.
[4] Jones, D. S., Sleeman, B. D. 1983. Differential Equations and Mathematical Biology. London: George Allen & Unwin.
[5] Lin, G. 2011. Spreading speeds of a Lotka–Volterra predator–prey system: The role of the predator. Nonlinear Analysis: Theory, Methods & Applications, Vol. 74, pp. 2448–2461.
[6] Liu, X., Ren, Y., Li, Y. 2011. Four Positive Periodic Solutions of a Discrete Time Lotka-Volterra Competitive System With Harvesting Terms. Opuscula Mathematica, Vol. 31, pp. 257–267.
[7] Lotka, A. J. 1925. Elements of Physical Biology. Baltimore: Williams & Wilkins. [8] Pang, P., Wang, M. 2004. Strategy and stationary pattern in a three-species predator–
prey model. Journal of Differential Equations, Vol. 200, pp. 245–273.
[9] Shen, J., Li, J. 2009. Existence and global attractivity of positive periodic solutions for impulsive predator–prey model with dispersion and time delays. Nonlinear Analysis: Real World Applications, Vol. 10, pp. 227–243.