Other uses, including reproduction and distribution, or selling or
licensing copies, or posting to personal, institutional or third party
websites are prohibited.
In most cases authors are permitted to post their version of the
article (e.g. in Word or Tex form) to their personal website or
institutional repository. Authors requiring further information
regarding Elsevier’s archiving and manuscript policies are
encouraged to visit:
A two-age-classes dengue transmission model
A.K. Supriatna
a,*, E. Soewono
b, S.A. van Gils
caDepartment of Mathematics, Universitas Padjadjaran, Jl. Raya Bandung-Sumedang Km 21, Jatinangor, Sumedang, West Java 45363, Indonesia bIndustrial and Financial Mathematics Group, Institut Teknologi Bandung, Jl. Ganesha 10, Bandung 40132, Indonesia
cDepartment of Applied Mathematics, University of Twente, P.O. Box 217, 7500 AE Enschede, The Netherlands
a r t i c l e
i n f o
Article history: Received 31 May 2007
Received in revised form 20 August 2008 Accepted 21 August 2008
Available online 3 September 2008
Keywords:
Dengue transmission model Basic reproduction number Critical vaccination level
a b s t r a c t
In this paper, we discuss a two-age-classes dengue transmission model with vaccination. The reason to divide the human population into two age classes is for practical purpose, as vaccination is usually con-centrated in one age class. We assume that a constant rate of individuals in the child-class is vaccinated. We analyze a threshold number which is equivalent to the basic reproduction number. If there is an undeliberate vaccination to infectious children, which worsens their condition as the time span of being infectious increases, then paradoxically, vaccination can be counter productive. The paradox, stating that vaccination makes the basic reproduction number even bigger, can occur if the worsening effect is greater than a certain threshold, a function of the human demographic and epidemiological parameters, which is independent of the level of vaccination. However, if the worsening effect is to increase virulence so that one will develop symptoms, then the vaccination is always productive. In both situations, screening should take place before vaccination. In general, the presence of class division has obscured the known rule of thumb for vaccination.
Ó2008 Elsevier Inc. All rights reserved.
1. Introduction
One of the most important public health programs in many tropical countries is the program to control or to eliminate dengue. This is because dengue is regarded as a very dangerous disease that may lead to death. The disease is caused by one of four known strains of flavivirus, namely DEN-1, DEN-2, DEN-3, and DEN-4. It is transmitted mainly by femaleAedes aegypti, although it is also reported thatAedes albopictuscan transmit the disease in some cir-cumstances. The modes of transmission known in the literature are among others vertical transmission from the female adult mosqui-toes to their young, mechanical transmission from a healthy mos-quito that has just bitten an infectious human to a healthy human, and from an infectious mosquito to a healthy human. There are three stages of severity of an infected human: dengue fever (DF) comes with mild cold symptoms, dengue hemorrhagic fever (DHF) causes blood discharge from the vessel, and dengue shock syndrome (DSS) that may lead to death[20]. In the endeavor to eliminate the disease, some efforts have already been made in many countries, such as destroying the adult class of the mosqui-toes with insecticides and stimulating predation of the larval class of the mosquitoes. Some other attempts are being investigated, such as modifying the age structure of the mosquitoes, e.g. by low-ering their life expectancy genetically, introducing a transgenic
mosquitoes population, e.g. by sterilizing male mosquitoes and developing a safe vaccine that can protect humans from the four known dengue viruses[6,21,27,33].
In the past, dengue has been recognized as a young children’s disease. It attacks mostly children at the age of 3–6 years. How-ever, it has been reported that nowadays there is a change in this trend. The predominant age to acquire dengue in Uttaradict Thai-land has changed and increased by at least 2 years[35]. Other data showing the increase of the mean age at infection can be found in
[32,46], in which the authors show that the mean age at infection in the city of Bandung Indonesia has increased from 19 years in the year 2003 to 25.5 years in the year 2004. The same figure also shows up in other part of Indonesia, in which among those who are infected, the population in the age class of 10–19 years ac-counted for the largest proportion of hospitalized DHF cases, fol-lowed by children 5–9 years and children of 4 years old [7]. Similar data from Singapore also show that the risk partly shifts from children to adults[34]. These changes in pattern have made the management of the disease even more difficult. In order to manage the disease, one needs to understand the dynamics of the spreading of the disease. Some health scientists have tried to obtain some insight in the transmission and elimination of the dis-ease using mathematical modeling. Here, we mention for instance
[41]. Many mathematical models have been devoted to address this issue since then, including the seminal work of[26]. In the fol-lowing section we will review some mathematical models of den-gue transmission.
0025-5564/$ - see front matterÓ2008 Elsevier Inc. All rights reserved. doi:10.1016/j.mbs.2008.08.011
* Corresponding author. Tel./fax: +62 22 7794696.
E-mail address:aksupriatna@bdg.centrin.net.id(A.K. Supriatna).
Contents lists available atScienceDirect
Mathematical Biosciences
2. Review on mathematical models for dengue
Among the earliest mathematical models for the transmission of dengue are those developed in[12,17]which are closely related to the models for the transmission of malaria discussed in[4,11]. The authors in[17]discuss the model for two types of viruses by allowing temporary cross immunity and increased susceptibility to the sec-ond infection due to the first infection. They argue that there is com-petitive exclusion with the first strain of virus as the winner, if the susceptibility index of the first strain of the virus is greater than that of the second strain. Analytical stability results are established in case virulence is absence. The stability results for the virulence case are derived numerically. They also argue that age structure may in-crease the realism of the model. The author in[20]points out that age is among the risk factors that lead to the severity of dengue and in-deed most of the patients having DHF are less than 15 years old. The data in [45]support the claims regarding the importance of age structure in the transmission of dengue.
Competitive exclusion or strain replacement, as shown in[17], is also observed in [25] as a result of excessive vaccination, in which the strain with a larger basic reproduction number outcom-petes the strain with a smaller basic reproduction number. The authors in[9]have developed a two-strain dengue model, different from that of[17]. The authors in[9]assume that the viruses one after another. They argue that the susceptibles for the second infection are those individuals who have recovered from the first infection. They show that the condition needed for the system to be free from the disease, is that the vaccination level should be above a certain threshold. They also point out that controlling by reducing the number of mosquitoes is not sufficient, since it will only delay the time for the disease to outbreak. This is supported by[33].
The authors in[12]derive a threshold parameter for their mod-el of dengue with one strain of virus. They have established a the-orem concerning the global stability of the endemic equilibrium, concluding that if this threshold parameter is larger than one, then the endemic equilibrium is globally stable and otherwise it is unstable. They have generalized the model to include a variable human population in[13]and have included a secondary infection in[15]. Unlike the model discussed in[17], the model in[15]has a different formulation, namely with a variable host population and without virulence. They give sufficient conditions for coexistence of the two strains of viruses. They also consider mechanical and vertical transmission[14]and conclude that mechanical transmis-sion has less impact than vertical transmistransmis-sion.
Although there are many papers on age-structured epidemic models, however, in modeling the spreading of dengue, most of the researchers have ignored this important age structure factor. Exceptions are [37,38]. The authors in[37] have generalized the model in [12] by separating the human population into age co-horts, and for each cohort by deriving a set of SIR equations. Dis-ease free and endemic equilibria are found, but there is no stability analysis for these equilibria. Instead they have used the model to calculate the age-specific transmission rate for the DHF data in several places in Thailand. In[38], the authors have simpli-fied their model to a two-age-classes model. They allow different transmission rates for the adult and the juvenile classes and as-sume that juveniles have a higher transmission rate. They have found disease free and endemic equilibria, and the condition for the local stability of the disease-free equilibrium in the general case. The stability condition for the endemic equilibrium has only been found for the special case, in which no infection occurs for the adult class. They also argue that the effect of age structure is to in-crease the period of fluctuation in both the susceptible and the infective populations in approaching the endemic equilibrium.
Fluctuation in the vector population is likely. There is a mathe-matical model that considers this fluctuation for a closely related vector-borne disease, leishmaniasis, which is transmitted to hu-man by female flies[2]. In this model the authors assume a peri-odic function as the recruitment function of the fly population. They also assume that the infective human population is struc-tured by the time elapsed since the infection occurred. Their main conclusion is the formula for the basic reproduction number of a vector-borne disease with a periodic vector population. Another paper that takes fluctuation into account is[43], which also consid-ers a periodic recruitment rate. However, the authors in [18,19]
have argued that a cyclical epidemic in the case of dengue is most likely caused by the presence of multiple strains of viruses.
Another biological complication that arises in the literature regarding vector-borne diseases is the presence of multiple hosts. In this case the authors in[28]have studied the dynamics of Afri-can Horse Sickness, which is transmitted by biting midges
Culicoi-des imicola among horses and donkeys, however, in the case of
dengue, humans form the only main natural host. Transmission to other mammals is negligible. Other possibilities to make the model more realistic can be achieved by considering multiple vec-tors. The main vector of dengue in the urban area isA. aegypti, how-ever, other species, such as A. albopictus, are also potential to transmit the disease, though they are less anthropophylic.
The previous mentioned papers mainly discuss the dynamics of the disease. There are also some studies emphasizing to find the formula for the basic reproduction number R0and to estimate it
from available data. The simplest one is found in[29], where the dynamics in this paper is only given by the host without the vector. This work has been generalized in[8,16,30,31]to include the incu-bation time both for the vector and the host, and to include spatial heterogeneity. The authors in[18]have developed a technique to estimate the value ofR0with strain-specific forces of infection.
Re-cently there is a caveat in using the concept ofR0as a guidance to
control the transmission of a vector-borne disease. Despite the common use of the concept ofR0in determining the strength of
general infectious diseases and in controlling their transmission, the authors in[24,40]argue thatR0can mislead and underestimate
the effort to control a vector-borne disease, such as dengue. They have developed a new method that leads to the so called type reproduction number.
In this paper, we discuss a two-age-classes dengue transmission model with vaccination by comparing the basic reproduction num-ber as a control to eliminate the disease. We divide the human pop-ulation into two age classes: the child-class and the adult-class. The reason to divide the human population into two age classes is for practical purposes, as vaccination is usually concentrated in one age class, e.g. the school age class. A study in[42]shows that a pedi-atric dengue vaccination, that is a vaccination program which targets children, would be economically viable and highly cost-effective, once a perfect dengue vaccine is made. Apart from the inclusion of age classes, this model differs from a simple case of vaccination in
[44], as here vaccination involves not only the newborns and there is an outflow of vaccinated individuals to the immune class in a lin-ear effect form. This makes the model more realistic.
conclude that the estimated asymptomatic infection rate is as high as eight cases per 1000 persons per year. This ‘iceberg phenome-non’ is typical in dengue infection, such as shown in[21,23,36]. This has led to the division of each age class into two subclasses, those with symptomatic infection and those with asymptomatic infection. Typical rates for each subclass, for example, are por-trayed in[42]. To model this situation we use a discrete or com-partmental SIR model with an addition of a symptomatic or severely infected class, which we assume is not contributing to the transmission of the disease, since individuals in this class are easily identified and most likely isolated by hospitalization.
Furthermore, we also assume that a constant rate of individuals in the child-class is vaccinated. This can be done in a relatively small and controllable population, e.g. in a district or town. How-ever, since most of the infected children are asymptomatic, we cannot differentiate between the asymptomatic infected children and the healthy children as the target of vaccination. As a result, there will be a portion of the infectious children, that is vaccinated unintentionally. In this case, there is a possibility of a worsening ef-fect, due to the presence of cross-reactive antibodies mechanism that enhances the severity of the infection[19]. This mechanism is complex and still not fully comprehended[18].
We devise two models, one assuming that the unintentional vaccination increases the infectious period. Another one assumes that unintentional vaccination leads to the development of symp-toms. The results in this paper show that in the former case, vacci-nation can be counter productive, in the sense that it makes the basic reproduction number even bigger, if the worsening effect is greater than a certain threshold. However, in the later case, that is, if the worsening effect is to increase virulence so that the chil-dren will develop severe symptoms, then the vaccination is always productive.
3. Child-class vaccination with worsening effect on the sojourn time of infection
3.1. The mathematical model
Let us assume that the total population is divided into two age classes. The number of individuals in the child-class and the adults-class is denoted byN1andN2, respectively. Let us also assume
that the total number of individual in age classjat timet, i.e.NjðtÞ,
j¼1;2, is composed of the number of susceptible individuals,SjðtÞ, the number of asymptomatic infective individuals,IjðtÞ, the number of symptomatic or severely infective individuals,DjðtÞ, and the
num-ber of recovered or immune individual,RjðtÞ. The constant recruit-ment rates for humans and mosquitoes areBandBv, respectively. The natural death rates for humans and mosquitoes are
l
andl
v,respectively. The forces of infection for humans and mosquitoes are functions of the biting rate per mosquitobi, and the probability of successful infectionpiin a human andpvin a mosquito,
respec-tively. The presence of the indexion the biting rate and the probabil-ity of successful infection indicates the age-dependence of the force of infection. A more general age-dependent force of infection is extensively explored in[1]. Once infected, a portion
r
of the infected human enters the class of asymptomatically infectious individuals, while the remaining portion 1r
enters the class of symptomati-cally infectious individuals. The human recovery rate isc. We
as-sume that the mosquitoes never recover once they are infected, since they have a much shorter life time compared to the life time of humans. In fact, the life time of the mosquitoes is almost the same as the viruses have. Hence, the total number of mosquitoes,NvðtÞ, consists of the susceptible,SvðtÞ, and the infectious,IvðtÞ, individuals. Furthermore, there is an extrinsic incubation periods
eand intrinsicincubation period
s
i experienced by infected mosquitoes andin-fected humans, respectively, before they become infectious. We as-sume that the rate of recruitment from the child-class to the adult-class in the human population is
a
¼1=T, whereTis the age at which an individual in the child-class goes into the adult-class (see alsoAppendix A).
To control the disease, we assume here that vaccination is only given to individuals in the child-class, with the rateq. However, we also assume that, since most of the infectious children are asymp-tomatic, we cannot differentiate between these asymptomatic in-fected children and the healthy children as the target of vaccination. As a result, a portion
x
of the infectious children, who are vaccinated un-deliberately, will get worse by having a longer period of infection. Another possibility is that they develop symptoms and consequently move to the categoryD1. Here we willconsider the former case, while the latter will be discussed in a separate section. Assume that vaccine efficacy iss. Using these assumptions and notations, the dynamics of the human population is given by
dS1ðtÞ
dt ¼B
a
S1ðtÞl
S1ðtÞ b1p1Ivðts
iÞS1ðt
s
iÞN tð
s
iÞsqS1ðtÞ;
ð1aÞ
dS2ðtÞ
dt ¼
a
S1ðtÞl
S2ðtÞ b2p2Ivðts
iÞS2ðt
s
iÞN tð
s
iÞ; ð1bÞ
dI1ðtÞ
dt ¼
r
b1p1Ivðts
iÞS1ðt
s
iÞN tð
s
iÞl
I1ðtÞ ðc
qx
ÞI1ðtÞa
I1ðtÞ;ð1cÞ
dI2ðtÞ
dt ¼
r
b2p2Ivðts
iÞS2ðt
s
iÞN tð
s
iÞl
I2ðtÞc
I2ðtÞ þa
I1ðtÞ; ð1dÞdD1ðtÞ
dt ¼ ½1
r
b1p1Ivðts
iÞS1ðt
s
iÞN tð
s
iÞl
D1ðtÞc
dD1ðtÞa
D1ðtÞ;ð1eÞ
dD2ðtÞ
dt ¼ ½1
r
b2p2Ivðts
iÞ S2ðts
iÞN tð
s
iÞl
D2ðtÞc
dD2ðtÞ þa
D1ðtÞ;ð1fÞ
dRðtÞ
dt ¼sqS1ðtÞ þ ð
c
qx
ÞI1ðtÞ þc
I2ðtÞ þc
dD1ðtÞ þc
dD2ðtÞl
RðtÞ:ð1gÞ
Meanwhile, the mosquito population dynamics is governed by
dSvðtÞ
dt ¼Bv½b1pvI1ðtÞ þb2pvI2ðt
s
eÞSvðt
s
eÞN tð
s
eÞelvse
l
vSvðtÞ;
ð2aÞ
dIvðtÞ
dt ¼½b1pvI1ðt
s
eÞ þb2pvI2ðts
eÞSvðt
s
eÞN tð
s
eÞelvse
l
vIvðtÞ:
ð2bÞ
Note that the human and mosquito population densities at equilibrium are N¼B
l and NV¼lBvv, respectively. In Appendix A
we show the relationship between the two-age-classes model developed here and the more general age-structured model. In the next section we will discuss the basic reproduction number for dengue transmission in the two-age-classes model described by the system of Eqs.(1a)–(1g)and,(2a and 2b).
Rewriting the dynamics for the relative proportions using the new variables eS1¼SN1, eS2¼SN2, eI1¼IN1, eI2¼IN2, De1¼DN1, De2¼DN2,
e
R¼R
N, eSv¼NvSv,eIv¼NvIv, eB¼NB, and eBv¼NvBv, we find at equilibrium
e
B
a
eS1l
eS1b1p1QeIveS1sqeS1¼0; ð3aÞa
eS1l
eS2b2p2QeIveS2¼0; ð3bÞr
b1p1QeIveS1l
eI1 ðc
qx
ÞeI1a
eI1¼0; ð3cÞr
b2p2QeIveS2l
eI2c
eI2þa
eI1¼0; ð3dÞ½1
r
b1p1QeIveS1l
De1c
dDe1a
De1¼0; ð3eÞ½1
r
b2p2QeIveS2l
De2c
dDe2þa
De1¼0; ð3fÞ sqeS1þ ðc
qx
ÞeI1þc
eI2þc
dDe1þc
dDe2l
eR¼0; ð3gÞwithQ¼Nv
Nis a person index measuring the average mosquitoes per
person. Similar equilibrium equations for the mosquitoes dynamics are given by
e
Bv b1pveI1þb2pveI2
h i
eSvelvse
l
veSv¼0; ð4aÞb1pveI1þb2pveI2
h i
eSvelvse
l
veIv¼0: ð4bÞThe total population of humans and mosquitoes at equilibrium are normalized to one. In the following section we derive the basic reproduction number for transmission of the disease, which will be used extensively in the discussion throughout the remaining of the paper.
3.2. The basic reproduction number
The basic reproduction numberR0 is given by limn!1kKnk1=n.
Alternatively,R0is the dominant eigenvalue ofK. HereK¼ ðkijÞis
the next generation matrix, wherekijis the expected number of newly generated infected individuals with index i, caused by an infective individual from the population with indexj (see[10]). In our model,iandjare elements of the setf1;2;Vg. Hence, the next generation matrix for the system above is given by
K¼
0 0 rb1p1Q
lv
e
S 1
a
aþlþcqx 0
rb2p2Q lv eS
2
elvseb1pv
lþcqx eSv
elvseb2pv
lþc eSv 0
0 B B B @
1 C C C
A: ð5Þ
The basic reproduction numberRqfor the system is the largest eigenvalue of this matrix where eS
1¼aþlBþsq, eS2¼alaþlBþsq, and
eS
v¼ BV
lvare the steady state population sizes in the absence of
infec-tion. The characteristic polynomial forKis given by
FðkÞ ¼
l
2VBð
l
þc
a
Þða
þl
þc
qx
Þða
þl
þsqÞk3
pVBV
l
Mr
p1b 2 1l
2
þb22p2
al
l
b 21p1
a
þl
b 2 1p1c
þb22p2
ac
þb 2 2p2a
2b2 2p2
a
qx
kpVBV
l
2Ma
p1b2r
b1; ð6ÞwhereM¼elVse. The eigen value ofKmay not be found explicitly.
Note thatFþpVBV
l
2Ma
p1b2r
b1is antisymmetrical with respect tok¼0. The largest eigen valuek0occurs in the intervalð0;1Þ, hence
k0>1 if and only ifFð1Þ<0. Here we find a threshold parameter
Rq¼
ffiffiffiffiffiffiffiffiffiffiffiffiffiffiffiffiffiffiffiffiffiffiffiffiffiffiffiffiffiffiffiffiffiffiffiffiffiffiffiffiffiffiffiffiffiffiffiffiffiffiffiffiffiffiffiffiffiffiffiffiffiffiffiffiffiffiffiffiffiffiffiffiffiffiffiffiffiffiffiffiffiffiffiffiffiffiffiffiffiffiffiffiffiffiffiffiffiffiffiffiffiffiffiffiffiffiffiffiffiffiffiffiffiffiffiffiffiffiffiffiffiffiffiffiffiffiffiffiffiffiffiffiffiffiffiffiffiffiffiffiffiffiffiffiffiffi
r
pVelVseQð
a
þl
þsqÞl
Vl
b21p1ð
a
þc
þl
qx
Þþa
b22p2ð
c
þl
Þþal
b1b2p1ð
a
þc
þl
qx
Þðc
þl
Þ ! vu u
t :
ð7Þ
This threshold is different from the reproduction number eRq, but both give the equivalent conditionRq>1()Rqe >1. For the remaining of the paper we will use the threshold number Rq as
the basis of the analysis. Note that the notation Rq denotes the effective threshold number and R0 is reserved to the threshold
number in the absence of vaccination. The conditionRq¼1 is re-lated to the bifurcation parameter for the non-endemic equilib-rium at which it becomes unstable whenRq>1 and the endemic equilibrium appears.
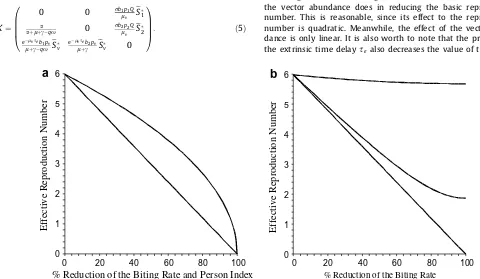
Note that the effect of biting rate is quadratic implying that reducing the biting rate, for example by using insect repellent, is among the most effective way in decreasing the reproduction number. Numerical examples inFig. 1show that the reduction of the biting rate has a more significant effect than the reduction of the vector abundance does in reducing the basic reproduction number. This is reasonable, since its effect to the reproduction number is quadratic. Meanwhile, the effect of the vector abun-dance is only linear. It is also worth to note that the presence of the extrinsic time delay
s
e also decreases the value of therepro-60
40
20
0
6
5
4
3
2
% Reduction of the Biting Rate and Person Index
1
0
100
80
0
20
40
60
6
5
4
3
2
% Reduction of the Biting Rate
1
0
100
80
a
b
Effective Reproduction Number
Effective Reproduction Number
Fig. 1.(a) The effective reproduction numberRqas the biting rate reduces (lower curve) and the person indexQ, i.e. the ratio of the mosquito and human densities, reduces
(upper curve) to certain percentages. The parameter values used in this figure areQ¼2,x¼0:1,l¼1=65=365,lv¼1=14,c¼1=14,r¼0:5,s¼0:5,p1¼0:2,p2¼0:1,
pV¼0:5,b1¼1,b2¼2,se¼0, anda¼1=14=365. The figure shows that the reduction of the biting rate is more significant than the reduction of the person index in reducing
the basic reproduction number. This is because the effect of the biting rate is quadratic, while the effect of the person index is linear. (b) The effective reproduction numberRq
duction number. This is one of the arguments why some scientists try to reduce the life span of adult mosquitoes, genetically or by some other means, in the attempt to control dengue.
Another way to eliminate dengue is by means of vaccination. The dengue vaccine is being developed, it is not readily available yet for practical uses. We have already remarked various negative effects of vaccination, such as the prolongation of infectious period. Most of the infectious children are asymptomatic and hence we cannot dif-ferentiate between the asymptomatic infectious children and the healthy children as the target of vaccination. As a result, there will be a portion of the infectious children, that is vaccinated uninten-tionally. Considering the effective reproduction number above, if we are sure that all vaccination are correctly given to the susceptible children, then the effective reproduction number is lower than the basic reproduction number. Otherwise, if every vaccination is unin-tentionally given to the asymptomatic infectious children, the oppo-site will happen. In between, there is a trade off regarding the effect of vaccination coverageqto the basic reproduction numberR0. The
following section discusses this issue in greater detail.
3.3. The effectiveness and ineffectiveness of vaccination
To compare the effectiveness of the vaccination, in terms of reducing the basic reproduction number we do as follows: first, let us assume
a
¼0, which is the case of a single age class, and letPdenotes the ratio of the effective reproduction number after vaccination,Rq, and the basic reproduction number before vaccina-tion,R0. Then we have the identityP¼
ffiffiffiffiffiffiffiffiffiffiffiffiffiffiffiffiffiffiffiffiffiffiffiffiffiffiffiffiffiffiffiffiffiffiffiffiffiffiffiffiffiffiffiffiffiffi
l
ðc
þl
Þ ðl
þsqÞðc
þl
qx
Þ s: ð8Þ
Obviously, if s¼1 and
x
¼0, then P<1, while ifs¼0 andx
¼1, thenP>1. We also notice that if there is no vaccination,q¼0, then there is no effect, indicated byP¼1. In general, observe thatPwill be less than one, that is the reproduction number in the presence of vaccination is smaller than the reproduction number in the absence vaccination, if and only if
x
<sðc
þl
Þ sqþl
¼x
: ð9Þ
In this case,
x
is called the threshold for the ineffectivevacci-nation to occur. If
x
>x
then, instead of having a lowerreproduc-tion number, vaccinareproduc-tion results in a higher reproducreproduc-tion number. Note that the value of
x
depends on the vaccination coveragecon-stantq. We conclude that the vaccination is effective, in terms of decreasing the basic reproduction number, if and only if the wors-ening effect
x
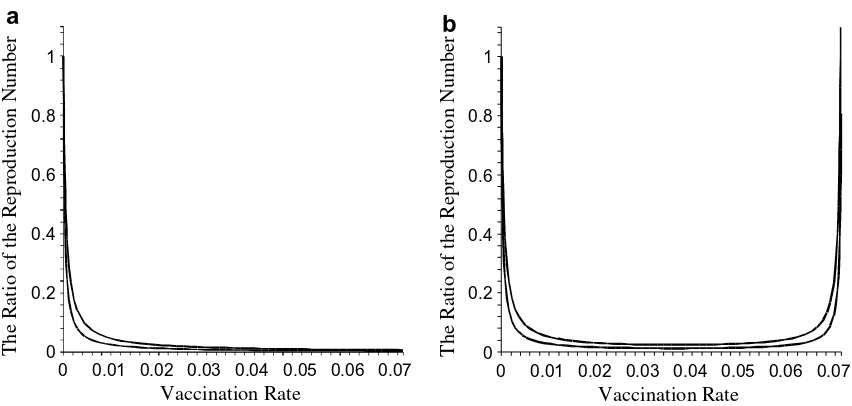
is small enough compared to the vaccine efficacysso that inequality(9)holds. As an illustration,Fig. 2shows the ratio of the effective and the basic reproduction numbers, as a function of the vaccination coverageq, with a small value of worsening ef-fect (Fig. 2(a)) and with a large value of the worsening effect (Fig. 2(b)).
Note that the inequality can be rewritten assq<sðcþlxÞlx. In an extreme situation, whens<ðcþllÞ
x, vaccination can never reduce
the basic reproduction number. In other words, no matter how big the effort taken for vaccination is, in terms of the portion of children being vaccinated, the basic reproduction number will in-crease. This can be viewed as another form of the ineffectiveness of the vaccination. The occurrence is independent of the vaccina-tion coverageq. The last expression can be rewritten as sx< l
ðcþlÞ,
which shows the ratio of vaccine efficacy and the worsening effect must be less than the ratio of the effective infectious period 1=ð
c
þl
Þand the life expectancy 1=l.Next, we look into a more general case,
a
–0. Here we haveP¼
ffiffiffiffiffiffiffiffiffiffiffiffiffiffiffiffiffiffiffiffiffiffiffiffiffiffiffiffiffiffiffiffiffiffiffiffiffiffiffiffiffiffiffiffiffiffiffiffiffiffiffiffiffiffiffiffiffiffiffiffiffiffiffiffiffiffiffiffiffiffiffiffiffiffiffiffiffiffiffiffiffiffiffiffiffiffiffiffiffiffiffiffiffiffiffiffiffiffiffiffiffiffiffiffiffiffiffiffiffiffiffiffiffiffiffiffiffiffiffiffiffiffiffiffiffiffiffiffiffiffiffiffiffiffiffiffiffiffiffiffiffiffiffiffiffiffiffiffiffiffiffiffiffiffiffiffiffiffiffiffiffiffiffiffiffiffiffiffiffiffiffiffiffiffiffi ðaþlÞðaþcþlÞ
ðaþlþsqÞðaþcþlqxÞ 1
ap2b 2 2qx p1b21lþp2b
2 2a
ðcþlÞ þab1b2p1lþb22p2a
0 @
1 A v
u u u
t ;
ð10Þ
which clearly reduces to Eq.(8)when
a
¼0. Using a similar argument as above, there would be a thresholdx
adividing the case where the vaccination helps or worsens. Vaccination is effective if only if
x
<s c3
a
3þc2a
2þc1a
þb21p1l
ðl
þc
Þ 2
d2
a
2þd1a
þb 21p1
l
ðl
þc
Þðl
þqsÞ¼
x
a; ð11Þ
where c3¼b22p2, c2¼b2ð2b2p2
c
þ2b2l
p2þb1p1l
Þ, c1¼ ðl
þc
Þðb22p2
c
þb 21p1
l
þb2l
p1b1þl
b22p2Þ, d2¼b2ðqsp2b2þb1p1l
Þ andd1¼ ðqsb22p2
c
þp1b2
1
l
2þqsl
b 22p2þqsb2
l
p1b1þl
b12p1c
þb2l
2p1b1Þ.Again, when
a
¼0, identity(11)reduces tox
in(9)and it can alsoVaccination Rate
0.07
0.06
0.05
0.04
0.03
1
0.02
0.8
0.6
0.01
0.4
0.2
0
0
Vaccination Rate
0.07
0.06
0.05
0.04
0.03
1
0.02
0.8
0.6
0.01
0.4
0.2
0
0
a
b
The Ratio of the Reproduction Number
The Ratio of the Reproduction Number
be written as
x
< sðaþcþlÞXsqXþðaþlÞY; where X¼b
2
2p2
ac
þb2al
p1b1þp1b
2 1
l
2þb2
2p2
a
2þl
b 2 2p2a
þl
b2
1p1
c
andY¼b1p1l
ðb1c
þb1l
þb2a
Þ.As in the previous case, no vaccination coverage succeeds in
reduc-ing the basic reproduction number ifsðYþb2p2laÞ
xY <
ðaþlÞ
ðaþcþlÞ, or if the
ra-tio between vaccine efficacy and the worsening effect is too small.
Fig. 2 shows the value ofPas a function of vaccination coverage
q. It reveals that for a small worsening effect
x,
Pis always less than one (Fig. 2(a)). However, when the worsening effectx
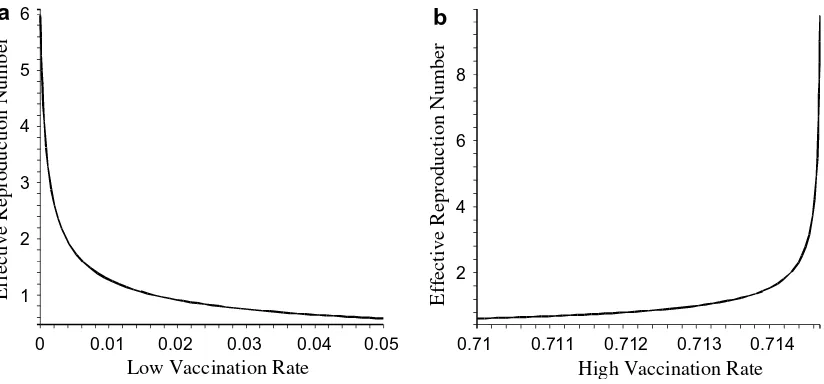
is sufficiently high (Fig. 2(b)),P>1 for sufficiently large vaccination coverageq. The effective reproduction numbers for both cases are illustrated in Fig. 3. It is worth to note, although theoretically vaccination ineffectiveness may occur, practically for most of the realistic parameters of the model, thex-region for this ineffectiveness
to occur is very small, as indicated by the numerical example in Fig. 4.3.4. The critical level of vaccination
The next important question is to what extent the vaccination effort is needed to eliminate the disease. Here we will assume that
x
<x
a, so that vaccination is effective. Note that in Eq. (7), the second term in the right hand side is the adult contribution to the basic reproduction number. In what follows we will assume that
ffiffiffiffiffiffiffiffiffiffiffiffiffiffiffiffiffiffiffiffiffiffiffiffiffiffiffiffiffiffiffiffiffiffiffiffiffiffiffiffiffiffiffiffiffiffi
r
pVelVseQð
a
þl
Þl
Va
b22p2c
þl
! v
u u
t <1; ð12Þ
that is, the presence of adults alone cannot sustain the presence of the disease. So it is plausible that vaccination is addressed to the child-class. To eliminate the disease we require that a condition that R2
q in Eq. (7)to be less than one. It is easy to show that if
x
¼0, the condition is equivalent toq> R2
01
ð
a
þl
Þs : ð13Þ
However, if
x
–0 then the condition is more complicated and takes form as q>ðR201Þ
ðaþlþcÞðlþcÞ ðaAb2
2p2ðcþlÞÞx, where A¼ rpVelVseQ
ðaþlþsqÞlV. The
last inequality is a general rule for vaccinating the child-class such that the effective reproduction number is less than one, when there
is a worsening effect of vaccination. Note that in a special case, when
a
¼0 and there is no worsening effect of vaccination, from inequality(13)we havesql>R 2
01. This can be regarded as
vacci-nating the whole population without distinction between adults and children with vaccination coverageq. In this case the known rule of thumb for vaccination is recovered, except for the presence of the square[9].
4. Child-class vaccination with worsening effect on the disease virulence
In the previous section we have assumed that as a result of un-deliberate vaccination of infected children, a portion
x
of them will be infectious during a longer period of time. Another possibil-ity is that they develop severe symptoms due to increasedviru-0.03
0.02
0.01
0
6
5
4
Low Vaccination Rate
3
2
0.05
1
0.04
0.714
8
6
0.713
4
2
0.712
0.711
0.71
High Vaccination Rate
a
b
Effective Reproduction Number
Effective Reproduction Number
Fig. 3.(a) The effective reproduction numberRqwhen the vaccination rate is low and reveals that low vaccination rates generate effective reproduction numbers that are
lower than the basic reproduction number before vaccination. (b) The effective reproduction numberRqwhen the vaccination rate is very high which may yield a higher
effective reproduction number compared to the basic reproduction numberR0. The parameter values used are the same as inFig. 1.
Relative Worsening Effect
0.07
0.06
0.05
0.04
0.03
0.025
0.02
0.02
0.015
0.01
0.01
0.005
0
Relative Vaccine Efficacy
lence, and that they move to the category ofD1as a consequence.
Basically the equations are the same except the termq
x
I1ðtÞin Eq. (1c)has the opposite sign to express an outflow into the classD1.Doing so will give the effective reproduction number
Rq¼
ffiffiffiffiffiffiffiffiffiffiffiffiffiffiffiffiffiffiffiffiffiffiffiffiffiffiffiffiffiffiffiffiffiffiffiffiffiffiffiffiffiffiffiffiffiffiffiffiffiffiffiffiffiffiffiffiffiffiffiffiffiffiffiffiffiffiffiffiffiffiffiffiffiffiffiffiffiffiffiffiffiffiffiffiffiffiffiffiffiffiffiffiffiffiffiffiffiffi
r
pvelVseQð
a
þl
þsqÞl
Vl
b21p1ð
c
þl
þa
þqx
Þþa
b22p2ð
c
þl
Þ ! vu u
t : ð14Þ
Unlike in the previous model, here the vaccination is always effective since
Rq
R0
¼
ffiffiffiffiffiffiffiffiffiffiffiffiffiffiffiffiffiffiffiffiffiffiffiffiffiffiffiffiffiffiffiffiffiffiffiffiffiffiffiffiffiffiffiffiffiffiffiffiffiffiffiffiffiffiffiffiffiffiffiffiffiffiffiffiffiffiffiffiffiffiffiffiffiffiffiffiffiffiffiffiffiffiffiffiffiffiffiffiffiffiffiffiffiffiffiffiffiffiffiffiffiffiffiffiffiffiffiffiffiffiffiffiffiffiffiffiffiffiffiffiffiffiffiffiffiffiffiffiffiffiffiffiffiffiffiffiffiffiffiffi ð
a
þl
Þð
a
þl
þsqÞð
c
þl
þa
Þ ðc
þl
þa
þqx
Þb21p1
l
ðc
þl
Þ þb2
2p2
a
ðc
þl
þa
þqx
Þb21p1
l
ðc
þl
Þ þb2
2p2
a
ðc
þl
þa
Þv u u
t ;
ð15Þ
which is obviously always less than 1. In this case the critical level of vaccination is similar to inequality(13)with the opposite sign of
q
x
terms.In the previous model (Section3) we have assumed a scenario in which a health manager does not realize the presence of the infectious classesIj. We call this as an ignorant scenario of a vacci-nation program. In this case the vaccivacci-nation effort is set at a level of coverageqand enforced to the ‘assumed’ susceptible part of the population, which isS1þI1instead ofS1. This may result in
wast-ing vaccination effort besides, in some circumstances, creates an ineffective vaccination if the model in Section3is believed to be true. Although in terms of reducing the basic reproduction number, the model in Section4predicts that vaccination is always effective, ethically, we should avoid the chance of vaccinating asymptomatic infected individuals that may lead to more severe symptom for them.
We can consider another scenario, where the manager realizes the presence of the asymptomatic infectious classesIj, but still can-not identify to which class an individual belongs. In this case, a portionp of vaccination is given after screening to ensure that the vaccine is given to individuals of the true susceptible child-class. The remaining portion is given randomly to presumably sus-ceptible individuals with successful probability of finding the truly susceptible isr. In this scenario, the effective reproduction number in Eq.(7)changes. As a result the measure of vaccination effective-ness also changes. For example, if
a
¼0, it is given byP¼
ffiffiffiffiffiffiffiffiffiffiffiffiffiffiffiffiffiffiffiffiffiffiffiffiffiffiffiffiffiffiffiffiffiffiffiffiffiffiffiffiffiffiffiffiffiffiffiffiffiffiffiffiffiffiffiffiffiffiffiffiffiffiffiffiffiffiffiffiffiffiffiffiffiffiffiffiffiffiffiffiffiffiffiffiffiffiffiffiffiffiffiffiffiffiffiffiffiffiffiffiffiffiffiffi
l
ðc
þl
Þð
l
þ ðpþ ð1pÞrÞsqÞðc
þl
ð1pÞð1rÞqx
Þ s: ð16Þ
Clearly ifptends to one, thenPis always less than one. Further-more, the condition for avoiding the ineffectiveness of the vaccina-tion in inequality(9)also changes into
x
<ðl
þc
Þs pþrð1pÞð1pÞð1rÞðsqðrð1pÞ þpÞ þ
l
Þ; ð17Þwhich always holds ifpis sufficiently close to one. These suggest that screening is necessary to gain an effective vaccination program. Furthermore, screening can also save the unnecessary effort of vac-cinating infectious children.
5. Concluding remarks
We have discussed a two-age-classes dengue transmission model and assumed that a negative effect of vaccination might oc-cur. If there is an undeliberate vaccination of asymptomatic infec-tious children that effectively enlarges the infecinfec-tious period, then a paradox of vaccination might occur. The paradox, stating that vac-cination makes the basic reproduction number bigger, might occur if the worsening effect is greater than a certain threshold. The threshold is a function of the human demographic and
epidemio-logical parameters, which might be independent of the level of vac-cination. Although the region of the realistic parameters in which the vaccination might happen is regarded as a small region, still this paradox must be avoided. It can be avoided, for example, by screening the target population before vaccination. However, if the worsening effect increases virulence so that one will develop symptoms, then the vaccination always helps in reducing the basic reproduction number. Further work can be done by explicitly mod-eling the mechanism of the second and third infections via the introduction of multiple strains of viruses. Severe infection can be modeled as a result of certain combinations of consecutive infections by different strains of viruses[39]. Improvement of the model can also be accomplished by considering a different age dis-tribution in the child-class.
Acknowledgments
This paper was written while the first and the second authors were visiting the Department of Applied Mathematics, University of Twente. We thank Prof. Heesterbeek of the University of Utrecht for fruitful discussion in shaping material in this paper. We are also indebted to two anonymous referees for their constructive sugges-tions to improve the earlier version of the manuscript. Financial support was provided by the Royal Netherlands Academy of Arts and Sciences (KNAW).
Appendix A
Without loss of generality, let us concentrate on the susceptible child-class. The analogous partial differential equation for Eq.(1a)
is given by:
@s1ðt;aÞ
dt þ
@s1ðt;aÞ
da ¼
l
s1ðt;aÞ b1p1IvðtÞs1ðt;aÞ
N qs1ðt;aÞ;
ðA:1Þ
with
s1ðt;0Þ ¼B: ðA:2Þ
Suppose thatTis the final age of the child-class, and let us as-sume thats1ðt;TÞ ¼s2ðt;TÞor in the other words the starting age
of the adult-class is the final age of the child-class. Let
S1ðtÞ ¼
Z T
0
s1ðt;aÞda: ðA:3Þ
The integration of Eq.(A.1) with the respect to age along the interval½0;Tgives
dS1ðtÞ
dt ¼Bs1ðt;TÞ
l
S1ðtÞ b1p1IvðtÞ S1ðtÞN qS1ðtÞ: ðA:4Þ Hence Eq. (1a) is obtained if we have the relation
s1ðt;TÞ ¼
a
S1ðtÞ. This relation can be obtained for a certain choiceof
a. Note that from
A.3, and using the Mean Value Theorem, thereexistsT
2 ð0;TÞsuch that
S1ðtÞ ¼
Z T
0
s1ðt;aÞda¼Ts1ðt;TÞ: ðA:5Þ
Moreover, by the Taylor expansion for a fixedtyields
s1ðt;TÞ ¼s1ðt;TÞ þs01ðt;TÞT
T
ð Þ þ12T2s00 1ðt;T1Þ
T T 1
2
;
ðA:6Þ
for someT<T
1<T. We consider a type of population distribution
sðt;aÞin which for anyt>0,dsðt;TÞ
da ¼0 andj
d2sðt;TÞ
(see [3]) where the population distribution is slowly increasing from the new born age to the transition ageTreaching its maximum atT, and relatively flat aroundT. Hence, if we chooseTsuch that
s0
1ðt;TÞ ¼0 and assuming that js001ðt;T1Þj T22, then from(A.6) we have s1ðt;TÞ s1ðt;TÞ. Consequently, by choosing
a
¼1T there-quired relation is obtained.
References
[1] M. Amaku, F.A. Coutinho, R.S. Azevedo, M.N. Burattini, L.F. Lopez, E. Massad, Vaccination against rubella: analysis of the temporal evolution of the age-dependent force of infection and the effects of different contact patterns, Phys. Rev. E 67 (5) (2003). article No. 051907.
[2] N. Bacaer, S. Guernaoui, The epidemic threshold of vector-borne diseases with seasonality, J. Math. Biol. (2006), doi:10.1007/s00285-006-0015-0.
[3] Biro Pusat Statistik Republik Indonesia. Available at: <http://www.bps.go.id>. [4] N.T.J. Bailey, The Mathematical Theory of Infectious Disease, Griffin, London, 1975. [5] W.J. Chen, S.L. Chen, L.J. Chien, C.C. Chen, C.C. King, M.R. Harn, K.P. Hwang, J.H. Fang, Silent transmission of the dengue virus in southern Taiwan, Am. J. Trop. Med. Hyg. 55 (1996) 12.
[6] T. Clarke, Breakbone fever, Nature 416 (2002) 672.
[7] A.L. Corwin, R.P. Larasati, M.J. Bangs, S. Wuryadi, S. Arjoso, N. Sukri, E. Listyaningsih, S. Hartati, R. Namursa, Z. Anwar, S. Chandra, B. Loho, H. Ahmad, J.R. Campbell, K.R. Porter, Epidemic dengue transmission in southern Sumatra, Indonesia, Trans. R. Soc. Trop. Med. Hyg. 95 (2001) 257.
[8] N. Degallier, C. Favier, J.P. Boulanger, C.E. Menkes, C. Oliviera, Une nouvelle methode d’estimation du taux de reproduction des maladies (R0): application a l’etude des epidemies de dengue dans le district federal (Bresil), Env. Risq. Sante 4 (2005) 1.
[9] M. Derouich, A. Boutayeb, E.H. Twizel, A model of dengue fever, BioMed. Eng. Online 2 (2003) 4, doi:10.1186/1475-925X-2-4.
[10] O. Diekmann, J.A. P Heesterbeek, Mathematical Epidemiology of Infectious Diseases, John Wiley and Sons, New York, 2000.
[11] K. Dietz, Transmission and control of arbovirus diseases, in: D. Ludwig et al. (Eds.), Epidemiology, Proceedings of the Society for Industrial and Applied Mathematics, Philadelphia, PA, 1974, 104 pp.
[12] L. Esteva, C. Vargas, Analysis of a dengue disease transmission model, Math. Biosci. 150 (1998) 131.
[13] L. Esteva, C. Vargas, A model for dengue disease with variable human population, J. Math. Biol. 38 (1999) 220.
[14] L. Esteva, C. Vargas, Influence of vertical and mechanical transmission on the dynamics of dengue disease, Math. Biosci. 167 (2000) 51.
[15] L. Esteva, C. Vargas, Coexistence of different serotypes of dengue virus transmission model, J. Math. Biol. 46 (2003) 31.
[16] C. Favier, N. Degallier, M.G. Rosa-Freitas, J.P. Boulanger, J.R. Costa-Lima, J.F. Luitgards-Moura, C.E. Menkes, B. Mondet, C. Oliveira, E.T.S. Weimann, P. Tsouris, Early determination of the reproductive number for vector-borne disease: the case of dengue in Brazil, Trop. Med. Int. Health 11 (2006) 343. [17] Z. Feng, J.X. Velasco-Hernandez, Competitive exclusion in a vector–host model
for the dengue fever, J. Math. Biol. 35 (1997) 523.
[18] N.M. Ferguson, C.A. Donnelly, R.M. Andersen, Transmission dynamics and epidemiology of dengue: insights from age-stratified sero-prevalence survey, Philos. Trans. Roy. Soc. Lond. B 354 (1999) 757.
[19] N.M. Ferguson, R.M. Andersen, S. Gupta, The effect of antibody-dependent enhancement on the transmission dynamic and persistence of multiple-strain pathogens, Proc. Natl. Acad. Sci. USA 96 (1999) 790.
[20] D.J. Gubler, Dengue and dengue haemorrhagic fever, Clin. Microbiol. Rev. 11 (1998) 480.
[21] D.J. Gubler, Epidemic dengue/dengue hemorrhagic fever as a public health, social and economic problem in the 21st century, Trends Microbiol. 10 (2002) 100.
[22] D.J. Gubler, W. Suharyono, I. Lubis, S. Eram, S. Gunarso, Epidemic dengue 3 in central java associated with low viremia in man, Am. J. Trop. Med. Hyg. 30 (1981) 1094.
[23] M.G. Guzman, G. Kouri, Dengue: an update, Lancet Infect. Dis. 2 (2001) 33. [24] J.A.P. Heesterbeek, M.G. Roberts, The type-reproduction number T in models
for infectious disease control, Math. Biosc. 206 (2007) 3.
[25] M. Iannelli, M. Martcheva, X.Z. Li, Strain replacement in an epidemic model with super-infection and perfect vaccination, Math. Biosci. 195 (2005) 23. [26] W.O. Kermack, A.G. McKendrick, Contribution to the mathematical theory of
epidemics I, Proc. Roy. Soc. Med. 115A (1927) 700 (reprinted in Bull. Math. Biol. 53 (1991) 33–55).
[27] R.M. Kinney, C.Y. Huang, Development of new vaccines against dengue fever and Japanese encephalitis, Intervirology 44 (2001) 176.
[28] C.C. Lord, M.E.J. Woolhouse, J.A.P. Heesterbeek, P.S. Mellor, Vector-borne disease and the reproduction number: a case study of african horse sickness, Med. Vet. Entomol. 10 (1996) 19.
[29] C.A. Marques, O.P. Forattini, E. Massad, The basic reproduction number for dengue fever in Sao Paulo state, Brazil: 1990–1991 epidemic, Trans. Roy. Soc. Trop. Med. Hyg. 88 (1994) 58.
[30] E. Massad, F.A.B. Coutinho, M.N. Burattini, L.F. Lopez, The risk of yellow fever in a dengue-infested area, Trans. Roy. Soc. Trop. Med. Hyg. 95 (2001) 370.
[31] E. Massad, M.N. Burattini, F.A.B. Coutinho, L.F. Lopez. Dengue and the Risk of Urban Yellow Fever Reintroduction in São Paulo State, Brazil, Rev. Saúde Pública 37 (2003), No.4.
[32] A. Meryantie, The Analysis of Mean Age at Infection of Dengue Fever Epidemic in Bandung 2004 using Weibull Model, S1-Thesis Universitas Padjadjaran, 2005, unpublished.
[33] E.A. Newton, P. Reiter, A model of the transmission of dengue fever with an evaluation of the impact of ultra-low volume (ULV) insecticide applications on dengue epidemic, Am. J. Trop. Med. Hyg. 47 (1992) 709.
[34] E.E. Ooi, K.T. Goh, D.J. Gubler, Dengue prevention and 35 years of vector control in Singapore, Emerg. Infect. Dis. 12 (2006) 887.
[35] J. Patumamond, C. Tawichasri, S. Nopparat, Dengue hemorrhagic fever in Uttaradict, Thailand, Emerg. Infect. Dis. 9 (2003) 1348.
[36] O. Pelaez, M.G. Guzman, G. Kouri, et al., Dengue 3 epidemic, Havana, 2001, Emerg. Infect. Dis. 10 (2004) 719.
[37] P. Pongsumpun, I.M. Tang, Model for the realistic age-structured transmission of dengue hemorrhagic fever in Thailand, East-West J. Math. special volume (2002) 297.
[38] P. Pongsumpun, I.M. Tang, Transmission of dengue hemorrhagic fever in an age structured population, Math. Comput. Model. 37 (2003) 949.
[39] K.R. Porter, C.G. Beckett, H. Kosasih, et al., Epidemiology of dengue and dengue hemorrhagic fever in a cohort of adults living in Bandung, West Java, Indonesia, Am. J. Trop. Med. Hyg. 71 (2005) 60.
[40] M.G. Roberts, J.A.P. Heesterbeek, A new method for estimating the effort required to control an infectious disease, Proc. Roy. Soc. Lond. B 270 (2003) 1359.
[41] R. Ross, The Prevention of Malaria, second ed., John Murray, London, 1911. [42] D.S. Sephard, J.A. Suaya, S.B. Halstead, M.B. Nathan, D.J. Gubler, R.T. Mahoney,
D.N.C. Wang, M.I. Meltzer, Cost-effectiveness of a pediatric dengue vaccine, Vaccine 22 (2004) 1275.
[43] E. Soewono, Transmission model of dengue fever disease with periodic recruitment rate, J. Ind. Math. Soc. 7 (2001) 85.
[44] E. Soewono, A.K. Supriatna, Paradox of vaccination predicted by a simple dengue disease model, in: M.C. Joshi et al. (Eds.), Industrial Mathematics, Narosa, New Delhi, 2006, p. 459.
[45] M. Sriprom, P. Pongsumpun, S. Yoksan, P. Barbazan, J.P. Gonzales, I.M. Tang, Dengue haemorrhagic in Thailand, 1998–2003: primary or secondary infection, Dengue Bull. 27 (2003) 39.