‘/’/
THE EFFECT OF NOISE ON WORK FATIGUE IN AN OIL AND GAS INDUSTRY
Okto Hebrani
*, Sandra Madonna, Prismita Nursetyowati
Department Environmental Engineering, Faculty of Engineering and Computer Science, Bakrie University, Jakarta, 12960, Indonesia
*Corresponding author: [email protected]
ABSTRACT
Industrial Noise is one of industrial pollution and considered as important environmental problem. Noise is one of the causes of fatigue in the oil and gas industry. The study of Effect of Noise on Work Fatigue in Oil and Gas Industry was done. Aims: The purpose of this study is to determine the effect of noise on work fatigue at Central Processing Plant (CPP) Gundih, Cepu, Central Java. Methodology and results: The measurement industrial noise was measured using a Sound Level Meter at 45 sampling points spread across two gas processing zones is Utility zone and Main Process zone. The noise distribution pattern based on noise level in gas processing field is made using Surfer 11 software. Measurement of fatigue using the Fatigue Measurement Questionnaire and Subjective Self Rating Test questionnaire from Industrial Fatigue Research Committee Japan. The results of this study prove that the Utility Zone at the sampling point 35 to 45 has a noise level of 74,229 dBa - 106,285 dBa, point 45 has passed the Noise Decree of Kepmenaker No. 51 of 1999, but overall the sampling point in the Utility zone has passed through KepmenLH no. 48 in 1996. In the Main Process zone at sampling points 6 to 17 and 30 have passed the standard noise level Kepmenaker no. 51 of 1999 with a noise level of 85.967 dBa to 87.155 dBa and 85.146 dBa. Conclusion, significance and impact study: Overall there are 4 sampling points that do not pass the standard noise level of KepmenLH no. 48 of 1996 and Kepmenaker no. 51, 1999 points 25, 26, 31 and 33. Noise affects fatigue based on several factors, including noise factor 39%, 32.1% weakening activity factor and physical fatigue factor 28.2%.
1.
INTRODUCTION
Rapid development of industrial technology has impact on potential hazards and occupational
diseases. Occupational diseases can caused decreased productivity,one of the causes is due to
boredom in work and fatigue in doing work activities(Suma'mur, 1996)
Technically defined, noise is any unwanted sound. It is a form of vibration which may be
conducted through solids, liquid, or gases (Olishiski, 1976). Noise is one of the physical factors
that can affect the level of worker fatigue. Sound is something that can not be avoided in the
workplace and other activities. The intensity of noise can often lead to a decrease in work
productivity, as one cause of stress and other health disorders. Stress caused by exposure to
noise can lead to fatigue, anxiety and depression. Stress due to noise also cause irritability,
headaches and sleep disorders (Tarwaka, 2004).
Oil and Gas Industry has the potential to cause noise for workers such as Central Processing
Plant (CPP) Gundih, which is a National Oil and Gas company whose operations are at high risk
of Occupational Safety and Health, especially noise that causes the accidents factor is getting
bigger. The purpose of this study is to determine the effect of noise on work fatigue at Central
Processing Plant (CPP) Gundih. The study is conducted with the measurement method referring
to SNI 7239: 2009 and used the Work Fatigue Measurement Work Questionnaire and the
Subjective Self Rating Test questionnaire from Industrial Fatigue Research Committee Japan.
2.
RESEARCH METHODOLOGY
The measurement industrial noise was measured using a Sound Level Meter at 45 sampling
points spread across two gas processing zones is Utility zone and Main Process zone. . The noise
distribution pattern based on noise level in gas processing field made using Surfer 11 software.
Measurement of fatigue is using the Fatigue Measurement Questionnaire and Subjective
Self Rating Test questionnaire from Industrial Fatigue Research Committee Japan. Employee
surveys were distributed to utility and main process industrial zone. The questionnaire for the
survey comprised of 38 question contained questions about gender, age, education level,
knowledge of noise exposure, knowledge of hearing protection, knowledge of protection them
self, physiological and psychological effects, maximum daily and year exposure duration.
Physiological and psychological equations are about annoyance, headache, dizziness, disturbs
often, sometime, seldom and never. Likert scale is used to measure perception of worker
fatigue experienced by workers due to noise pollution. The level of fatigue value is 1, 2, 3, 4, 5
that value 1 answered strongly agree and 5 strongly disagree.
Noise level measurements are performed during day and night:
A. Day measurements:
▪ L1 taken at 07.00 hours representing the hours of 06.00 - 09.00.
▪ L2 taken at 10.00 hours representing the hours of 09.00 - 11.00.
▪ L3 taken at 15.00 hours representing the hours of 11.00 - 17.00.
▪ L4 taken at 20.00 hours representing the hours of 17:00 to 22:00.
B. Night measurements:
▪ L5 taken at 23.00 hours representing the hours of 22:00 to 24:00.
▪ L6 taken at 01.00 hours representing the hours of 24.00 - 03.00.
▪ L7 taken at 04.00 hours representing the hours of 03.00 - 06.00.
During one measurement for 10 minutes obtained 120 data which then performed data
calculations to obtain the noise value of the measurement results with the following formula:
𝐿𝑒𝑞(1 𝑀𝑖𝑛𝑢𝑡𝑒) = 10𝐿𝑜𝑔601 [(100,1 𝐿1+ 100,1 𝐿2+. … + 100,1 𝐿12)5] 𝑑𝐵𝑎 (1)
Calculation using above formula is obtained Leq 1 to 10 minutes, then followed by the
formula Leq 10 minutes as follows:
𝐿𝑒𝑞(10 𝑀𝑖𝑛𝑢𝑡𝑒) = 10𝐿𝑜𝑔101 [(100,1 𝐿𝐼+ 100,1 𝐿𝐼𝐼+. … + 100,1 𝐿𝑋)1] 𝑑𝐵𝑎 (2)
After a 10 minute Leq score is obtained, it is entered in the table according to the time
specified in KEPMENLH No. 48 / MenLH / 11/1996, L1 - L4 enter on LS (Day) and L5 - L7 enter at
LM (Night) which then calculated with the following formula:
(𝑁𝑖𝑔ℎ𝑡) 𝐿𝑀= 10𝐿𝑜𝑔𝑔1[(𝑇𝑒100,1 𝐿𝑒+ 𝑇𝑒100,1 𝐿𝑒+ 𝑇𝑔100,1 𝐿𝑔)] 𝑑𝐵𝑎 (4)
Having obtained the value of day noise and night noise at all points of measurement, the
value of day and night noise is treated with the formula of nighttime noise calculation (Lsm) as
follows:
(𝑁𝑜𝑜𝑛 − 𝑁𝑖𝑔ℎ𝑡) 𝐿𝑆𝑀 = 10𝐿𝑜𝑔241 [(16 × 100,1 𝐿𝑆+ 8 × 100,1 (𝐿𝑀+5))] 𝑑𝐵𝑎 (5)
Annotation:
Leq
=
Noise equivalent dB (A).L1 . . . L12
=
Noise every 5 seconds for 60 seconds dB (A).LI . . . LX
=
Noise every 1 minute for 10 minutes dB (A).La . . . Ld
=
Leq (10 minutes) every lapse of time in the morning dB (A).LS
=
Leq at noon dB (A).Ta . . . Td
=
Time measurement range during the day (hours)LM
=
Leq at night dB (A).Te . . . Tg
=
Night time measurements (hours)Le . . . Lg
=
Leq (10 minutes) at any time intervals at night dB (A).LSM
=
Leq on the measurement of 24 hours dB (A).The distribution of questionnaires was conducted to 87 workers of Central Pocessing Plant
(CPP) Gundih as respondent to know the level of work fatigue. Determination of the number of
samples based on the number of workers Central Pocessing Plant (CPP) Gundih which amounts
to 100 people. In determining the number of samples in the study used equations formulated
by Slovin when it is known the total number of workers:
𝑛 =
𝑁(𝑑)𝑁2+1 (6)Annotation:
n = Number of samples
N = Population
Once calculated with the Slovin formula then out the results of 80 people who must be
given a questionnaire.
Research conducted at Central Processing Plant (CPP) Gundih in Utility and Main Process
zones, measurement sampling points are determined by grid method with a distance of 10, 20,
30 meters based on space availability. Figure 1, 2, and 3 is sampling point distribution in the
research area.
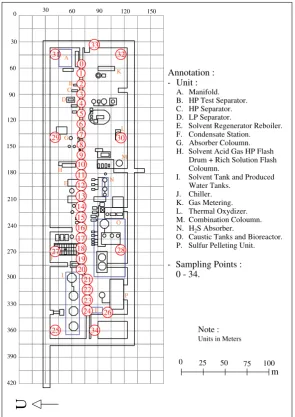
Figure 1 The distribution of sampling points in CPP Gundih
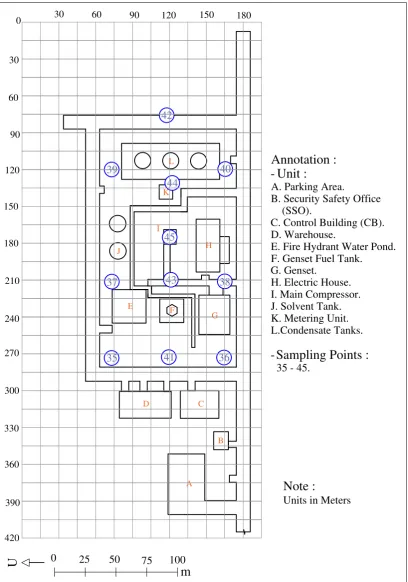
Figure 2 The distribution of sampling points in main process zone H. Solvent Acid Gas HP Flash
In Figure 1, can be seen the overall research location as well as 2 processing zones
namely Utility zone and Main Process zone. Main Process Zone is the main
location of gasprocessing Central Pocessing Plant (CPP) Gundih, while the Utility zone is the support of Main
Process zone operation, from Figure 1 it can be seen that the Utility zone is smaller than the
Main Process zone. This location is taken as the measurement location because at this location
is the main place of gas processing and the location of workers doing their work and exposure
to noise.
In this research, the average difference test is done using T test and analysis of Variance
(ANOVA) using IBM SPSS STATISTIC 23 software. Meanwhile noise distribution analysis using
Surfer 11 software.
3.
RESULTS AND DISCUSSION
The graph of the noise level measurement results is shown in Figure 4. Then compared with two
standard of noise level Minister of Environment Decree (KEPMENLH) no. 48 of 1996 and Decree
of the Minister of Labor (KEPMENAKER) no. 51 of 1999.
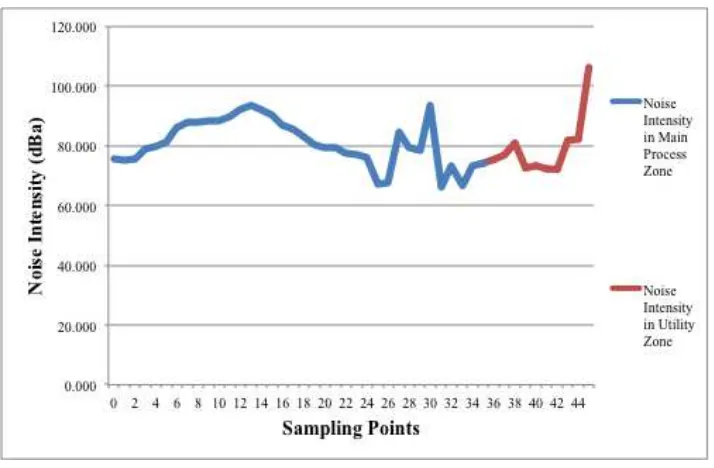
Figure 4 Noise level in CPP Gundih
72,139 dBa. At the noise measurement in CPP Gundih use noise loading A, so that the noise
intensity measurement unit in this study is dBa. This is because dBa loading is used in the
measurement of international standards (ISO) and in accordance with human hearing. In the
Figure 4 is known that the noise level that occurs in Central Processing Plant (CPP) Degrades in
Utility zone ranges from 72,139 dBa (point 42) - 106,285 dBa (point 45), while noise level in
Main Process zone is 66,227 dBa (point 31) - 93,459 dBa (point 13). The majority of the
sampling points passed the standard of noise level Ministry of Environment Decree (KEPMENLH)
no. 48 of 1996 except 4 points: 25, 26, 31 and 33 with noise level of 67,183 dBa, 67,177 dBa,
66,227 dBa and 66,789 dBa.
While the point that passes the noise level of the Ministry of Labor Decree (KEPMENAKER)
no. 51 of 1999 with the number of 8 working hours is the point 6, 7, 8, 9, 10, 11, 12, 13, 14, 15,
16, 17, 30 and 45, the noise value of these points is 85.967 dBa, 87,854 dBa, 87,844 dBa, 88,512
dBa, 88,187 dBa, 89,730 dBa, 92,054 dBa, 93,459 dBa, 92,229 dBa, 90,308 dBa, 87,155 dBa,
85,146, 93,536 dBa and 106,285 dBa. The highest noise level in Central Processing Plant (CPP)
Gundih occurred at point 45 at Utility zone with noise intensity of 106,285 dBa and the lowest
noise level occurred at 31 Main Process zone with noise intensity of 66,227 dBa.
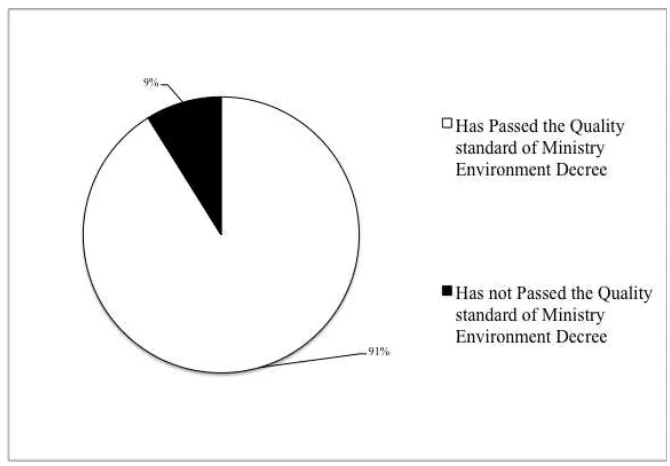
Figure 6 Noise level through standard noise level regulations Minister of Environment Decree number 48 Year 1996
In Figure 5 there is a 31.1% point that passes through the noise level standard of the
Ministry of Labor Decree (KEPMENAKER) no. 51 in 1999 Kepmenaker whereas in Figure 6 there
is only 9% point that does not pass the standard of noise level that is Minister of Environment
Decree No. KEPMENLH. 48 of 1996. The high noise occurring in the Utility zone is at point 45,
this noise comes from the compressor when conducting Blowdown or excessive pressure
release on the compressor to avoid explosion, the time required for the Blowdown itself ± 10
seconds depends on the amount of air pressure released. This makes the noise occurring at
point 45 is Impact Noise type, since the time required to reach its peak is 35 seconds and the
time required to decrease the noise level by 20 dBa is less than 500 seconds (Wahyu, 2003).
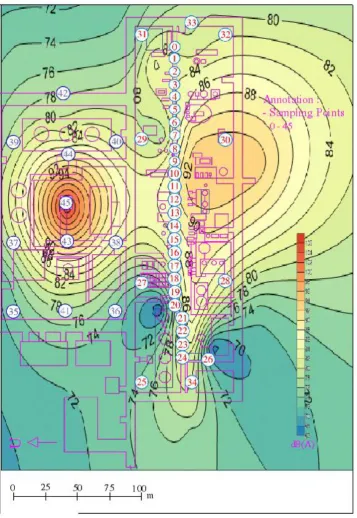
Contour distribution of this noise is needed to see how the noise spread in Central
Processing Plant (CPP) Gundih, This contour usefulness is very diverse, especially for noise
control and preparation of Hazard Identification Risk Assessment and Determining Control
(HIRADC) on noise risk factor. This contour is very useful for the development of Central
Pocessing Plant (CPP) Gundih itself, with this contour can be seen clearly the spread of noise at
Central Pocessing Plant (CPP) Gundih, so the development in Central Pocessing Plant (CPP)
Figure 7 Map contour distribution of noise at CPP Gundih
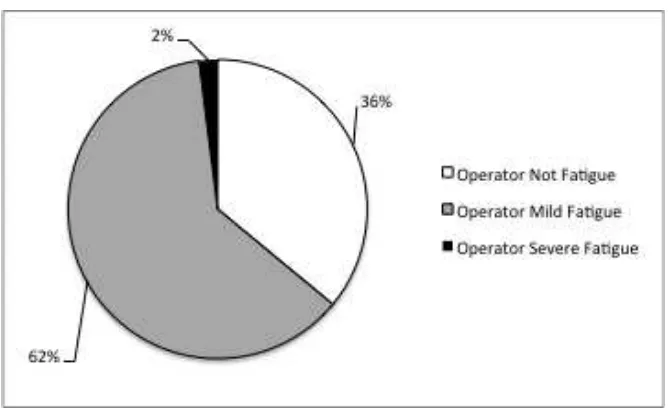
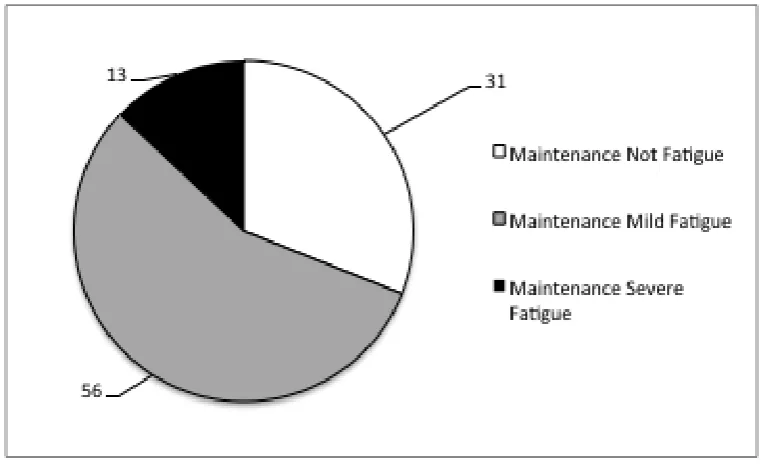
Work fatigue at Central Processing Plant (CPP) Gundih is divided into 5 groups based on the
value of fatigue obtained, which are: not fatigue, mild fatigue, moderate fatigue, severe fatigue
and very heavy fatigue, but in this study found only 3 groups namely: not fatigue, mild fatigue
fatigue, 62% operators experienced mild fatigue, 56% Maintenance mild fatigue and only 38%
Daily experiencing mild fatigue, in addition 2% operators experience severe fatigue, 8% Daily
experienced severe fatigue and 13% Maintenance suffered severe fatigue, from all units there
were non-fatigue respondents, 36% in this group of operators, 54% in Daily and 31% in
Maintenance which can be seen in Figure 8, Figure 9 and Figure 10.
Figure 8 Work fatigue on daily workers
Figure 10 Work Fatigue on Maintenance Workers
Daily Workers experience the most fatigue due to more constant and unchanged working
hours that is only at 07.00 - 15.00, so the work fatigue is felt different from other Units that
have work Shift at 15.00 - 23.00 and 23.00 - 07.00 in addition to work shift at 07.00 - 15.00.
Most operators experience mild exhaustion of workers who operate and monitor the
parameters in the field, so there is more noise exposure than the other work units. Section
Maintenance quite often work in the field, but the location of workshops and warehouses that
have a fairly close distance from the highest noise source that is point 45 compared to other
units, although the noise that occurs in the Maintenance room does not exceed the standard
level, but the noise wave from the point the highest noise level is heard at the Maintenance
location.
Fatigue that occurred in Central Processing Plant (CPP) Gundih dominated by mild fatigue,
with the occurrence of this fatigue the impact felt by workers is not large directly, but can be
great if not managed properly. This should be taken care of and well managed so that in the
long run it will not have a negative impact on workers. This is caused when the fatigue is a
condition of the disease then it is medical with the following symptoms: headache, pounding,
shortness of breath, loss of appetite, indigestion, difficulty sleeping. In addition to this, tired
fatigue is clinical as having psychiatric or psychic conflict (Sukmono, 2010). Quite a lot of
due to the use of Ear Protective Tool used by the worker well, so that the exposure of noise
received by the worker can be reduced well.
4.
CONCLUSION
In general the value of noise level has passed the standard of noise level of Decree of the
Minister of Environment (KEPMENLH) no. 48 Year 1996 of 70 dBa, although there are 4 points
that do not pass the standard of this level. In addition there are several locations that pass the
noise level of the Ministry of Manpower Decree (KEPMENAKER) no. 51 Year 1999 with exposure
time 8 hours / day that is 85 dBa. This then makes the workers experience fatigue which is
predominantly light fatigue with each unit of Daily: 38%, Maintenance: 56% and Operators 62%.
Thus it needs an increase in noise control efforts at Central Processing Plant (CPP) Grind to
noise sources, noise and noise receptors better especially in Utility zone compressor.
5.
ACKNOWLEDGEMENT
The authors express gratitude to employees Central Processing Plant (CPP) Gundih that
accompany the author in research process.
6.
REFERENCES
Keputusan Menteri Negara Lingkungan Hidup Nomor 48 Tahun 1996 tentang Baku Tingkat Kebisingan
Keputusan Menteri Tenaga Kerja nomor 51 Tahun 1999 tentang Nilai Ambang Batas Faktor Fisika Di Tempat kerja
Olishifski, Julian B, and McElroy Frank B. Fundamentals of Industrial Hygiene. National Safety Council. Chicago, 1971
Suma'mur, P. K. Higene Perusahaan dan Kesehatan Kerja. Jakarta: Gunung Agung, 1996.
Sukmono, D. H. Pengaruh Kebisingan Terhadap Tingkat Kelelahan Kerja di, Penggilingan Padi Desa Griyan Kelurahan Baturan Kecamatan Colomadu Kabupaten Karanganyar. Surakarta: Universitas Sebelas Maret, 2010.
Tarwaka, S. H. Ergonomi Untuk Kesehatan Kerja dan Produktivitas. Surakarta: Uniba Press, 2004.