THE EFFECT OF CRITICAL TRACTION IN COHESIVE ZONE
MODEL FOR FATIGUE CRACK GROWTH RETARDATION
Hendery Dahlan
Structural Dynamic Laboratory
Department of Mechanical Engineering, Andalas University Kampus Limau Manis, Padang, West Sumatera
Email: [email protected]
ABSTRACT
A cohesive zone model for simulation of fatigue crack growth is presented. The cohesive zone model is one of many alternative approaches used to simulate fatigue crack growth. The model incorporates a relationship between cohesive traction and separation in the zone ahead of a crack tip. The model introduces irreversibility into the constitutive relationships by means of damage accumulation with cyclic loading. The traction-separation relationship underpinning the cohesive zone model is not required to follow a predetermined path, but is dependent on irreversibility introduced by decreasing a critical cohesive traction parameter. The approach can simulate fatigue crack growth without the need for re-meshing and caters for single overloading. This study shows the retardation phenomenon occurring in elastic plastic-materials due to single overloading. Increasing the value of critical cohesive traction increases the extent of plastic zone at the crack tip which causes the fatigue crack growth to retard. Plastic materials can generate a significant plastic zone at the crack which is shown to be well captured by the cohesive zone model approach.
Keywords: cohesive zone model, fatigue crack growth.
INTRODUCTION
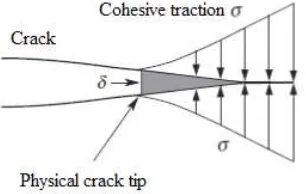
The cohesive zone model is delivered to provide a realistic representation fracture mechanism and also delivers simplicity in simulations of complex cracking processes. From the continuum mechanics point of view, crack extension improve complex failure processes at the microscopic levels such as void nucleation, growth and coalescence in ductile metals, microcrack in ceramics and crazing in certain polymers. If the failure process is limited to a narrow band, such as crazing in polymers and necking in ductile thin-sheet materials as shown in Figure 1, the cohesive zone may be utilized to perform the narrow deformation band. The cohesive zone may be regarded as an approximate representation of the crack tip failure process zone, such as microcrack in brittle materials and void growth and coalescence in ductile metals as shown in Figure 2.
cohesive traction and is the separation displacement of the cohesive surfaces.
(a) (b)
Figure 1 (a) Crazing zone ahead of a crack in a polymer, (b) necking zone in a ductile thin-sheet material
(a) (b)
Figure 2 (a) Microcrack zone ahead of a crack in a brittle solid (b) voids in a ductile metal
Figure.3 A cohesive zone ahead of a crack tip
The basic concept of cohesive zone model was introduced by Dugdale (1960) [1] and Barenblatt (1962) [2]. In these models, the crack is divided into two parts, one part of the crack surface is stress free, and the other part is loaded by cohesive stresses. Dugdale (1960) [1] introduced the finite stress to be the yield stress σY applicable only for plane stress, but
in practice the crack-opening stresses can be much higher than by yield stress. Barenblatt (1962) [2] investigated the fracture of brittle materials, he made several assumptions about the cohesive stresses, i.e. the extension of the cohesive zone is constant for a given material and small compared to other dimensions, the stress in the cohesive zone follow a prescribed distribution yield stress, σY
( )
x , where x is ligament coordinate, which is specific for a givenmaterial but independent of the global loading conditions.
In the current cohesive zone model, material separation and damage of the structure is classically described by interface elements. The interface elements open when damage occurs and completely lose their stiffness at failure so that continuum elements became
disconnected. The crack is limited to propagate only along the element boundaries. The
constitutive behaviour of a cohesive element is characterized by the relationship between a crack tip opening value or critical separation δc and the critical cohesive traction σc.
A large number of phenomenological traction-separation laws have been proposed and illustrated in Figure 5.6 such as bilinear [4], trapezoidal [5], polynomial and exponential [6] as shown in Figure 4. The qualitative shape of these functions is similar. Starting at the traction free undeformed state, the value of cohesive traction increases with the separation of crack surfaces up to a maximum value σc and decreases to zero when complete separation occurs at specific critical separation value δc. However, the effect of the cohesive law shape
on numerical results of fracture simulations has been investigated by Nguyen (2001) [7].
He revealed that the shape of traction-separation curve does not significantly affect the separation materials behaviour in numerical results.
For fatigue analysis, irreversible cohesive zone model involves a damage evolution
mechanism representing gradual degradation of the cohesive traction under cyclic loading. de-Andres (1999) [8] considered to add unloading conditions to a traction–separation law used in monotonic loading in conjunction with a cycle dependent damage variable to study fatigue crack growth under large scale yielding. Nguyen (2001) [7] developed a cohesive zone model using irreversible unload–load relations. The model was utilized to study fatigue crack growth in macroscopic aluminium specimens for constant amplitude loading and also to investigate the effects of overloads on fatigue crack growth. Roe and Siegmund (2003) [9] and Siegmund (2004)[10] proposed irreversible cohesive zone model involving a cyclic damage evolution rule for the cohesive strength to simulate fatigue crack growth.
c
σ
c
δ
c
σ
c
δ
(a) Bilinear (b) Trapezoidal
c σ
c
δ
c σ
c
δ
(c) Polynomial (d) Exponential
Most irreversible cohesive zone models considered the separation will back to zero along with unloading condition. However, in the present study, it is assumed that normal displacement jump or separation under unloading condition is constant. This is caused by the normal separation undergo the plastic deformation in that condition. The irreversible cohesive zone model is defined as the accumulation of the normal displacement jump or normal separation under cyclic loading. The normal separation also relate to the degrading of cohesive traction.
Single overloading is typically characterised by one high peak load and then followed by the lower constant amplitude loading. The overloading may lead to retardation or acceleration of fatigue crack growth. This phenomenon is a significant unexplained aspect in fatigue crack growth [11]. Most approaches proposed and developed are empirical which account for the retardation phenomena by means of a plastic zone created due to the high peak loading [12].
In cohesive zone model, three parameters are involved in the evaluating of fatigue crack
growth i.e. critical cohesive tractionσc, cohesive energy or toughness and critical separation
( )
δc . These parameters relate to the materials behavior in damage zone ahead of the cracktip. Since toughness is a well-established material property, the critical cohesive traction or normal separation is parameters which need to be specified. However, the critical cohesive
traction σc is a parameter which dictates to some extent the plastic behavior at damage
zone ahead of the crack tip. Its value is required to be higher than the yield stress σY for
yielding to occur at the crack tip. The plastic zone at the crack tip is recognized to be one of the most important quantities regarding for the retardation and induce crack closure [13]. It
is of interest therefore to consider the effect of various critical cohesive tractionsσc on the
fatigue crack growth retardation.
THE OBJECTIVE
In this paper, the cohesive zone model in Code_Aster is presented. The effect of critical cohesive traction on the fatigue crack growth rate by using the cohesive zone model due to the single overloading is analyzed.
COHESIVE ELEMENT LAW
In this paper, the cohesive element law was developed by Laverne (2012) [14]. It is considered reasonable to assume that the opening crack dissipates energy proportional to its length. The dissipated energy is called the surface energy and is denoted as Ψ. The surface energy defined at a discontinuity Γ representing a crack is considered dependent on the normal displacement jump δn of the crack surfaces and an internal variable κ which
manages the crack irreversibility. The crack irreversibility is defined to be the accumulation of normal displacement jump during loading cycles.
In incremental terms the crack irreversibility is expressed as
1 i n i n 1 i
i =κ− + δ −δ−
κ
(1)
Where ⋅ is positive when its content are positive but zero otherwise. The surface energy is defined as follows
(
δ κ)
= ∏(
δ κ)
ΓΨ
∫
Γ
d ,
, n
n
(2)
(
δn,κ)
=ψ( )
κ +IR( )
δn∏ +
(3)
where ψ is a cohesive energy density and + R
I is indicator function reflecting the
impenetrability condition the crack surface. + R
where the subscript n denotes the normal component (δn =δ⋅nis the opening displacement
or separation, n is an unit normal at Γ). The indicator function precludes inter penetration
since negative displacement jumps would result in an infinite energy (hence not a minimum).
The cohesive energy density ψ can further be defined as
( )
where σc is the maximum traction or critical cohesive traction and Gc is the critical strain energy release rate also known as toughness or cohesive energy. The stress vector noted traction τ is defined as belonging to a differential of the surface energy density
(
δ κ)
∏ ∂ =
τ , (6)
It is possible to define the normal cohesive traction to
( )
Since differentiation of Equation (7) reveals
c materials occurred. δn is the rate of normal separation. The cohesive law can be conveniently classified into three stages: initial stage, damage and post fracture as illustrated in Figure 5.
( )
and initiation period where σn
( )
0 ≤σc. The damage stage involves irreversibility, soc
In the post fracture stage identified by c 1
i ≥δ
κ−
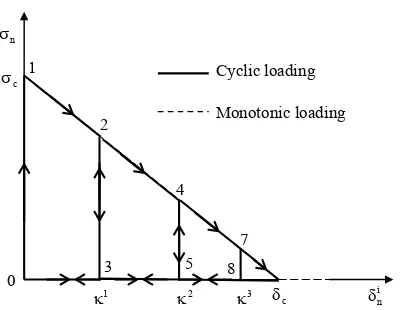
, where the normal separation can be defined as 6 presents cyclic condition in the traction-separation curve. One first cycle is identified via path 0-1-2-3-0 then second cycle followed by 0-3-2-4-3 and so on. Since the area under one looping is defined as energy dissipated or separation energy, a crack begins propagation when the accumulation of separation energy every cycle reaches the cohesive energy Gc
The separation energy dissipated for the one cycle loading can be calculated by
and then the normalized separation energy is equal to
0
n
σ
c
σ
c
δ i
n
δ
Cyclic loading Monotonic loading 1
2
3
4
5 7 8
1
κ κ2 κ3
Figure 6. Evolution of traction during monotonic and cyclic loading with the cohesive-traction law
MODEL DESCRIPTION
In the present work, a model consisting of 17.7 mm crack length with 50 mm of height (h) and 52 mm of width (w) is analyzed. The crack propagation is assumed to proceed along the axis of symmetry of the model as shown in Figure 7 (a). The assumed symmetry means that only half the model is simulated. The cohesive interfaces of 163 elements are placed along the symmetry line from the initial crack tip to the outer boundary. The model is meshed with 12680 quadratic-triangular elements as shown in Figure 7 (b). The mechanical
properties of the material used for linear-elastic analysis are: E = 72 GPa, σys = 300 MPa,
3 . 0
=
υ and G 9.5
IC = N/mm
A single stress overloading (Sol) of 26.25 MPa is applied at the first cycle and then followed by a stress loading (Smax) of 15.0 MPa applied uniformly on the top edge of the plate as a sinusoidal function as shown on Figure 7 (c). An overload ratio SOL=Sol /Smax =1.75
with a load ratio R =Smin /Smax =0 is applied. In this test case, the various critical traction (CS) used to examine the effect on crack propagation are 310 MPa, 320 MPa, 330 MPa, 340 MPa and 350 MPa, respectively.
50
17.7
52
o
σ
(a) Dimensions and boundary condition
(b) The cohesive element model (Plan_
Interace) in Code_Aster
0 5 10 15 20 25 30
0 500 1000 1500 2000 2500 3000 3500 4000
Number of cycle (N)
A
ppl
ie
d s
tre
ss
(M
P
a)
Sol
Smax
Smin
(c) Single overloading
RESULTS AND DISCUSSION
The crack length with respect to the number of cycle in various critical cohesive tractions
c
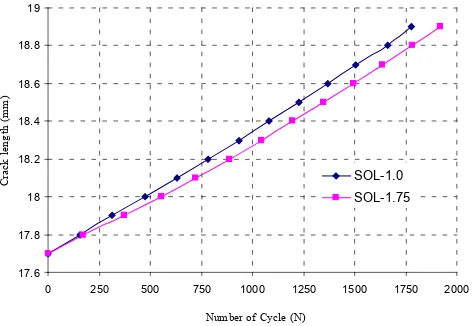
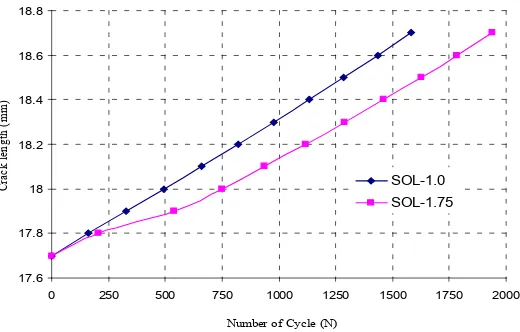
σ is depicted in from Figure 8 to 12. The figures show the comparison of fatigue crack growth without overloading (SOL-1) and with single overloading (SOL-1.75). It can be seen from these figures that for the critical cohesive traction CS-310 and CS-320 MPa, there is no retardation for an applied single overload as shown in Figure 8 and 9, respectively. The phenomenon of retardation appears for the critical cohesive traction of 330 MPa and 340 MPa, and is particularly occurs when the critical stress value is 350 MPa as shown in Figure 10, 11 and 12, respectively.
For the case study pertaining for various critical cohesive tractionsσc, it has been found that generally the critical cohesive traction affects the fatigue crack growth retardation. If the value of critical traction is close to the yield stress, it will not retard fatigue crack growth. Increasing the value of critical cohesive traction increases the extent of plastic zone at the crack tip. The plastic zone at the crack tip is recognized to be one of the most important quantities regarding for the crack growth retardation.
CONCLUSION
One of the more significant findings to emerge from this case study is that the cohesive zone model in Code_Aster can simulate the effect of a single overloading to retard the crack growth rate.
The critical cohesive traction affects the fatigue crack growth retardation. Increasing the value of critical cohesive traction increases the extent of plastic zone at the crack tip. which causes the fatigue crack growth retardation.
17.6 17.8 18 18.2 18.4 18.6 18.8 19 19.2 19.4 19.6
0 250 500 750 1000 1250 1500 1750 2000
Number of Cycle (N)
C
ra
ck
l
en
g
th
(
m
m
)
SOL-1.0 SOL-1.75
17.6 17.8 18 18.2 18.4 18.6 18.8 19 19.2 19.4
0 250 500 750 1000 1250 1500 1750 2000
Number of Cycle (N)
C
ra
ck
l
e
n
g
th
(
m
m
)
SOL-1.0
SOL-1.75
Figure 9. The comparison of the crack growth rate for difference type of loading at critical stress (CS) of 320 MPa
17.6 17.8 18 18.2 18.4 18.6 18.8 19 19.2
0 250 500 750 1000 1250 1500 1750 2000
Number of Cycle (N)
C
ra
c
k l
e
ngt
h (
m
m
)
SOL-1.0
SOL-1.75
Figure 10. The comparison of the crack growth rate for difference type of loading at critical cohesive traction (CS) of 330 MPa
17.6 17.8 18 18.2 18.4 18.6 18.8 19
0 250 500 750 1000 1250 1500 1750 2000
Number of Cycle (N)
C
ra
c
k l
e
ngt
h (
m
m
)
SOL-1.0 SOL-1.75
17.6 17.8 18 18.2 18.4 18.6 18.8
0 250 500 750 1000 1250 1500 1750 2000
Number of Cycle (N)
C
ra
ck
l
en
g
th
(
m
m
)
SOL-1.0 SOL-1.75
Figure 12. The comparison of the crack growth rate for difference type of loading at critical cohesive traction (CS) of 350 MPa
REFERENCES
[1] Dugdale, D.S. 1960, Yielding of Steel Sheets Containing Slits. Journal of the Mechanics and Physics of Solids, 8, p. 100-108.
[2] Barenblatt, G.I., 1962, The mathematical theory of equilibrium cracks in brittle fracture,. Advance Applied Mechanics, 7, p. 55-129.
[3] Hillerborg, A., Modeer, M., Petersson, P.E.,1976, Analysis of crack formation and crack growth in concrete by means of fracture mechanics and finite element. Cement Concrete, 6, p. 773-781.
[4] Siegmund, T., Needleman, A.,1997, A numerical study of dynamic crack growth in elastic-vicoplastic solids. Int. J. Solids Structure, 34, p. 769-787.
[5] Needleman, A.,1990, An analysis of tensile decohesion along an interface. J. Mech. Phys. Solids, 38, p. 289-324.
[6] Ortiz, M., Pandolfi, A., 1999, Finite-deformation irreversible cohesive elements for three-dimensional crack propagation analysis. Int. J. Numer. Meth. Eng., 44, p. 1267-1282.
[7] Nguyen, O., Repetto, E. A., Ortiz, M. and Radovitzky, R. A., 2001, A cohesive model of fatigue crack growth. International Journal Fracture, 110, p. 351-369.
[8] de-Andres, A., Perez, J. L., Ortiz, M., 1999, Elastoplastic Finite element analysis of three dimensional fatigue crack growth in aluminum shafts subjected to axial loading. International Journal of Solids and Structures, 36, p. 2231-2258.
[9] Roe, K., L., Siegmund, T., 2003, an Irreversible Cohesive Zone Model for Interface Fatigue Crack Growth Simulation. Engineering Fracture Mechanics, 70, p.209-232. [10] Siegmund, T., 2004, A numerical study of transient fatigue crack growth by use of an
residual life using an exponential model: Part II (mode-I overload induced retardation). International Journal of Fatigue, 31, p. 425–432.
[12] Kim, K.S., Kim, S.C., Shim, C.S., & Park, J.Y., 2004, A studying on the effect of overload Ratio on Fatigue Crack Growth. Key Engineering Materials, p. 1159-1168. [13] Elber, W., 1970, Fatigue crack closure under cyclic tension. Journal Engineering
Fracture. Mechanics, 2, p. 37-45.