In
fl
uence of preload and afterload on stroke volume response to low-dose
dobutamine stress in patients with non-ischemic heart failure: A cardiac MR study
Alessandro Pingitore
a,⁎
, Giovanni Donato Aquaro
b, Valentina Lorenzoni
a, Maddalena Gallotta
a,
Daniele De Marchi
b, Sabrina Molinaro
a, Valentina Cospite
d, Claudio Passino
b,c, Michele Emdin
b,
Massimo Lombardi
b, Vincenzo Lionetti
b,c, Antonio L'Abbate
caCNR Institute of Clinical Physiology, Pisa, Italy bFondazione CNR - Regione Toscana
“G. Monasterio”, Pisa, Italy
cLaboratory of Medical Science, Institute of Life Sciences, Scuola Superiore Sant'Anna, Pisa, Italy dDepartment of Cardiology, University of Palermo, Italy
a b s t r a c t
a r t i c l e
i n f o
Article history:
Received 12 January 2011
Received in revised form 1 November 2011 Accepted 24 November 2011
Available online 9 December 2011
Keywords:
Magnetic Resonance Imaging Preload reserve
Afterload
Dilated cardiomyopathy Low-dose dobutamine Heart failure
Background:Lack of increase in left ventricular (LV) stroke volume (SV) during low-dose dobutamine stress (LDD) is attributed to exhausted cardiac contractile reserve in failing heart. However, the role of the afterload and preload in SV changes is underestimated. The aim of the study was to investigate the effects of LDD on preload reserve and afterload in patients with non-ischemic heart failure.
Methods:58 patients (age 62 years) underwent LDD (up to 20μg/kg/min) using cardiac magnetic resonance.
Results:LV-SV increased by 27% in 24 patients (pb0.001) (SV+), while decreased by 19% in 22 patients (pb0.001) (SV−). The LDD-to-rest reduction in preload, as defined by LV end-diastolic volume (EDV), was more pronounced in SV−than SV + (24% and 8% respectively, pb0.05). The LLD-to-rest increase in systolic
blood pressure to LV end systolic volume ratio, an index of LV contractility, was higher but not statistically different in SV + in comparison to SV−(70% vs 48%, p = ns). Systemic vascular resistance during LDD tended to be higher in SV−(23%, p = ns), while it was significantly reduced in SV + (9.5%, pb0.011), whereas
arte-rial elastance (Ea) increased in SV−(30%, pb0.001) but decreased in SV + (0.5%, p = 0.04). At multivariable regression models LV-EF, LV-EDV and Ea significantly contributed to LV-SV changes in all patients. Also among SV + and SV−LV-EDV and Ea revealed significant contribution to LV-SV change.
Conclusions:At similar contractile reserve response, the lack of LDD-induced increase in LV-SV, can be related to reduced preload reserve as well as to increased afterload.
© 2011 Elsevier Ireland Ltd. All rights reserved.
1. Introduction
The low-dose dobutamine stress (LDD) is widely used in the
diag-nostic and/or progdiag-nostic setting of patients with cardiac diseases
[1
–
4]
. In patients with dilated cardiomyopathy (DC), the LDD test
combined to non-invasive cardiac imaging is widely used to assess
the contractile reserve of dysfunctional myocardium
[5
–
8]
. Magnetic
Resonance Imaging (MRI) is an accurate diagnostic tool to investigate
non-invasively both preload and contractile function at rest and
dur-ing stress
[9,10]
. The assessment of LDD responsiveness is clinically
relevant to identify patients with preserved cardiac performance
and better prognosis in the presence of chronic heart failure (HF)
[11,12]
. The increase of stroke volume (SV), ejection fraction (EF)
and cardiac output (CO) as well as the decrease of the end-systolic
volume (ESV) during LDD stress de
fi
nes the pattern of contractile
reserve
[13]
. The lack of increase of left ventricular (LV) SV and
EF during LDD is an independent prognostic marker of functional
impairment of the heart in patients with non-ischemic DC
[14,15]
.
However, the changes of LV-EF and SV do not always re
fl
ect the
proper state of myocardial function and cardiac performance of
patients with heart failure
[16,17]
. In fact, these parameters of
global cardiac function are in
fl
uenced by several factors beyond
contractility per se, including loading conditions and chamber
geometry. In the presence of unchanged afterload, the preload
recruitment during inotropic stimulus can increase LV force
develop-ment maintaining the stroke volume at physiological level in accord
with the Frank
–
Starling mechanism, which is still preserved in
human end stage failing myocardium
[18]
. Moreover, the positive
lusi-tropic effect of inolusi-tropic agents, as dobutamine, contributes to reduce
the LV end-diastolic wall stress and improve LV early re
fi
lling by
increasing cardiac performance of failing heart in a
preload-dependent manner
[19]
. A recent study reveals that DC patients
with increased LV end-diastolic volume and stroke volume during
exercise stress test have better prognosis
[20]
.
–
⁎Corresponding author at: CNR Institute of Clinical Physiology, Via Moruzzi 1, 56124, Pisa, Italy. Tel.: +39 050 3152605; fax: +39 050 3152166.
E-mail address:[email protected](A. Pingitore).
0167-5273/$–see front matter © 2011 Elsevier Ireland Ltd. All rights reserved. doi:10.1016/j.ijcard.2011.11.037
Contents lists available at
SciVerse ScienceDirect
International Journal of Cardiology
To highlight the clinical relevance of preload responsiveness
during physiological stress, additional studies are sorely needed.
The aim of our study was to assess the impact of changes in
pre-load reserve and afterpre-load on the magnitude of SV response during
LDD in patients with non-ischemic DC.
2. Methods
2.1. Patients
Forty six consecutive patients (mean age 62 ± 12 years, 44 males) with stable chronic non-ischemic DC were referred to the magnetic resonance (MR) laboratory to perform LDD stress test in order to assess contractile reserve. Patients with non-ischemic DC diagnosed on the basis of echocardiographically documented end-diastolic diameter >56 mm, LV-EFb50% and normal coronary angiography, entered the study. Exclusion criteria were: 1) history of life-threatening ventricular arrhyth-mias, 2) absence of sinus rhythm, 3) absolute contraindication to MR and 4) unstable clinical conditions. In addiction twelve subjects with EF > 55% of left ventricle, atypical chest pain and without history or documentation of heart disease served as the control group. These subjects were referred to the MR to perform high-dose dobutamine stress test in order to exclude the presence of inducible myocardial ischemia. From this group, data obtained at LDD only, were used for comparison with DC patients. Accord-ing to the increase or decrease of LV-SV durAccord-ing LDD, patients with LV dysfunction were clustered into two groups: SV + patients (n = 24) increasing SV during LDD, as op-posed to SV−patients (n = 22) decreasing SV during LDD.
All patients and controls gave their written informed consent. The study was ap-proved by the local ethics review committee, and the investigation conformed with the principles outlined in the Declaration of Helsinki (Br Med J 1964;ii:177).
2.2. Low dose dobutamine stress testing
Dobutamine was infused in 5-min dose increments, starting from 5μg/kg/min and increased to 10 and 20μg/kg/min, each step lasting 5 min. Systolic (S), diastolic (D) and mean (M) arterial pressure (AP) and heart rate (HR) were measured at rest and during LDD stress. The test was interrupted for one of the following reasons: intolera-ble symptoms, limiting asymptomatic side effects, consisting of a) hypertension (SAP >200 mm Hg; DAP >110 mm Hg); b) hypotension (relative or absolute): >30 mm Hg fall in AP; c) supraventricular arrhythmias; d) ventricular arrhythmias.
All the cardiovascular parameters were measured in basal condition and during LDD at peak dose of dobutamine in both control and DC groups.
2.3. Cardiac magnetic resonance data acquisition
Cardiac MR was performed using a dedicated 1.5 T whole body scanner (Hdx, GE, Milwaukee, Michigan, USA) with a Cardiac Phased Array 8 channel coil. MR included evaluation of left and right ventricular function at rest and LDD. A breath-hold segmented-gradient echo fast imaging employing steady-state acquisition (FIESTA) ECG-triggered sequence was used to evaluate left and right ventricular function by using standard parameters. In each patient a total of 9 to 12 short-axis views (depend-ing on the LV volume) and 2 long-axis views (one vertical and one horizontal) were ac-quired, with a minimum of 30 cine frames for each slice[21,22]. Delayed enhancement was obtained in order to assess the presence of myocardialfibrosis. A fast gradient echo inversion recovery sequence was utilized. Delayed enhancement images were recorded 8–10 min after bolus injection of gadobutrol (Gadovist®, Schering, Germany; 0.2 mmol/kg); images were acquired in the same short axis and long axis slices as used for cine MR[23]. A free breathing phase-velocity cine MR technique (PVC MR) was used for determination of regurgitant stroke volume of both ventricles in order to as-sess mitral and tricuspid regurgitation[24,25]. Briefly, the through-planeflow was measured orthogonal to the vessels in the ascending aorta and in the pulmonary artery by an acquisition plane placed 5 mm over valvular plane. The following acquisition pa-rameters were used: TR/TE 12/5 ms,flip angle 20°,field of view 30, phasefield of view 1, matrix 192 × 192, reconstruction matrix 256 × 256, slice thickness 5 mm, and num-ber of excitation 5. Flow sensitivity was set to 250 cm/s of encoded velocity and raised if aliasing artifact occurred. The number of cardiac phases was set according to the heart rate, in order to obtain a temporal resolution of aortic wall excursion of approx-imately 10−3s.
2.4. Cardiac magnetic resonance measurements
The FIESTA and PVC MR imaging sequences for the assessment of ventricular func-tion,flows and wall excursion, pulmonary and aorticflow were transferred to a work-station (Advantage Windows 4.1 GE) and elaborated by means of a commercially available software (Mass plus and CV Flow respectively, MR Analytical Software Sys-tems, version 4.0, Leiden, The Netherlands). Briefly, endocardial and epicardial con-tours were automatically traced in all the cine short axis images of all temporal phases. Manual correction of contours was performed when appropriate. The ric data of left and right ventricles were plotted against the time (in ms) in a volumet-ric time curve (Figs. 1 and 2) for left ventricle only. From these curves the end-diastolic
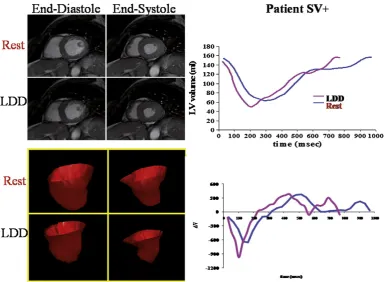
Fig. 1.Evaluation of LV volumes in a patient SV+ at rest and during LDD stress. Left upper panel: end-diastolic and end-systolic frames of a SSFP basal short axis view at baseline (rest) and during infusion of dobutamine at peak dose (LDD); left lower panel: three-dimensional reconstruction of the LV chamber in end-diastole and end-systole at rest and during LDD at peak dose; right upper panel: representative LV volume/time curve at rest (blue) and during LDD stress (red) showing a minimal decrease in LV volumes at peak dose of dobutamine; right lower panel: representative dV/dt curve of LV at rest and during LDD stress at peak dose.
(EDV, ml) and end-systolic volumes (ESV, ml) were measured and EF (%) and SV (ml) of both ventricles were derived. Cardiac output (CO, ml∗bpm) was calculated as the product between the SV and HR. The ratio between SAP and LV-ESV (SAP/LV-ESV) was calculated as a global contractility index of left ventricle[26]. Systemic vascular re-sistance (SVR, mm Hg/min/l) was calculated as the ratio of mean arterial pressure to cardiac output[27]. Arterial Elastance (Ea, mm Hg/ml) was calculated as follows: (SBP × 0.9) / SV[28]. End-diastole corresponded to peak of electrocardiographic R wave while end-systole corresponded to the smallest LV cavity during the cardiac cycle.
Diastolic parameters of the left ventricle were calculated from the time derivative of LV volume (LV dV/dt) curve as previously described[29,30]. Briefly, a LV dV/dt curve was generated as thefirst derivative transformation of the volumetric time curve. The early (E) and late (A) peakfilling rate (PFR) and the E/A ratio were measured as, re-spectively, the early and the late diastolic peak of LV dV/dt curve (Fig. 1).
The extent of delayed enhancement was measured as previously described[22,23]. Enhanced myocardium was defined as myocardium with a signal intensity of≥2 stan-dard deviations above the mean of the region of interest. The LDD to resting differences of the variables were calculated as follows: (LDD-resting) / resting∗100.
Mitral and tricuspid regurgitation were assessed by subtracting the forwardflow of the great vessel (aortic and pulmonary forwardflow for the quantification of mitral and tricuspid valve regurgitation), calculated by PVC MR, from the stroke volume (vol-umetric computation) of the corresponding ventricles (left and right ventricles for mi-tral and tricuspid valve regurgitation, respectively). Normalizing the regurgitation volume to the corresponding ventricular stroke volume, the regurgitation fraction was calculated.
2.5. Plasma assays
The plasma level of amino-terminal pro-brain natriuretic peptide (NT-proBNP), was measured with an automated electrochemi-luminescent immunoassay as previ-ously described[31]. Creatinine was measured in a timed plasmatic sample.
2.6. Statistical analysis
All data were analyzed using SPSS software (version 13). Categorical variables are presented as number of subjects (percentages) and continuous variables are expressed as means ± 1 SD or median (25th–75th percentile) where appropriate.
Fisher andχ2test were used to compare categorical variables. IndependentTtest and Mann–WhitneyUtest were used to compare parameters between controls and all DC patients. One-way analysis of variance (ANOVA) and Kruskal–Wallis test were used
to compare data between the three groups and post hoc comparisons were performed respectively using Bonferroni post hoc tests or Mann–WhitneyUtest with Bonferroni correction for p-value. PairedT-test and Wilcoxon test were used to compare parame-ters after and before LDD within groups. Univariable linear regression analysis was used to identify variables contributing to SV change in all patients as well as within groups of resting variables and their LDD-induced change. The relative contribution of resting variables and their LDD-induced change was then evaluated using multivar-iable regression models. Resting varmultivar-iables as well as induced changes were entered into univariable regression analysis; then, all variables whose significance level was b0.1 were entered into the multivariable model. Stepwise methods as well as clinical considerations were used to build up thefinal model. A p-valueb0.05 was considered to be statistically significant.
3. Results
3.1. Controls vs DC patients. Clinical characteristics
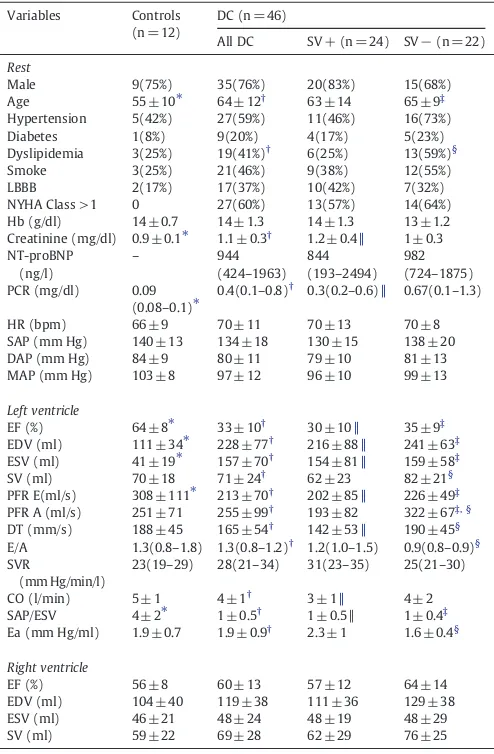
Clinical, hemodynamics and resting LV and RV parameters of
con-trols, SV
−
and SV+ DC patients are shown in
Table 1
. Compared to
controls, DC patients showed signi
fi
cantly larger LV EDV and ESV,
lower LV-EF, and SAP/LV-ESV. Conversely, EDV and ESV of right
ven-tricle were similar to controls. Clinical and bio-humoral parameters
between SV+ and SV
−
were similar with the exception of higher
number of subjects with dyslipidemia in SV
−
. With regard to cardiac
MR parameters, SV
−
showed higher LV-SV, higher DT, PFR-A and E/A
ratio, but lower Ea in comparison to SV+. No DC patient showed
intramyocardial enhanced areas.
3.2. Baseline to LDD changes in cardiac MR parameter
LDD testing was completed in all patients without any
inconve-nience or side effects. All the controls had a maximal negative high
dose dobutamine stress test for myocardial ischemia. LDD-induced
changes are reported in
Table 2
and the LDD to rest differences are
reported in
Table 3
.
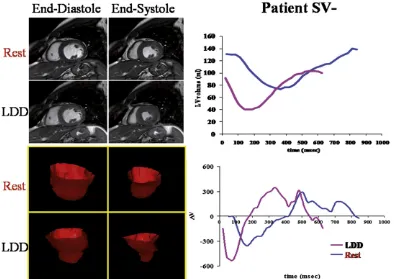
Figs. 1 and 2
show two representative examples
Fig. 2.Evaluation of LV volumes in a patient SV−at rest and during LDD stress. Left upper panel: end-diastolic and end-systolic frames of a SSFP basal short axis view at baseline (rest) and during infusion of dobutamine at peak dose (LDD); left lower panel: three-dimensional reconstruction of the LV chamber in end-diastole and end-systole at rest and during LDD at peak dose; right upper panel: representative LV volume/time curve at rest (blue) and during LDD stress (red) showing a marked reduction in LV volumes at peak dose of dobutamine; right lower panel: representative dV/dt curve of LV at rest and during LDD stress at peak dose.
of changes in LV volumes during the cardiac cycle in SV+ and SV
−
DC patients. The decrease of LV-EDV was signi
fi
cant among DC
patients and was more pronounced in SV
−
than the SV +
group. Conversely, CO was unchanged in SV
−
while increased in
controls and SV+. The increase of the LV-EF was signi
fi
cant in
all patients and less marked in SV
−
than in the other two groups.
The LDD-to-rest increase in SAP/LV-ESV was similar in SV
−
and
SV+, reaching values still much lower than in controls. Otherwise,
SVR during LDD was unchanged compared to baseline in SV
−
patients, but they were signi
fi
cantly reduced in control and SV+
patients whereas Ea increased in SV
−
and reduced signi
fi
cantly
in SV
−
.
Regarding RV, RV-EDV reduced signi
fi
cantly in SV+ and SV
−
,
whereas RV-SV remained unchanged in SV+ and reduced in SV
−
.
Changes in diastolic parameters were specular between SV
−
and
SV+: A and E waves PFR decreased in SV
−
patients while increased
in SV+. There was no statistical difference in mitral and tricuspid
re-gurgitation between SV+ and SV
−
at rest and during LDD.
Further-more, rest to LLD changes in mitral and tricuspid regurgitation were
not signi
fi
cantly different in SV+ and SV
−
(mitral regurgitation:
SV+ rest 20 ± 8%, LDD 17 ± 12%; SV
−
21 ± 9%, LDD 20 ± 10%;
tricuspid regurgitation: SV+ rest 5 ± 5%, LDD 5 ± 2.5%; SV
−
4 ± 2%,
42.6.%).
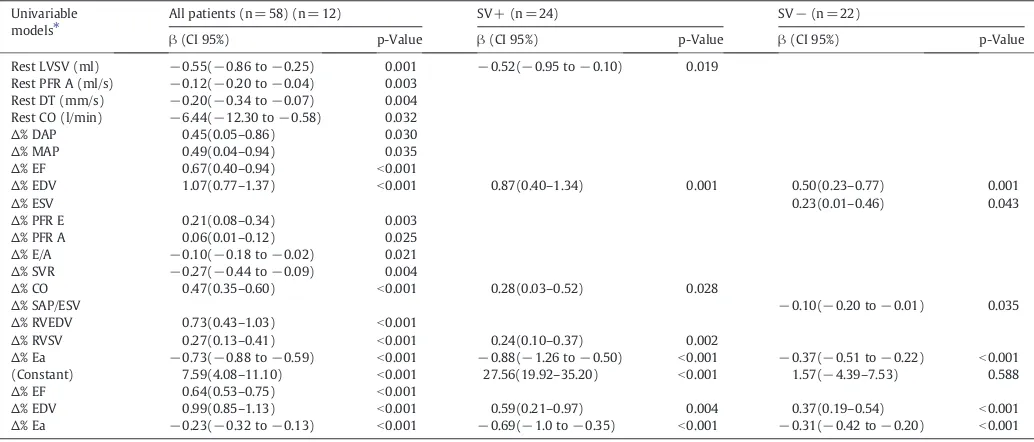
3.3. Regression analysis
Results of univariable and multivariable regression models are
shown in
Table 4
and, in which the signi
fi
cant coef
fi
cients are
reported. At multivariable analysis the increase of EF and
LV-EDV determined a rise in LV-SV while a decrease in Ea contributed
to increase LV-SV. Similarly when SV
−
and SV+ patients were
con-sidered, the 2 independent variables were LV-EDV and Ea.
3.4. Plasma assays
NT-proBNP values were similar in DC patients (944 ng/l). Similarly,
creatinine was increased in DC patients compared to controls (1.11
±0.33 vs 0.89 ±0.07 mg/dl, p
b
0.022) despite similar hematocrit values.
4. Discussion
Our study showed that the lack of stroke volume increase in
response to LDD depends on a reduction of preload reserve and
increase in afterload in the presence of blunted contractile reserve
in patients with ischemic DC. Among patients with
non-ischemic DC and similar LV-EF, LDD did not increase LV-SV in
38% of patients.
As expected, LDD enhanced global LV function in control patients
in accord with an increased contractility (increased SAP/LV-ESV
ratio) and reduced SVR. Moreover, the left and right ventricular
Table 1
Clinical characteristics, hemodynamics, left and right ventricular parameters at rest.
Variables Controls
NYHA Class >1 0 27(60%) 13(57%) 14(64%)
Hb (g/dl) 14 ± 0.7 14 ± 1.3 14 ± 1.3 13 ± 1.2
E/A 1.3(0.8–1.8) 1.3(0.8–1.2)† 1.2(1.0–1.5) 0.9(0.8–0.9)§
SVR
LBBB = left bundle branch block, Hb = hemoglobin, NT-proBNP = n-terminal pro brain na-triuretic peptide, PCR = protein C reactive, HR = heart rate, DAP = diastolic arterial pres-sure; SAP = systolic arterial pressure, MAP = mean arterial pressure, EF = ejection fraction, EDV = end diastolic volume, ESV = end systolic volume, SV = stroke volume, PFR = peak filling rate; DT = deceleration time, SVR = systemic vascular resistance, CO = cardiac out-put, SAP/ESV = systolic arterial pressure/end-systolic volume ratio, Ea = elastance.
⁎ pb0.05 for comparison between controls and DC, independentT-test or Mann–Whitney Utest appropriately.
†
pb0.05 for comparison between controls, SV+, SV−, ANOVA or Kruskal–Wallis test ap-propriately.
N
pb0.05 for post-hoc comparison between controls and SV+.
‡
pb0.05 for post-hoc comparison between controls and SV−.
§p
b0.05 for post-hoc comparison between SV+ and SV−.
Table 2
Hemodynamics, left and right ventricular parameters during LDD.
Variables Controls E/A 1.2(0.8–1.8) 1.4(1.1–1.6)⁎ 1.3(1.1–1.6) 1.4(1.3–1.8)⁎ SVR (mm Hg/min/l) 21(20–25) 26(22–35) 25(20–34)⁎ 29(23–37) CO (l/min) 7 ± 1.5⁎ 5 ± 2⁎ 6 ± 2⁎ 5 ± 2
⁎ pb0.05 for comparison between LDD and rest values, pairedT-test or Wilcoxon test appropriately.
preloads, as de
fi
ned by respective EDV, slightly decreased and diastolic
function improved, according to enhanced early and late PFR.
In SV
−
patients the EDV of both ventricles was markedly reduced
during LDD compared to SV+ and control patients in the presence of
increased afterload, as shown by the increase in Ea, and in the
pres-ence of inotropic reserve that was blunted in comparison to control,
although it was similar to SV+. The increase of heart rate guaranteed
only the preservation of CO and EF during LDD stress in the presence
of unfavorable changes in cardiac loading conditions. Importantly
there were no signi
fi
cant changes in mitral or tricuspid regurgitation.
Using the pressure/volume framework for the analysis of the
interaction between cardiac loading changes and function, at rest
relative to control SV+ and SV
−
have lower systolic function as
indicated by the lower slope of the systolic pressure/end diastolic
volume (
Fig. 3
, dashed thin lines) and higher ventricular volumes.
Higher end-diastolic volumes (preload) in SV+ and SV
−
are
asso-ciated with stroke volume values (
Fig. 3
, numbers and horizontal
bars) similar to controls. The compensatory utilization of preload
reserve is particularly evident in SV
−
group. LDD increases
ino-tropism in controls as well as in patients with DC, according to
the increase in slope of the thin dashed lines (
Fig. 3
, arrows).
However, the larger decrease in preload in SV
−
as compared to
the other groups and the increased arterial elastance
(approxima-ted by the pressure/volume slope during ejection) are responsible
for the drastic reduction in stroke volume. Thus, decrease in stroke
volume during the test may not be expression of more depressed
Table 4
Univariable and multivariable regression analyses of LDD-induced changes in LVSV.
Univariable models⁎
All patients (n = 58) (n = 12) SV+ (n = 24) SV−(n = 22)
β(CI 95%) p-Value β(CI 95%) p-Value β(CI 95%) p-Value
Rest LVSV (ml) −0.55(−0.86 to−0.25) 0.001 −0.52(−0.95 to−0.10) 0.019 Rest PFR A (ml/s) −0.12(−0.20 to−0.04) 0.003
Rest DT (mm/s) −0.20(−0.34 to−0.07) 0.004 Rest CO (l/min) −6.44(−12.30 to−0.58) 0.032
∆% DAP 0.45(0.05–0.86) 0.030
∆% MAP 0.49(0.04–0.94) 0.035
∆% EF 0.67(0.40–0.94) b0.001
∆% EDV 1.07(0.77–1.37) b0.001 0.87(0.40–1.34) 0.001 0.50(0.23–0.77) 0.001
∆% ESV 0.23(0.01–0.46) 0.043
∆% PFR E 0.21(0.08–0.34) 0.003
∆% PFR A 0.06(0.01–0.12) 0.025
∆% E/A −0.10(−0.18 to−0.02) 0.021
∆% SVR −0.27(−0.44 to−0.09) 0.004
∆% CO 0.47(0.35–0.60) b0.001 0.28(0.03–0.52) 0.028
∆% SAP/ESV −0.10(−0.20 to−0.01) 0.035
∆% RVEDV 0.73(0.43–1.03) b0.001
∆% RVSV 0.27(0.13–0.41) b0.001 0.24(0.10–0.37) 0.002
∆% Ea −0.73(−0.88 to−0.59) b0.001 −0.88(−1.26 to−0.50) b0.001 −0.37(−0.51 to−0.22) b0.001
(Constant) 7.59(4.08–11.10) b0.001 27.56(19.92–35.20) b0.001 1.57(−4.39–7.53) 0.588
∆% EF 0.64(0.53–0.75) b0.001
∆% EDV 0.99(0.85–1.13) b0.001 0.59(0.21–0.97) 0.004 0.37(0.19–0.54) b0.001
∆% Ea −0.23(−0.32 to−0.13) b0.001 −0.69(−1.0 to−0.35) b0.001 −0.31(−0.42 to−0.20) b0.001
Abbreviations: seeTable 1.
⁎ Only significant coefficients are reported.
Table 3
LDD-to rest differences in hemodynamics, left and right ventricular parameters.
Variables Controls (n = 12) SV + (n = 24) SV−(n = 22) p-Value
Overall Controls SV + SV−
∆% HR 38.2 ± 23.1 34.6 ± 32.8 39 ± 30.7 b0.001 b0.001 b0.001 b0.001
∆% SAP 2.4 ± 16.6 16 ± 18.2 9.3 ± 15.5 b0.001 ns b0.001 0.011
∆% DAP −7.7 ± 11.9 0.3 ± 20.9 −7.2 ± 18.1 0.024 ns ns 0.039
∆% MAP −2.6 ± 12.6 7.5 ± 17.7 0.8 ± 16.2 ns ns ns ns
Left ventricle
∆% EF 26.3 ± 14 37.1 ± 27.4 9.8 ± 15.8 b0.001 b0.001 b0.001 0.023
∆% EDV −10.8 ± 13.4 −7.9 ± 18.4 −24.4 ± 18.1 b0.001 0.014 0.048 b0.001
∆% ESV −51.8 ± 21.1 −23.9 ± 24.7 −26.4 ± 26.3 b0.001 b0.001 b0.001 b0.001
∆% SV 11.2 ± 20.3 26.7 ± 25.3 −19.3 ± 14 ns ns b0.001 b0.001
∆% PFR E 11(−13.2 to−40.3) 56.7(50.6–68.5) −10.5(−16.2 to−2) b0.001 ns b0.001 0.046
∆% PFR A 15.3(−6.6–50.1) 35.8(7.1–57) −37.5(−43.2 to−34.2) ns ns 0.023 b0.001
∆% DT −25.1(−36.5–9.3) −13.7(−34.6 to−2.2) −39.5(−42 to−31.5) b0.001 ns ns b0.001
∆% E/A −18.1(−22.6–61.6) 8.7(−13.8–35) 62.8(39.7–116.7) 0.008 ns ns b0.001
∆% SVR −0.7(−30.4–17.1) −9.5(−30.8–8.6) 22.7(−23.2–57.8) ns ns 0.011 ns
∆% CO 53.6 ± 42.6 67.4 ± 42 9.6 ± 23.2 b0.001 0.001 b0.001 ns
∆% SAP/ESV 117.8(62.9–174.2) 69.2(19.8–101.9) 47.6(21.7–98) b0.001 0.002 b0.001 0.031
∆% Ea −6.2(−20.0–7.7) −0.5(−22.5–7.9) 29.9(17.6–69.0) ns ns 0.037 b0.001
Right ventricle
∆% EF −8.6(−29.8–8.5) −14.2(−29.4–9.8) −42.1(−44.9 to−27.7) b0.001 0.003 0.037 ns
∆% EDV −12.1 ± 20.1 −11.6 ± 21.7 −37 ± 12.4 b0.001 ns 0.007 b0.001
∆% ESV −36.8 ± 22.2 −7 ± 37.1 −30.4 ± 21.8 b0.001 0.001 0.038 0.001
∆% SV 44.3(17–51) 45.2(19.1–74.8) 46.3(22.4–83.7) 0.002 ns ns 0.001
Abbreviations: seeTable 1.
contractility but rather of preload and afterload changes induced
by the drug.
These results highlight that, in addition to direct cardiac effects
mediated by its dominant beta agonist activity, dobutamine has
vas-cular actions on both arterial and venous vessels, potentially affecting
cardiac load, and thus cardiac performance. The direct action of
dobu-tamine on the systemic venous system might play a critical role in
modulating the ventricular preload overall, via stimulation of both
alpha- and beta-adrenoreceptors
[32,33]
.
Preload recruitment is the adaptive response to decreased
myo-cardial contractility, in accordance with the Frank
–
Starling
mecha-nism
[17,34]
, and thus the lack of it might explain the absence of
enhanced contractility during LDD infusion in SV
−
group. This
assumes clinical relevance since LV-EF changes during LDD are
recog-nized as an independent prognostic marker in patients with
non-ischemic DC
[14,15]
. Moreover, the reduction in early ventricular
fi
lling can be mainly ascribed to preload changes rather than to
im-pairment of left ventricle relaxation during acute increase in
work-load, as previously observed in hypertensive patients with LV diastolic
dysfunction
[35]
. Previous studies showed that beta-adrenergic
recep-tors might mediate venodilation in humans instead of venoconstriction.
In our study we can assume that SV
−
patients might have an impaired
venoconstrictive response in accord to previous report
[36,37]
.
Moreover dobutamine also affects the afterloading characteristics
of the systemic artery independent from the direct myocardial action
[38]
. The typical response to dobutamine is the reduction in afterload
through the direct effect on the resistive arteriolar
[38]
. However, HF
is characterized by several abnormalities of vascular function,
includ-ing vasoconstriction, impaired exercise-induced vasodilation, and
im-paired endothelium-dependent vasodilation
[39]
that appear related
in part to increased oxidative stress and reduced bioavailability of
nitric oxide
[40]
.
In particular the low availability of nitric oxide, that is the way
through dobutamine produces vasodilation
[41]
, may be one reason
of the abnormal arteriolar vasoconstrictive response to dobutamine
causing increased afterload, and thus impairment of stroke volume.
Thus taking at whole these results, we hypothesize that a
vasoac-tive response to dobutamine, consisting of reduction in afterload
(di-lation of resistive artery) and increase in venous return mediated by a
reduction in venous capacitance (constriction of capacitive vein) is
elicited in control and SV+ patients. This vasoactive response
pro-vides the increase in cardiac performance in SV+ patients even in
the presence of blunted contractile response. Conversely, this
LDD-induced vasoactive reserve is blunted in SV
−
patients in whom the
combination of reduced preload and increased afterload, and in the
presence of blunted contractile response, impairs cardiac
perfor-mance. Moreover it is also conceivable that SV
−
patients exposed
to LDD,
fi
rst exhaust the preload reserve since the EDV at baseline is
higher than other groups. Consequently the higher EF, and
LV-SV, and the lower Ea and SVR in SV
−
as compared to SV+ are linked
to expense of the preload reserve already at rest more than to a less
impaired contractile reserve.
4.1. Limitations of the study
The small number of patients is the major limitation of the study.
However, cardiac function and morphology were assessed by MRI
that, allows accurate assessment of cardiac volumes and function
with high reproducibility, enabling smaller sample size to reach
sta-tistical signi
fi
cance due to the high quality of imaging and the 3-D
ap-proach
[9]
. Another limitation of the study is the absence of invasive
measurements of hemodynamic parameters not performed for
ethi-cal reasons, given the absence of cliniethi-cal indication. In particular the
invasive assessment of pressure/volume loop enables more
compre-hensive analysis of the interaction and relative contribution of the
afterload and preload properties on changes in SV and EF.
4.2. Conclusions
In conclusion, we provided novel evidence that in a signi
fi
cant
proportion of clinically stable patients with non-ischemic HF the
re-sponse of LV-SV to LDD is not only dependent on the presence of
con-tractile reserve, but can be also related to limited preload reserve, as
well as to increased afterload.
Acknowledgment
The authors of this manuscript have certi
fi
ed that they comply
with the Principles of Ethical Publishing in the International Journal
of Cardiology.
References
[1] Parsai C, Baltabaeva A, Anderson L, Chaparro M, Bijnens B, Sutherland GR. Low-dose dobutamine stress echo to quantify the degree of remodelling after cardiac resynchronization therapy. Eur Heart J 2009;30:950–8.
Fig. 3.Schematic representation of the results in the framework of the simplified pressure/volume model for non-invasive parameters. Average values of left ventricular end-diastolic and end-systolic volumes as well as of systolic and end-diastolic arterial pressures in the three groups studied, controls (C), DCM patients who increase stroke volume (SV+) and DCM patients who reduced stroke volume (SV−) during low dose dobutamine testing, are presented. Dotted thick line: resting; closed line: LDD.
[2] Jourdain P, Funck F, Fulla Y, et al. Myocardial contractile reserve under low doses of dobutamine and improvement of left ventricular ejection fraction with treat-ment by carvedilol. Eur J Heart Fail 2002;4:269–76.
[3] Mariotti E, Agostini A, Angelucci E, Lucarelli G, Sgarbi E, Picano E. Reduced left ventricular contractile reserve identified by low dose dobutamine echocardiogra-phy as an early marker of cardiac involvement in asymptomatic patients with thalassemia major. Echocardiography 1996;13:463–72.
[4] Picano E, Sicari R, Landi P, et al. Prognostic value of myocardial viability in medi-cally treated patients with global left ventricular dysfunction early after an acute uncomplicated myocardial infarction: a dobutamine stress echocardiographic study. Circulation 1998;98:1078–84.
[5] Kobayashi M, Izawa H, Cheng XW, et al. Dobutamine testing as a diagnostic tool for evaluation of myocardial contractile reserve in asymptomatic or mildly symp-tomatic patients with dilated cardiomyopathy. J Am Coll Cardiol Cardiovasc Imag-ing 2008;1:718–26.
[6] Uemura S, Sakurra H, Motoyasu M, et al. Thallium 201 SPECT and low dose dobuta-mine stress cine MRI for predicting functional recovery of regional myocardial contrac-tion in patients with myocardial infarccontrac-tion. J Cardiovasc Magn Reson 2004;6:697–707. [7] Skalidis EI, Parthenakis FI, Patrianakos AP, Hamilos MI, Vardas PE. Regional coro-naryflow and contractile reserve in patients with idiopathic dilated cardiomyop-athy. J Am Coll Cardiol 2004;44:2027–32.
[8] Kitaoka H, Takata J, Yabe T, Hitomi N, Furuno T, Doi YL. Low dose dobutamine stress echocardiography predicts the improvement of left ventricular systolic function in dilated cardiomyopathy. Heart 1999;81:523–7.
[9] Pennell DJ. Cardiovascular magnetic resonance. Circulation 2010;121:692–705. [10] Wellnhofer E, Olariu A, Klein C, et al. Magnetic resonance low dose dobutamine
test is superior to scar quantification for the prediction of functional recovery. Circulation 2004;109:2172–4.
[11] Scrutinio D, Napoli V, Passantino A, et al. Low dose dobutamine responsiveness in idiopathic dilated cardiomyopathy: relation to exercise capacity and clinical out-come. Eur Heart J 2000;21:927–34.
[12] Marcassa C, Galli M, Campini R, Marzullo P, Giannuzzi P. Differential systolic and diastolic effects of beta-adrenergic stimulation in patients with severe left ventricular dysfunction: a radionuclide ventriculographic study. J Nucl Cardiol 2003;10:46–50. [13] Otasevic P, Popovic ZB, Vasiljevic JD, et al. Head-to-head comparison of indices of left
ventricular contractile reserve by high dose dobutamine stress echocardiography in idiopathic dilated cardiomyopathy:five-year follow up. Heart 2006;92:1253–8. [14] Naqvi TZJ, Goel RK, Forrester JS, Siegel RJ. Myocardial contractile reserve on
dobu-tamine echocardiography predicts late spontaneous improvement in cardiac function in patients with recent onset idiopathic dilated cardiomyopathy. J Am Coll Cardiol 1999;34:1537–44.
[15] Owan TE, Hodge DO, Herges RM, Jacobsen SJ, Roger VL, Redfield MM. Trends in prevalence and outcome of heart failure with preserved ejection fraction. N Engl J Med 2006;355:251–9.
[16] Borlaug BA, Melenovsky V, Russell SD, et al. Impaired chronotropic and vasodila-tor reserves limit exercise capacity in patients with heart failure and a preserved ejection fraction. Circulation 2006;114:2138–47.
[17] Weil J, Eschenhagen T, Hirt S, et al. Preserved Frank–Starling mechanism in human end stage heart failure. Cardiovasc Res 1998;37:541–8.
[18] Sabbah HN, Imai M, Cowart D, Amato A, Carminati P, Gheorghiade M. Hemody-namic properties of a new-generation positive luso-inotropic agent for the acute treatment of advanced heart failure. Am J Cardiol 2007;99:41A–6A. [19] Cucchini F, Bolognesi R, Javernaro A, Zeppellini R, De Domenico R, Visioli O. Do
inotropic drugs always induce a positive lusitropic effect? A comparison between k-strophantidin and dobutamine in patients with coronary artery disease. Eur Heart J 1994;15:1666–72.
[20] Bombardini T, Nevola E, Giorgetti A, Landi P, Picano E, Neglia D. Prognostic value of left-ventricular and peripheral vascular performance in patients with dilated cardiomyopathy. J Nucl Cardiol 2008;15:353–62.
[21] Pingitore A, Gemignani A, Menicucci D, et al. Cardiovascular response to acute hypoxemia induced by prolonged breath holding in air. Am J Physiol Heart Circ Physiol 2008;294:H449–55.
[22] Aquaro GD, Masci P, Formisano F, et al. Usefulness of delayed enhancement by magnetic resonance imaging in hypertrophic cardiomyopathy as a marker of dis-ease and its severity. Am J Cardiol 2010;105:392–7.
[23] Di Bella G, Passino C, Aquaro GD, et al. Different substrates of non-sustained ven-tricular tachycardia in post-infarction patients with and without left venven-tricular dilatation. J Card Fail 2010;16:61–8.
[24] Fujita N, Chazouilleres AF, Hartiala JJ, et al. Quantification of mitral regurgitation by velocity-encoded cine nuclear magnetic resonance imaging. J Am Coll Cardiol 1994;23:951–8.
[25] Hundley WG, Li HF, Willard JE, et al. Magnetic resonance imaging assessment of the severity of mitral regurgitation. Comparison with invasive techniques. Circu-lation 1995;92:1151–8.
[26] Grosu A, Bombardini T, Senni M, Duino V, Gori M, Picano E. End-systolic pressur-e/volume relationship during dobutamine stress echo: a prognostically useful noninvasive index of left ventricular contractility. Eur Heart J 2005;26:2404–12. [27] Pingitore A, Galli E, Barison A, et al. Acute effects of triiodothyronine (T3)
replace-ment therapy in patients with chronic heart failure and low-T3 syndrome: a ran-domized, placebo-controlled study. J Clin Endocrinol Metab 2008;93:1351–8. [28] Maurer MS, Sackner-Bernstein JD, El-Khoury Rumbarger L, Yushak M, King DL,
Bukhoff D. Mechanisms underlying improvements in ejection fraction with carve-dilol in heart failure. Circ Heart Fail 2009:2189–96.
[29] Kawaji K, Codella NCF, Prince MR, et al. Automated segmentation of routine clin-ical cardiac magnetic resonance imaging for assessment of left ventricular diastol-ic dysfunction. Circ Cardiovasc Imaging 2009;2:476–88.
[30] Bodí V, Sanchis J, Cortés J, et al. Changes in left ventricularfilling pattern during dobutamine stress Doppler echocardiography. Eur J Echocardiogr 2000;1: 196–203.
[31] Passino C, Severino S, Poletti R, et al. Aerobic training decreases B-type natriuretic peptide expression and adrenergic activation in patients with heart failure. J Am Coll Cardiol 2006;47:1835–9.
[32] Pollock GD, Bowling N, Tuttle RR, Hayes JS. Effects of S-dobutamine on venous blood return and organ nutrient bloodflow. J Cardiovasc Pharmacol 1992;20: 742–9.
[33] Wang YS, Manyari DE, Scott-Douglas N, Smiseth OA, Smith ER, Tyberg JV. Splanch-nic–venous pressure–volume relation during experimental acute ischemic heart failure: differential effects of hydralazine, enalaprilat, and nitroglycerin. Circula-tion 1995;91:1205–12.
[34] Katz AM. Cardiomyopathy of overload: a major determinant of prognosis in con-gestive heart failure. N Engl J Med 1990;322:100–10.
[35] Lenihan DJ, Gerson MC, Dorn GW, Hoit BD, Walsh RA. Effects of changes in atrio-ventricular gradient and contractility on left atrio-ventricularfilling in human diastolic cardiac dysfunction. Am Heart J 1996;132:1179–88.
[36] Rabelo ER, Ruschel K, Moreno Jr H, et al. Venous endothelial function in heart fail-ure: comparison with healthy controls and effect of clinical compensation. Eur J Heart Fail 2008;10:758–64.
[37] Shepherd JT, Vanhoutte PM. Veins and their control. London: WB Saunders, Ltd; 1975.
[38] Birkley PF, Murray KD, Watson KM, Myerowitz PD, Leier CV. Dobutamine in-creases cardiac output of the total artificial heart. Implications for vascular contri-bution of inotropic agents to augmented ventricular function. Circulation 1991;84:1210–5.
[39] Zelis R, Flaim SF. Alterations in vasomotor tone in congestive heart failure. Prog Cardiovasc Dis 1982;24:437–59.
[40] Landmesser U, Spiekemann S, Dikalov S, Tatga H, Wilke R, Kohler C, et al. Vascular oxidative stress and endothelial dysfunction in patients with chronic heart fail-ure: role of xanthine-oxidase and extracellular superoxide dismutase. Circulation 2002;106:3073–8.
[41] Hemida MR, Brum JM, Estafanous FG, Khairallah PA, Shamloula M, El-Kasstawy B. Role of nitric oxide in systemic hemodynamic responses to dobutamine, epineph-rine, and amrinone. J Cardiothorac Vasc Anesth 1995;9:627–33.