Journal of Information Technology and Computer Science Volume 3, Number 1, 2018, pp. 67-76
Journal Homepage: www.jitecs.ub.ac.id
User Experience on E-Government Online Services: A
Case Study on The SIMPATIKA Service Application at
The Ministry of Religious Affairs of Indonesia
Bondan Sapta Prakoso1, Apol Pribadi Subriadi2
Departement of Information System, Information Technology and Communication Faculty, Sepuluh Nopember Institute of Technology,
60111 - Surabaya, East Java, Indonesia [email protected], [email protected]
Received 25 July 2018; accepted 01 August 2018
Abstract. User Experience (UX) is increasingly popular as a success factor in a
product, system or service in many sectors and industries, including government institutions. User Experience Questionnaire (UEQ) is one of the tools at measure UX. The purpose of this study is to measure UX on the SIIMPATIKA Service Application as one type of E-Government Online Services in the Ministry of Religious Affairs of Indonesia. There are 127 employees of Indonesian Ministry of Religious Affairs participating in this research as respondent. The results of this study found that the SIMPATIKA Service obtained a very positive UX score on attributes of attractiveness, perspicuity, efficiency, dependability, and stimulation. However, novelty has a score quite positive than other attributes. The results of this study can be provides additional ideas for further development of the application of SIMPATIKA service at the Indonesian Ministry of Religious Affairs.
.
1 Introduction
1.1 Background
and novelty) with twenty-six (26) items [3].
1.2 UX on E-Government Online Services
In recent decades, E-Government has received increasing attention as many governments recognize the importance of using information and communication technologies to provide efficient and transparent governance [4]. Electronic government (E-Government) is defined as the use of computers and the Internet by governments to convey information and services to citizens, businesses, and other stakeholders [5]. Various factors in the success of E-Government services are not measured only in terms of improving the utilization of services according to the citizen's perspective as users, but also influenced from the government's perspective as providers [6]. Although UX measurements have been used to assess a wide range of products or systems or services, there has not been much research evaluating online services at a government institution using UX measurements. Evaluating the user experience of E-Government Online Services can affect government performance in improving their public services to the public.
1.3 SIMPATIKA Service Application
In Indonesia, the central government encourages all government institutions and regional ministries in developing E-Government. One of the efforts undertaken by the Ministry of Religious Affairs of Indonesia is to build the Management Information System for Teachers and Education Personnel (SIMPATIKA Service) as one type of E-Government Online Services in the context of Government to Employee (G2E). SIMPATIKA's users are leaders, government employee as administrators, teachers and education personnel as end users within the Ministry of Religious Affairs of Indonesia [7]. The service is a type of Human Resource Information System designed specifically for users of teachers and education personnel in madrasah throughout Indonesia.
Application of SIMPATIKA Services based on internet technology (web) which is one type of E-Government Online Services in Indonesia. The SIMPATIKA application is enabled for teacher portfolio management, teacher incentive feasibility calculation, and monitoring of the performance of madrasah teachers across Indonesia. Each teacher is given an individual account to transact through the SIMPATIKA application. Each transaction that they do will be verified and validated by Ministry of Religious employees by online and tiered from district to provincial level [7]. The interaction between teachers and employees who served as validator and verifier is done online without having to meet face to face. It's a form of public administration whose interactions are entirely online.
Therefore, measuring the user experience on SIMPATIKA Services becomes very important. By measuring the user experience will provide additional ideas from the user's perception of the specific attributes of a system [8]. Researchers and technical personnel can formulate the need to develop and improve a system. The main focus is to choose the best design alternative to ensure that software development is in the right direction, and there is certainty in meeting the needs of users [9].
1.4 Research Objectives
Bondan Sapta Prakoso et al. , User Experience on E-Government ... 69
interpretation of the study as recommendations to improve the application of SIMPATIKA Services to government employees who operationalize it.
2 Literature Study
2.1 User Experience (UX) Overview
User Experience (UX) becomes a significant area in several industries along with increasing consumer demands on useful and usable technology needs. The UX concept incorporates features such as effectiveness, efficiency, learning ability with added other standards such as fun on usage, attraction, or aesthetics [3].
To design an effective product or system or service, it is important to ensure that the service or system or product can provide an adequate user experience for all user group targets. Certain user groups such as the elderly, the disabled, or people with low education will have different user experiences, so there is need for adjustments to their conditions. Therefore, managing the quality aspects of the user experience is critical [10].
User experience (UX) is increasingly important as a parameter of achieving the success of a product or system or service from various fields [1], including in government. It is also one of the areas of science that can help strengthen connections between providers with users or customers [11].
2.2 User Experience (UX) Studies
There are various user experience frameworks (UX) that are widely used in various studies such as Standardized User Experience Percentile Rank Questionnaire (SUPR-Q), Questionnaire for User Interaction Satisfaction (QUIS), Software Usability Measurement Inventory (SUMI), System Usability Scale (SUS) , and User Experience Questionnaire (UEQ). Each of these Frameworks has a goal of measuring UX as well as its advantages and disadvantages [1],
Most of the user experience frameworks require a license to use them. QUIS can be used to evaluate the general reusability of a system, but it is not free. QUIS is similar to SUS, but SUS is free and more convenient to use especially in assessing software reusability. QUIS uses a fairly difficult assessment method and gives relatively difficult results for in-depth analysis. However, QUIS has advantages in terms of availability of validation support compared to SUS because users can use the support to validate the results of the questionnaire more accurately [12].
Other measurement frameworks, SUPR-Q and SUMI are also useful tools for analyzing the results of questionnaires [1]. SUMI can measure various systems for its use [13], while SUPR-Q is more specific in assessing a website. SUPR-Q allows users to access datasets from various websites to compare scores between websites [14]. However, compared to these four tools in measuring user experience, User Experience Questionnaire (UEQ) can provide a deeper impression of user experience and more precise results with ease. In addition, the best reason is that UEQ can be used free of charge for free [15].
2.3 User Experience Questionnaire (UEQ)
User Experience Questionnaire (UEQ) is one of the tools to measure user experience (UX). UEQ enables faster UX measurements in an interactive product [16]. It is used in a variety of research contexts such as for the assessment of business software, development tools, social networking, websites and web services [11].
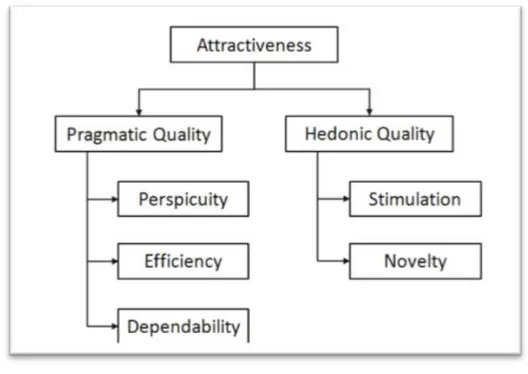
2016). Currently, it is available in many languages such as: Indonesian, Portuguese, German, English and more [15]. UEQ has six (6) variables: attractiveness, efficiency, perspectivity, dependency, stimulation, and novelty with twenty-six (26) items. Fig. 1 shows the UEQ scale structure.
Fig. 1. UEQ Scale Structure
In 2005, the original UEQ scale and its items are generated from the information investigation approach [17]. In the first step, two (2) large groups of reusable specialists through brainstorming sessions made up the possibility of 229 items. With the results of the analysis and assessment of the specialists, of the 229 items were reduced to eighty (80). Eighty (80) items are then used in several studies that focus on intuitive product properties such as software packages, mobile address books, or business systems and online collaborations. In general, 153 participant data was collected as an important information index. Six scales and 26 items representing UEQ were finally extracted using factor analysis from the collected data. Six (6) variables or UEQ scales are the result of checks on previous studies [3].
Furthermore, UEQ can give a full impression on the user experience, from the point of view of the prevalent use of the user's perspective. UEQ also serves as an explanatory tool for accurately translating the results [1]. It is useful to evaluate the quality of a software continuously during the development process [3]. Therefore, UEQ measurements can be made in any software update [11].
Bondan Sapta Prakoso et al. , User Experience on E-Government ... 71
briefly and can be completed by respondents within a few minutes.
3 Methodology
The research framework (see Fig. 2) starts with data collection, where the questionnaire is given to the respondents. Respondents from government officials assessed the SIMPATIKA application they had operated as part of their work assignment. After data is collected, than use the UEQ tool which is an excel file for entering data and automatically delivering results that are baseline for data analysis and interpretation.
Fig. 2. Research Frameworks
3.1 Questionnaire
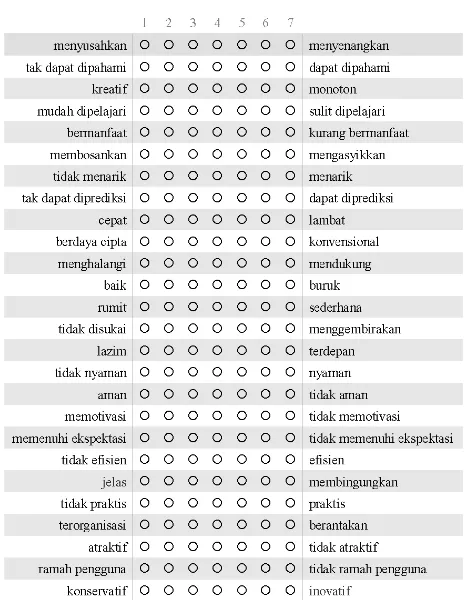
The questionnaire in this study has two main parts, namely: (1) User Profile and (2) UEQ for SIMPATIKA Service application. In this study, the Standard User Experience Questionnaire (UEQ) was not altered from the original, which means having all six (6) scales and twenty six (26) items [15]. Thus, the scale and items are used to measure attractiveness, perspicuity, efficiency, dependability, and stimulation, and product novelty (in this case the SIMPATIKA Service application). Fig. 3 shows the standard questionnaire instruments from UEQ in Bahasa Indonesia.
The pragmatic or objective-oriented qualities of a product on a scale are: (1) perspicuity, (2) efficiency, and (3) dependability. On the other hand, stimulation and novelty are the viewpoints of hedonic or non-goal oriented qualities (Hassenzahl, 2001) [18]. While attraction is a common fact or condition and assumes that the responsiveness of users related to scale for attractiveness is formed from their responses related to other scales [1]. The questionnaire items are arranged as semantic differentials which consist of several pairs of words with opposite meanings.
Collecting Data use UEQ ‘s Instrumen
Questionnaire
UEQ Tool
Data Analysis and Intepretation
Fig. 3. UEQ Instrument in Bahasa Indonesia
3.2 Sample Selection
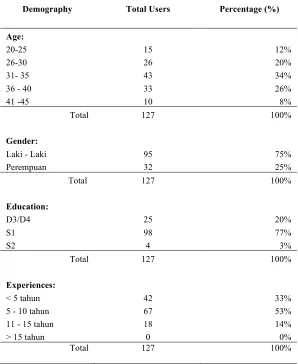
Table 1 shows the characteristics of the respondent profile. This study involved 127 respondents or participants who are employees who served as administrator of SIMPATIKA application in 34 Provincial Office of the Ministry of Religious Affairs of Indonesia. The respondents have been experienced for an average of 2 (two) years in using SIMPATIKA applications since 2015. In particular, the educational qualifications of the respondents are predominantly undergraduate.
3.3 Data Collection
Bondan Sapta Prakoso et al. , User Experience on E-Government ... 73
UEQ items are scaled from -3 to +3. Thus, the most negative response is -3, the neutral response is 0, and most of the positive responses are +3. The value that sets the user's positive feedback above +1 while the negative is below -1. The range of -2 to +2 is considered the scale meaning observed. If the average scale approaches +2, then it reflects a good impression of the respondent.
4 Result and Discussion
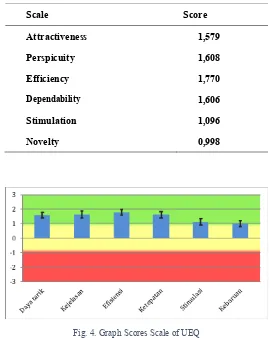
Using the UEQ tool and data from 127 respondents, Table 2 shows the results of the measurement values of the six attributes to evaluate the application of SIMPATIKA Services, as Fig. 4 shows the bar graph. The results illustrate that all attributes get more than 0.8 which means a positive evaluation. However, only the novelty attribute shows a lowest value than other attributes. This shows the user's judgment that the SIMPATIKA application is attractive, easy to understand, efficient, reliable, stimulates its use and brings newness.
Table 2. Scores Scale of UEQ
Scale Score
Attractiveness 1,579
Perspicuity 1,608
Efficiency 1,770
Dependability 1,606
Stimulation 1,096
Novelty 0,998
Fig. 4. Graph Scores Scale of UEQ
Bondan Sapta Prakoso et al. , User Experience on E-Government ... 75
5 Conclusions and Suggestions
From the results of the research, it is found that SIMPATIKA Service Application which is one of the types of E-Government Online Services has provided User Experience (UX) enough quality to its users, especially government employees as the correspondent of this research. However, the novelty aspect of the SIMPATIKA application gets a lower value than other aspects. This may be the case because government employees as users do not consider it a factor that influences them to have a good user experience. Or it is because they interpret that novelty scale becomes less important because SIMPATIKA Service application is mandatory. The results of this research can be used by the developer of SIMPATIKA application as a reference to produce a better design or as a contributing factor for the improvement of SIMPATIKA Service application in the future. To date, the results of this study indicate that the application of SIMPATIKA Service has a good value so it does not require further improvement.
6 Limitation and Future Work
This study also has limitations. Firstly, this study only considers one type of E-Government Online Services implemented in the Ministry of Religious Affairs of Indonesia. Government institutions generally have a wide range of E-Government Online Services that differ in function and purpose. Secondly, this investigator does not consider the variation characteristics of respondent profiles such as age, gender, education, and others as factors that may affect the user experience.
Future research may involve other statistical tools in understanding or analyzing the user experience. In addition it should also include other types of E-Government Online Services either in one institution or from other governmental institutions as objects in the study as a comparison. And involves several types of user groups as respondents taking into account the characteristics of these user groups.
References
1. Santoso, H.B., Isal, R.Y.K., Basaruddin, T., Sadira, L., and Schrepp, M. Research-in-progress: User experience evaluation of Student Centered E-Learning Environment for computer science program. User Science and Engineering (i-USEr), 2014 3rd
2. Rogers, Y., Sharp, H., and Preece, J. Interaction design: beyond human-computer interaction. (2011).
3. Schrepp, M., Olschner, S., & Schubert, U. User Experience Questionnaire (UEQ) Benchmark: UEQ-Evaluations in the area of business software. Usability Professionals 2013 (pp. 348-354). Stuttgart, Germany: German UPA eV (2013).
4. Wang, Y.S., Liao, Y.W. Assessing E-Government systems success: a validation of the government adoption: a systematic review. Journal of Information Technology and Computer Science (JTIIK). Vol. 4, December 4, p. 304-310 (2017).
8. Thayer, A., and Dugan, T.E. Achieving design enlightenment: Defining a new usear experience measurement framework. Professional Communication Conference. IPCC. IEEE International. IEEE (2009).
9. Vermeeren, A.P., Law, E.L.C., Roto, V., Obrist, M., Hoonhout, J., and Väänänen-Vainio-Mattila, K. "User experience evaluation methods: current state and development needs." Proceedings of the 6th Nordic Conference on Human-Computer Interaction: Extending Boundaries. ACM (2010).
10. Cota, M.P., Thomaschewski, J., Schrepp, M., and Gonçalves, R. Efficient measurement of the user experience. A Portuguese version. Procedia Computer Science 27: 491-498 (2014).
11. Rauschenberger, M., Hinderks, A., and Tomaschewsky, J. Benutzererlebnis Bei Unternehmenssoftware. Usability Professionals: 158-164. (2011).
12. QUIS. About the QUIS. [Online]. Available at http://lap.umd.edu/quis/, 2017. [Accessed: June 15, 2018].
13. Kirakowski, J. What is SUMI? [Online]. Available at http://sumi.uxp.ie/about/whatis.html, 2014. [Accessed: June 15, 2018].
14. SUPRQ. The Standardized User Experience Percentile Rank Questionnaire. [Online]. Available at http://www.suprq.com/, 2017. [Accessed: June 15, 2018].
15. UEQ-Online. User Experience Questionnaire (UEQ). [Online]. Available: http://www.ueq-online.org/, 2017. [Accessed: June 28, 2018].
16. Laugwitz, B., Held, T., and Schrepp, M. Construction and evaluation of a user experience questionnaire. Symposium of the Austrian HCI and Usability Engineering Group. Springer Berlin Heidelberg (2008).
17. Laugwitz, B.; Schrepp, M. & Held, T.: Konstruktion eines Fragebogens zur Messung der User Experience von Softwareprodukten. In: A.M. Heinecke & H. Paul (eds.): Mensch & Computer 2006 – Mensch und Computer im Strukturwandel, pp. 125–134. Oldenbourg Verlag, (2006).