123
Fisseha Mekuria
Ethiopia Enideg Nigussie
Waltenegus Dargie
Mutafugwa Edward
Tesfa Tegegne (Eds.)
Information
and Communication
Technology for Development
for Africa
First International Conference, ICT4DA 2017
Bahir Dar, Ethiopia, September 25–27, 2017
Proceedings
Lecture Notes of the Institute
for Computer Sciences, Social Informatics
and Telecommunications Engineering
244
Editorial Board
Ozgur Akan
Middle East Technical University, Ankara, Turkey Paolo Bellavista
University of Bologna, Bologna, Italy Jiannong Cao
Hong Kong Polytechnic University, Hong Kong, Hong Kong Geoffrey Coulson
Lancaster University, Lancaster, UK Falko Dressler
University of Erlangen, Erlangen, Germany Domenico Ferrari
UniversitàCattolica Piacenza, Piacenza, Italy Mario Gerla
UCLA, Los Angeles, USA Hisashi Kobayashi
Princeton University, Princeton, USA Sergio Palazzo
University of Catania, Catania, Italy Sartaj Sahni
University of Florida, Florida, USA Xuemin Sherman Shen
University of Waterloo, Waterloo, Canada Mircea Stan
University of Virginia, Charlottesville, USA Jia Xiaohua
City University of Hong Kong, Kowloon, Hong Kong Albert Y. Zomaya
Fisseha Mekuria
•Ethiopia Enideg Nigussie
Waltenegus Dargie
•Mutafugwa Edward
Tesfa Tegegne (Eds.)
Information
and Communication
Technology for Development
for Africa
First International Conference, ICT4DA 2017
Bahir Dar, Ethiopia, September 25
–
27, 2017
Proceedings
Editors Fisseha Mekuria
Council for Scientific and Industrial Research
Bahir Dar Institute of Technology Bahir Dar
Ethiopia
ISSN 1867-8211 ISSN 1867-822X (electronic) Lecture Notes of the Institute for Computer Sciences, Social Informatics and Telecommunications Engineering
ISBN 978-3-319-95152-2 ISBN 978-3-319-95153-9 (eBook) https://doi.org/10.1007/978-3-319-95153-9
Library of Congress Control Number: 2018947454
©ICST Institute for Computer Sciences, Social Informatics and Telecommunications Engineering 2018 This work is subject to copyright. All rights are reserved by the Publisher, whether the whole or part of the material is concerned, specifically the rights of translation, reprinting, reuse of illustrations, recitation, broadcasting, reproduction on microfilms or in any other physical way, and transmission or information storage and retrieval, electronic adaptation, computer software, or by similar or dissimilar methodology now known or hereafter developed.
The use of general descriptive names, registered names, trademarks, service marks, etc. in this publication does not imply, even in the absence of a specific statement, that such names are exempt from the relevant protective laws and regulations and therefore free for general use.
The publisher, the authors and the editors are safe to assume that the advice and information in this book are believed to be true and accurate at the date of publication. Neither the publisher nor the authors or the editors give a warranty, express or implied, with respect to the material contained herein or for any errors or omissions that may have been made. The publisher remains neutral with regard to jurisdictional claims in published maps and institutional affiliations.
Printed on acid-free paper
This Springer imprint is published by the registered company Springer International Publishing AG part of Springer Nature
Preface
We are delighted to introduce the proceedings of thefirst edition of the 2017 European Alliance for Innovation (EAI) International Conference on ICT for Development for Africa (ICT4DA). This conference brought together researchers, developers, and practitioners from around the world who are leveraging and developing ICT and systems for socioeconomic development for Africa. The theme of ICT4DA 2017 was “The Application of ICT for Socioeconomic Development for Africa.”The conference consisted of keynote speeches on current important topics in ICT and relevant research areas in ICT, technical papers on relevant topical areas accepted after a technical review process, and workshops addressing specific issues in ICT for development in Africa.
The technical program of ICT4DA 2017 consisted of 26 full papers in oral pre-sentation sessions during the main conference tracks. The conference tracks were: Track 1 –Natural Language Processing; Track 2 –Intelligent Systems; Track 3 – e-Service and Web Technologies; and Track 4 –Mobile Computing and Wireless Communications. Aside from the high-quality technical paper presentations, the technical program also featured four keynote speeches, one invited talk, and two technical workshops. The five keynote speakers were Prof. Mammo Muchie from Tshwane University of Technology, South Africa; Dr. Timnit Gebru from Microsoft Research, New York, USA,“The Importance of AI Research in Africa”; Prof. Michael Gasser Indiana University, Bloomington, Indiana, USA,“ICTs, the Linguistic Digital Divide, and the Democratization of Knowledge”; and Prof. Fisseha Mekuria from CSIR, South Africa“5G and Industry 4.0 for Emerging Economies.”The invited talk was presented by Ms. Alexandra Fraser from mLab, South Africa on“Mlab Innova-tions and CreaInnova-tions of Mobile ApplicaInnova-tions.” The two workshops organized were Affordable Broadband DSA and 5G and Innovations in ICT for Building the African Knowledge Economy. The DSA and 5G workshops aimed to address the question: “Will 5G support the efforts of emerging market countries for digital inclusion and participation in the Industry 4.0?”. The DSA and 5G workshops tried to address also how rural areas access broadband connectivity from unlicensed spectrum. The ICT innovation workshop aimed to address how an ICT-supported innovation system can be organized to plan, manage, and implement the transformation of the African economy and service sector.
technical program relevant to the conference theme. We are also grateful to the ICT4DA conference managers, Alzbeta Mackova and Dominika Belisová, for their support, and all the authors who submitted their papers contributing to the success of the ICT4DA 2017 conference and workshops.
We strongly believe that the ICT4DA 2017 conference provided a good forum for all staff and graduating researchers, developers, public and private industry players, and practitioners to discuss all the science and ICT technology trends and research aspects that are relevant to ICT for socioeconomic development. We also expect that future ICT4DA conferences will be as successful, stimulating, and make relevant contribu-tions to the local and global knowledge in ICT4D as presented in this volume.
June 2018 Fisseha Mekuria
Organization
Steering Committee
Imrich Chlamtac (Chair) Create-Net, Italy/EAI, Italy Tesfa Tegegne (Member) Bahir Dar University, Ethiopia Yoseph Maloche (Member) University of Trento, Italy
Organizing Committee
General Chair
Tesfa Tegegne Bahir Dar University, Ethiopia
General Co-chairs
Mesfin Belachew Ministry of Communication and Information Technology
Mesfin Kifle Addis Ababa University, Ethiopia Yoseph Maloche University of Trento, Italy
Technical Program Committee Chair
Fisseha Mekuria CSIR Council for Scientific and Industrial Research, South Africa
Technical Program Committee Co-chairs
Waltenegus Dargie Dresden University of Technology, Germany Mutafugwa Edward Aalto University, Finland
Dereje Hailemariam Addis Ababa Institute of Technology, Ethiopia Ethiopia Nigussie Turku University, Finland
Web Chairs
Getnet Mamo Bahir Dar University, Ethiopia Belisty Yalew
Publicity and Social Media Chair/Co-chairs
Fikreselam Garad Bahir Dar University, Ethiopia Haile Melkamu Bahir Dar University, Ethiopia
Workshops Chair
Publication Chair
Ephrem Teshale Bekele Addis Ababa Institute of Technology, Ethiopia
Panels Chair
Tibebe Beshah Addis Ababa University, Ethiopia
Tutorials Chair
Abiot Sinamo Mekelle University, Ethiopia
Demos Chair
Elefelious Getachew Bahir Dar University, Addis Ababa University, Ethiopia
Posters and PhD Track Chairs
Silesh Demissie KTH Royal Institute of Technology, Sweden Ahmdin Mohammed Wollo University, Ethiopia
Local Chair
Mesfin Belachew Ministry of Communication and Information Technology
Conference Manager
Alžbeta Macková EAI (European Alliance for Innovation)
Technical Program Committee
Gergely Alpár Open University and Radboud University Nijmegen, The Netherlands
Mikko Apiola
Yaregal Assabie Addis Ababa University, Ethiopia Rehema Baguma Makerere University, Uganda
Ephrem Teshale Bekele Addis Ababa University, AAiT, Ethiopia Waltenegus Dargie Dresden University of Technology, Germany Vincenzo De Florio VITO, Vlaamse Instelling voor Technologisch
Onderzoek, Belgium
Silesh Demissie KTH Royal Institute of Technology, Sweden Nelly Condori Fernandez VU University Amsterdam, The Netherlands Fikreselam Garad Bahir Dar University, Ethiopia
Samson H. Gegibo University of Bergen, Norway Elefelious Getachew Bahir Dar University, Ethiopia Fekade Getahun Addis Ababa University, Ethiopia
Liang Guang Huawei Technologies, China
Tom Heskes Radboud University, Nijmegen, The Netherlands Laura Hollink Centrum Wiskunde & Informatica, Amsterdam,
The Netherlands
Kyanda Swaib Kaawaase Makerere University, Uganda
Mesfin Kebede CSIR Council for Scientific & Industrial Research, South Africa
Mesfin Kifle Addis Ababa University, Ethiopia Khalid Latif Aalto University, Finland
Surafel Lemma Addis Ababa University, AAiT, Ethiopia
Fisseha Mekuria CSIR Council for Scientific and Industrial Research, South Africa
Drake Patrick Mirembe Uganda Technology and Management University, Uganda
Geoffrey Muchiri Muranga University College, Kenya Edward Mutafungwa Aalto University, Finland
Ethiopia Nigussie University of Turku, Finland Walter Omona Makerere University, Uganda
Gaberilla Pasi Universitàdegli Studi di Milano, Italy
Erik Poll Radboud University Nijmegen, The Netherlands Peteri Sainio University of Turku, Finland
Abiot Sinamo Mekelle University, Ethiopia
Ville Taajamaa University of Turku, Finland and Stanford University, USA
Woubishet Z. Taffese Aalto University, Finland
Dereje Teferi Addis Ababa University, Ethiopia Nanda Kumar
Thanigaivelan
University of Turku, Finland
Theo van der Weide Radboud University, Nijmegen, The Netherlands Dereje Yohannes Adama Science and Technology University, Ethiopia
Contents
ICT4DA Main Track
Is Addis Ababa Wi-Fi Ready? . . . 3 Asrat Mulatu Beyene, Jordi Casademont Serra,
and Yalemzewd Negash Shiferaw
A Finite-State Morphological Analyzer for Wolaytta . . . 14 Tewodros A. Gebreselassie, Jonathan N. Washington,
Michael Gasser, and Baye Yimam
Malaria Detection and Classification Using Machine Learning Algorithms . . . 24 Yaecob Girmay Gezahegn, Yirga Hagos G. Medhin,
Eneyew Adugna Etsub, and Gereziher Niguse G. Tekele
Intelligent Transport System in Ethiopia: Status and the Way Forward. . . 34 Tezazu Bireda
Survey on Indoor Positioning Techniques and Systems . . . 46 Habib Mohammed Hussien, Yalemzewed Negash Shiferaw,
and Negassa Basha Teshale
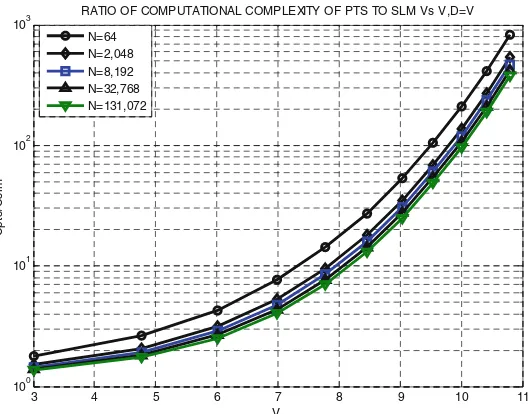
Comparative Study of the Performances of Peak-to-Average Power Ratio (PAPR) Reduction Techniques for Orthogonal Frequency Division
Multiplexing (OFDM) Signals . . . 56 Workineh Gebeye Abera
A Distributed Multi-hop Clustering Algorithm for Infrastructure-Less
Vehicular Ad-Hoc Networks. . . 68 Ahmed Alioua, Sidi-Mohammed Senouci, Samira Moussaoui,
Esubalew Alemneh, Med-Ahmed-Amine Derradji, and Fella Benaziza
Radar Human Gait Signal Analysis Using Short Time Fourier Transform. . . . 82 Negasa B. Teshale, Dinkisa A. Bulti, and Habib M. Hussien
Classification of Mammograms Using Convolutional Neural Network
Based Feature Extraction . . . 89 Taye Girma Debelee, Mohammadreza Amirian, Achim Ibenthal,
Günther Palm, and Friedhelm Schwenker
Exploring the Use of Global Positioning System (GPS) for Identifying
Developing Knowledge Based Recommender System for Tourist Attraction
Area Selection in Ethiopia: A Case Based Reasoning Approach . . . 112 Tamir Anteneh Alemu, Alemu Kumilachew Tegegne,
and Adane Nega Tarekegn
A Corpus for Amharic-English Speech Translation:
The Case of Tourism Domain. . . 129 Michael Melese Woldeyohannis, Laurent Besacier,
and Million Meshesha
Experimenting Statistical Machine Translation for Ethiopic Semitic
Languages: The Case of Amharic-Tigrigna . . . 140 Michael Melese Woldeyohannis and Million Meshesha
Synchronized Video and Motion Capture Dataset and Quantitative Evaluation of Vision Based Skeleton Tracking Methods
for Robotic Action Imitation. . . 150 Selamawet Atnafu and Conci Nicola
Ethiopian Public Universities’Web Site Usability . . . 159 Worku Kelemework and Abinew Ali
Comparative Analysis of Moving Object Detection Algorithms . . . 172 Habib Mohammed Hussien, Sultan Feisso Meko,
and Negassa Basha Teshale
Multiple Antenna (MA) for Cognitive Radio Based Wireless Mesh
Networks (CRWMNs): Spectrum Sensing (SS) . . . 182 Mulugeta Atlabachew, Jordi Casademont, and Yalemzewd Negash
The Design and the Use of Knowledge Management System
as a Boundary Object . . . 193 Dejen Alemu, Murray E. Jennex, and Temtem Assefa
Autonomous Flyer Delivery Robot . . . 203 Tesfaye Wakessa Gussu and Chyi-Yeu Lin
Minimal Dependency Translation: A Framework for Computer-Assisted
Translation for Under-Resourced Languages . . . 209 Michael Gasser
Massive MIMO for 5G Cellular Networks: Potential Benefits
and Challenges . . . 219 Bekele Mulu Zerihun and Yihenew Wondie
Mathematical Modeling and Dynamic Simulation of Gantry
Robot Using Bond Graph. . . 228 Tadele Belay Tuli
Web Usage Characterization for System Performance Improvement. . . 238 Alehegn Kindie, Adane Mamuye, and Biniyam Tilahun
Critical Success Factors and Key Performance Indicators for e-Government
Projects- Towards Untethered Public Services: The Case of Ethiopia . . . 246 Dessalegn Mequanint Yehuala
Intelligent License Plate Recognition . . . 259 Yaecob Girmay Gezahegn, Misgina Tsighe Hagos,
Dereje H. Mariam W. Gebreal, Zeferu Teklay Gebreslassie, G. agziabher Ngusse G. Tekle, and Yakob Kiros T. Haimanot
Comparison of Moving Object Segmentation Techniques . . . 269 Yaecob Girmay Gezahegn, Abrham Kahsay Gebreselasie,
Dereje H. Mariam W. Gebreal, and Maarig Aregawi Hagos
ICT4DA Workshops
Towards Group Fuzzy Analytical Hierarchy Process . . . 283 George W. Musumba and Ruth D. Wario
Overview of Spectrum Sharing Models: A Path Towards
5G Spectrum Toolboxes. . . 308 Gcina Dludla, Luzango Mfupe, and Fisseha Mekuria
Towards Affordable Broadband Communication:
A Quantitative Assessment of TV White Space in Tanzania . . . 320 Jabhera Matogoro, Nerey H. Mvungi, Anatory Justinian,
Abhay Karandikar, and Jaspreet Singh
An Evaluation of the Performance of the University of Limpopo
TVWS Trial Network . . . 331 Bongani Fenzile Mkhabela and Mthulisi Velempini
ICT4DA Demos & Exhibits
Review on Cognitive Radio Technology for Machine
to Machine Communication . . . 347 Negasa B. Teshale and Habib M. Hussien
Is Addis Ababa Wi-Fi Ready?
Asrat Mulatu Beyene1(&), Jordi Casademont Serra2, and Yalemzewd Negash Shiferaw3
1
Department of Electrical and Computer Engineering, College of Electrical and Mechanical Engineering,
Addis Ababa Science and Technology University, Addis Ababa, Ethiopia [email protected]
2
Universitat Politècnica de Catalunya, Barcelona, Spain [email protected] 3
Department of Electrical and Computer Engineering, Addis Ababa University, Addis Ababa, Ethiopia
Abstract. As we are heading towards future ubiquitous networks, hetero-geneity is one key aspect we need to deal with. Interworking between Cellular and WLAN holds a major part in these future networks. Among other potential benefits it gives the opportunity to offload traffic from the former to the latter. To successfully accomplish that, we need to thoroughly study the availability, capacity and performance of both networks. To quantify the possibility of mobile traffic offloading, this work-in-progress presents the availability, capacity and performance investigation of Wi-Fi Access Points in the city of Addis Ababa. Analysis of the scanned data, collected by travelling through the highly populated business areas of the city, reveals the potential of existing Wi-Fi coverage and capability for many application domains.
Keywords: Wireless networks
Performance evaluation
Urban areas Heterogeneous networks
1 Introduction
Currently and for the foreseeable future, there is an increasing pattern of mobile connectivity penetration [1], mobile devices usage and ownership [2], and computing capability of mobile devices like smart phones, laptops and tablets [3]. All these facts have an impact on the demand for a greater bandwidth and better ubiquitous con-nectivity from the existing mobile infrastructures, primarily, from cellular telecom-munication networks. The increased usage and acceptance of existing and new bandwidth hungry services exacerbates the already-saturated cellular networks.
Operators, academia and the industry are working on many solutions to alleviate this global problem [1]. Among these is the idea of offloading cellular traffic to Wireless Local Area Networks (WLANs). It is attractive, mainly, because WLANs provide a cheaper, immediate and a better short-range solution for the problem [4,5]. Nowadays, Wi-Fi Access Points (APs) are being deployed in urban areas, primarily, to extend the wired network Internet access or to avail intranet services. As the price of ©ICST Institute for Computer Sciences, Social Informatics and Telecommunications Engineering 2018 F. Mekuria et al. (Eds.): ICT4DA 2017, LNICST 244, pp. 3–13, 2018.
Wi-Fi devices is getting cheaper, the technical expertise to install them becomes trivial and, more importantly, since WLAN is based on the unlicensed ISM (Industrial, Scientific and Medical) band their availability is expected to sky-rocket in urban and semi-urban areas [1–3].
Therefore, exploiting these Wi-Fi hotspots for the purpose of redirecting the traffic primarily intended for the cellular infrastructure is one of the main research areas in the trade. In this work we made Wi-Fi AP scanning of Addis Ababa metropolis, the capital city of Ethiopia, using mobile devices by making many drives and walks around the main streets of the city. This is primarily done to see the potential of Addis Ababa city to use mobile offloading applications exploiting the already deployed Wi-Fi APs. We analyzed the data collected in terms of availability, capability and performance to see the possibility and potential of offloading some of the traffic intended for the cellular infrastructure. This paper is organized as follows. Section2briefly summarizes related works. Section3shades some light on how the real-time Wi-Fi traffic data is collected. The availability and capacity analysis of the collected data is presented in Sects.4and5, respectively. Finally, Sect.6enumerates the contributions while Sect.7made conclu-sions and points future directions.
2 Related Works
Many studies are being made on IEEE 802.11 technologies as they are one of the corner stones in ubiquitous future networks having various potential application domains. Many of these studies involve in the investigation of the availability and performance of public Wi-Fi APs deployed in urban and semi-urban environments.
In [6] public Wi-Fi hotspots coverage of Paris, France, was mapped by making several bus routes for the purpose of mobile data offloading. They found that, on average, there are 3.9 APs/km2of public Wi-Fi hotspots on areas that have at least one AP. Moreover, they obtained 27.7% of the APs being open, there is at least one AP with in every 52 m, and −80.1 dBm as the average RSSI during reception. They concluded that up to 30% of mobile traffic can be offloaded using the exiting Wi-Fi APs. Another study for similar purpose was made in [7] at Seoul, South Korea. They found 20.6% of spatial coverage and 80% of temporal coverage concluding that the already deployed Wi-Fi APs can offload up to 65% of the mobile data traffic and can save 55% of battery power. This is achieved mainly due to the reduced transmission time via the use of Wi-Fi APs. Yet another similar undertaking was made by Bala-subramianian et al. in [8] where they found out on average, Wi-Fi and 3G are available around 87% and 11% of the time across three US cities. They also studied the com-parative usage of Wi-Fi and 3G across certain geographic areas of the cities which gave an insight of places where Wi-Fi is under- and over- utilized with respect to 3G.
−70 dBm or better signal strength during reception, around 63% of the APs use channels 1, 6 and 11 and less than 20% of the APs are open for association. They highlighted that the existing Wi-Fi coverage can be used for many applications guar-antying the minimum QoS requirements. Another interesting study was made in [11] on public Wi-Fi networks deployed by Google Inc. in Mountain View, California, USA. Most locations in the city can reach at most 4 APs at any given time. Even at late night, 80% of the APs are identified being used by at least one client. They also investigated that usage depends and varies with user traffic type, mobility pattern, and usage behavior. In our study, the availability and capacity analysis of Wi-Fi APs is made on data collected by travelling around the city of Addis Ababa. We focused only on the major public areas and streets to see the extent of coverage and the possible usage of the exiting hotspots for various applications, especially for mobile traffic offloading.
3 Methodology
In this work, commercial-grade 51 mobile devices that are based on both Android and iOS systems on top of which freely available network scanning and monitoring apps are used to collect Wi-Fi AP data for three consecutive months. It’s focused mainly on highly populated business areas, like market places and city centers, where more people are engaged in their daily work, streets and places like bus and taxi stations where considerable all-day traffic is present. The scanning of the city for Wi-Fi APs was made through war-driving by walking and driving through the city covering approximately 157 km of distance and quarter of the area of the whole city, which is covering 527 km2.
Totally, more than 15000 individual Wi-Fi APs where scanned in this process. For each Wi-Fi AP the scanned data contains, among others, the time stamp, MAC address, RSSI in dBm, location information, AP security configuration, frequency configura-tions, TCP and UDP uplink and downlink throughput for a given traffic load, and RTT values. Mobiperf, GMON and OpenSignal third-party apps are used to collect real-time traffic data. More specifically, default configuration of the apps is used except varying packet sizes and server addresses, whenever possible. The scanned data has three differentfile formats, .csv,.kml and .txt which are analyzed using spreadsheet appli-cations, MATLAB and GoogleEarth.
4 Wi-Fi AP Availability
To see how much the city of Addis Ababa is populated with Wi-Fi APs, coverage heat maps for specific locations are generated from the .kml data set. In addition, AP densities, distance and time between APs as the mobile user travels along the streets of the city, are calculated from the.csvdata.
4.1 AP Density and Coverage Heat Maps
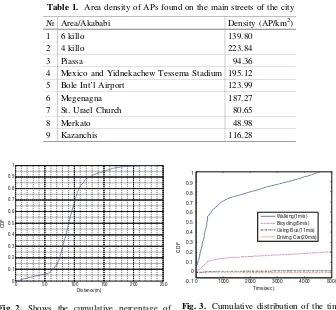
The density of Wi-Fi APs in the main streets of the city is analyzed based on the number of APs within a given area. This is calculated by counting the number of APs within 1 km1 km area making the scanning mobile device at the center as it moves along the streets of the city. Figure1 and Table1 summarize the result. Figure1 shows, as a sample, some areas of the city that are highly populated during working hours, specifi-cally, between 8:00 AM to 6:30 PM. Each dot represents the geographic position where an AP signal is received with the maximum power (RSSI) along the route of travelling. Each AP can be seen from some meters before this location is reached and to some meters afterwards. This coverage area, among others, depends on the distance from the real position of the AP to the point where its signal was detected by the scanning devices.
An attempt has been made tofind out the number of APs available on a given area. The measurement is done by simply counting each and every Wi-Fi AP enclosed within a given perimeter. The result is populated in Table2. It shows that4 Killo Area(Fig.1a) is highly populated with 223.84 APs per km2whereas;Merkato Area(Fig.1b) has less number of APs per km2which is 48. Having these extremes, the number of APs per km2 is found to be around 133, on average, in the main streets of the city.
The average linear density of APs on the major streets of the city has been found to be around 50 APs per km. That means someone moving along the major streets of the city can get around one AP within every 20 m, on average. In addition, the path from Bole Int’l AirporttoMesqel Squarehas, relatively, the highest APs/km which is 104.89 whereas; the path fromPiassatoAutobustera via Merkatois less populated with only 44.67 APs/km. To have a glimpse of the above results and discussions, Fig.1depicts the heat maps of the available Wi-Fi APs on the major areas (avenues and streets) of Addis Ababa.
a) 4 Killo Area b) Piassa & Merkato Area c) Bole Int’l Airport Area
d) Megenagna Area e) Yidnekachew Tessema Stadium & Mexico Area
f) St. Urael & Kazanchis Area
Fig. 1. Heat maps of APs on the major streets/areas of Addis Ababa. On the graphics, APs are colored based on their security configurations, inRed,YellowandGreenpins signifyingSecure (either WPA or WPA2),Less Secure(WEP), andOpen(no security), respectively. (Colorfigure online)
4.2 Distances Between APs
Greatest Circle Distance (GCD) is the shortest distance between two points over spherical surfaces like that of our planet. Based on the location data collected the Haversine Formula [6] is used to generate the distance between the street locations with maximum RSSI of consecutive Wi-Fi APs as shown in Fig.2. In the same figure, around 10% and 80% of the APs are found within, approximately, 55 and 100 m of the mobile user, respectively. Moreover, it is observed that the deployment of Wi-Fi APs has no regular pattern or topology in the city.
4.3 Time Between APs
Extending the previous analysis, it’s tried to generate the minimum amount of time required for a mobile user to get another Wi-Fi AP as it moves in city at various speeds. Figure3shows how soon a mobile user, who is either walking or using a bicycle or a bus or driving a car, gets a Wi-Fi AP to get associated with. The graph clearly shows
Table 1. Area density of APs found on the main streets of the city
№ Area/Akababi Density (AP/km2)
1 6 killo 139.80
2 4 killo 223.84
3 Piassa 94.36
4 Mexico and Yidnekachew Tessema Stadium 195.12
5 Bole Int’l Airport 123.99
6 Megenagna 187.27
7 St. Urael Church 80.65
8 Merkato 48.98
0 1000 2000 3000 4000 5000 Time(sec)
Walking(1m/s) Bicycling(5m/s) Using Bus(11m/s) Driving Car(20m/s)
Fig. 3. Cumulative distribution of the time between Wi-Fi access points for various user speeds.
Fig. 2. Shows the cumulative percentage of distances between locations where the RSSI of scanned APs is maximum.
the slowest mobile user, who is walking around, on average, at one meter per second gets the next access point within 20 s, on average. This doesn’t tell about the real performance of the AP but confirms the availability of another AP to get connected with. As expected the faster the mobile user moves the lesser the time getting another AP. This effect of mobile user speed on the performance of the Wi-Fi AP should be investigated further to understand its effect on the QoS requirements of various services.
5 Wi-Fi AP Capacity
Based on the collected.csvand .txtdata, further analysis was made to determine the capacity of the-already-deployed Wi-Fi APs in the city. To this end, the security configuration, the channel/frequency used, signal strength, the number of APs within a given distance from the mobile user, TCP and UDP throughput analysis, and round trip delay analysis are made and the results are presented hereafter.
5.1 Security Configurations
The security configuration of Wi-Fi APs determines their availability. In our dataset, more than half of the APs are identified as open for anyone to associate as long as the user is within the coverage area.
As presented in Fig.4 around 40% of the APs are configured with WPA (Wi-Fi Protected Access) and WPA2 (Wi-Fi Protected Access 2) with varied combinations of the available encryption, authentication and other security algorithms. From this, half of them are configured with the strictest security configuration in the trade–802.11i or WPA2. And, only 1 in around 10 APs are found to be configured with WEP (Wired Equivalent Privacy), the old and weakest security protocol in the realm of WLANs.
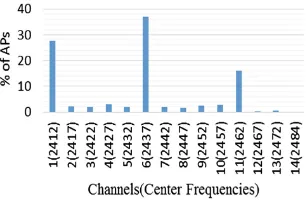
5.2 Channel/Frequency Usage
Figure5 shows the channels together with the center frequencies assigned to the scanned Wi-Fi APs. All the APs are found to be 802.11borgtypes using the 2.4 GHz frequency band. In this standard, each channel is 22 MHz wide and channels 1, 6 and 11 are non-overlapping with 25 MHz separation between the respective center fre-quencies. Basically, this is what makes them the ideal choice by networking profes-sionals during deployment of WLANs.
That is exactly what can be observed in Fig.5. Channel 1, 6 and 11 are used approximately in the 27%, 37% and 16% respectively, totaling around 80% of the APs. That leaves only around 20% for the rest of the channels. The use of these three channels not only minimizes the inter-channel interference within a WLAN but also the interference between neighboring WLANs. However, a better way of assigning channels for wireless nodes deserves a critical analysis of channel assignments and the resulting interferences [12].
5.3 Signal Strength
When talking about signal strength one need to differentiate between the transmitter signal transmission power and the received signal strength. As a standard, the trans-mission signal power of Wi-Fi equipment, specifically, for 802.11b/g ranges from 1 mW (0 dBm) to 100 mW (20 dBm) [13]. The standard also specifies that the sen-sitivity will be at least −94, −89 and −71 dBm for data rates of 1, 6 and 54 Mbps, respectively [13]. The last values are only for 802.11 g.
In this work, as depicted in Fig.6, the RSSI (Received Signal Strength Indicator) ranges from−26 dBm (2.5 mW) to−94 dBm (0.398 nW). Moreover, around 40% of the APs have RSSI value greater than −78 dBm. This value is above the minimum required to achieve full data rate for 802.11b which is 11 Mbps. The same RSSI value can be used to achieve 12 Mbps data rate for 802.11 g based networks. From the overall APs, only 754 APs have RSSI values lower than−90 dBm, which suggests that all APs can perform above the minimum data rate.
Open WEP WPA WPA2
Fig. 4. Distribution of AP security
configurations Fig. 5. Channels and frequencies used by the APs
20 30 40 50 60 70 80 90 100
Fig. 6. Received signal strength of the Wi-Fi APs.
5.4 Number of APs Within a Given Distance
Here an attempt has been made to estimate how many APs are deployed in the vicinity of certain locations. The locations presented in Table2 and two typical working dis-tances, 40 m and 100 m, were chosen. Using a free space outdoor propagation model, for the sake of simplicity, and considering a transmission power of 100 mW at 40 m the received power is−56 dBm, and at 100 m it is −73 dBm. On this basis, Table2 presents how many APs are received with RSSI equal or higher than −56 dBm and −70 dBm at the chosen locations. It also presents the average RSSI of the APs that are at 40 m and 100 m or closer.
Although, the aforementioned propagation model were used, further analysis should be done to obtain more precise results taking into account the fact that the variability of the signal strengths with distance depends on many factors specific to the environment where the APs are deployed and many parameters of the mobile user.
As it is presented in the same table, within 40 m of the mobile device, the received power from Wi-Fi APs is much below the minimum RSSI required to achieve the maximum data rate. Moreover, even at 100 m radius of the mobile device the signal strengths of deployed APs can be used for many services and application domains.
5.5 TCP and UDP Throughput Analysis
Here, TCP and UDP throughput analysis is presented where the data is generated at selected spots of the city by initiating the data traffic from the mobile device to the servers located in Gaza and Libya which are automatically selected by the traffic data Table 2. Number of Wi-Fi APs within 40 and 100 m of the mobile device with their corresponding average signal strength values.
Main city area 40 m Avg. RSSI (−dBm) 100 m Avg. RSSI (−dBm)
4Killo (AAU Campus) 16 −58 48 −78
6Killo (AAU Main Campus) 14 −56 42 −78
Piassa (Cinema Ethiopia) 16 −62 52 −77
National Theatre (In front of) 19 −68 48 −76
Y.T. Stadium (Taxi Tera) 21 −70 51 −72
Kazanchis (Taxi Tera) 20 −69 43 −73
Megenagna (Kaldis Cafe) 22 −70 45 −75
Bole Int’l Airport (Bole Mini) 21 −70 52 −74
Merkato (city bus station) 9 −70 21 −80
22 Mazoria (Golagul Bldg) 16 −58 57 −72
Le Gare (Legehar) 14 −56 47 −71
Saris Abo (@ EBG) 16 −60 49 −75
Averages 17 −63.9 46.3 −75.1
gathering app. data traffic of various bytes were generated for those APs that are openly available. The TCP and UDP throughput performances are measured for each traffic load, from smaller to larger values, repeating averagely 100 times for each location. This is done separately for both uploading and downloading scenarios. Figure7 pre-sents the plot of the average TCP and UDP upload and download values for each traffic load. The average TCP and UDP throughput performances obtained are, approxi-mately, 5.7 Mbps and 6.4 Mbps for download and 7.9 Mbps and 8.8 Mbps for upload, respectively. In both cases the results show that the downstreamflow of data shows more variability and, on average, lower performance when compared to the upstream flows. That could be due the uploading is mainly depends on the APs device perfor-mances while the downloading is depends on the mobile devices perforperfor-mances.
5.6 Round Trip Delay and Loss Analysis
Using the MobiPerf app the RTT delay were measured for three most common servers on the Internet; YouTube, Facebook and Google. Ping is initiated with 100 packets load for each of the three servers repeating 10 times almost every second. This is done for 12 selected areas of the city. As shown in Fig.8, the overall maximum and min-imum round trip delay times are found to be 257.2 and 105.3 ms, respectively. The average is 224.0, 197.6 and 161.5 ms for YouTube, Facebook and Google, respec-tively. It’s also found that there is no packet loss in all the ping attempts. These results show that the Wi-Fi APs are reliable enough even for services like voice communi-cation which is very sensitive for delay. It is good to remind the reader that mouth-to-ear delay of conversational voice ranges from 20 to 200 ms and for VoIP is between 20 to 150 ms.
0 100 200 300 400 500 600
2 4 6 8 10 12 14 16
Traffic Load (KBytes)
Measured Throughput (Mbps)
UDP Download UDP Upload TCP Download TCP Upload
Fig. 7. TCP and UDP performances
6 Contributions
Based on the data gathered, the analysis made and the discussions presented lots of valuable and unique contributions can be harvested from this geographically pioneering, and yet preliminary, work.
First, users can delay the use of costly services using the slower cellular infras-tructure for delay tolerant and non-urgent tasks like email and text messages.Second, AP owners may come to know the resource they owe and its economic and social potential prompting for utilizing it effectively and efficiently. Third, retailers and importers can pursue procuring new and improved Wi-Fi APs, like 5 GHz based ones, as long as they market based on its better performance and attractive features.Fourth, operators can contemplate on exploiting Wi-Fi APs systematically.Fifth, researchers and technologists, based on the results obtained and future works proposed, may further study the existing wireless infrastructures and pin point possible performance bottlenecks, potential solutions, and adapt technologies suitable for local situations. Last but not least, it is possible that the insights obtained in this work-in-progress, and future supplementary, works may have some inputs for local policy improvements and business opportunities.
7 Conclusions and Future Works
This is a work-in-progress investigation towards a fully integrated and hybrid inter-working architecture for mobile traffic offloading. The commercial-grade mobile devices and the performance of the network monitoring apps employed to collect data introduced some errors and skewness of the data which are taken care of right away. Despite all, the results obtained in this work can be taken as lower bound indicators. Therefore, it can be concluded that the major spots of the city that are highly populated during the working hours are already covered with Wi-Fi APs that can be exploited for many purposes like content sharing, advertising, accident reporting, and mobile data traffic offloading, among others.
In the future, it’s planned to continue this investigation in more detail and speci-ficity as the output can be used for operators, policy makers, and business organiza-tions, and researchers, alike. In addition, performance evaluation of a mobile user with different speeds can be extended for vehicular applications and services. It might be required to perform a thorough performance evaluation with time-of-day analysis to further understand the behavior and capability of Wi-Fi APs. The mobility and access behavior is also another dimension that can be pursued.
References
1. Wood, R.: Wireless network traffic worldwide: forecasts and analysis 2013–2018. Research Forecast Report, Analysys Mason Ltd., London, October 2013
2. Gabriel, C.: Wireless broadband alliance industry report 2013: global trends in public Wi-Fi. Technical report, Marvedis Rethink—Wireless Broadband Alliance, Singapore, November 2013
3. Jung, H.: Cisco visual networking index: global mobile data traffic forecast update 2010– 2015. Technical report, Cisco Systems Inc., September 2011
4. Gass, R., Diot, C.: An experimental performance comparison of 3G and Wi-Fi. In: Krishnamurthy, A., Plattner, B. (eds.) PAM 2010. LNCS, vol. 6032, pp. 71–80. Springer, Heidelberg (2010).https://doi.org/10.1007/978-3-642-12334-4_8
5. Sommers, J., Barford, P.: Cell vs. WiFi: on the performance of metro area mobile connections. In: Proceedings of the 2012 Internet Measurement Conference, IMC 2012, Boston, Massachusetts, USA, 14–16 November 2012, pp. 301–314. ACM, New York (2012)
6. Mota, V.F.S., Macedo, D.F., Ghamri-Doudane, Y., Nogueira, J.M.S.: On the feasibility of WiFi offloading in urban areas: the Paris case study. In: IFIP Wireless Days, 2013 IFIP, Valencia, Spain, 13–15 November 2013.https://doi.org/10.1109/wd.2013.6686530 7. Lee, K., Lee, J., Yi, Y.: Mobile data offloading: how much can WiFi deliver? IEEE/ACM
Trans. Netw.21(2), 536–550 (2010)
8. Balasubramanian, A., Mahajan, R., Venkataramani, A.: Augmenting mobile 3G using WiFi. In: Proceedings of 8th International Conference on Mobile systems, applications, and services, MobiSys 2010, San Francisco, California, USA, 15–18 June 2010, pp. 209–222. ACM, New York (2010)
9. Jones, K., Liu, L.: What where Wi: an analysis of millions of Wi-Fi access points. IEEE International Conference on Portable Information Devices, pp. 1–4 (2007)
10. Berezin, M.E., Rousseau, F., Duda, A.: Citywide mobile internet access using dense urban WiFi coverage. In: Proceedings of the 1st Workshop on Urban Networking, UrbaNE 2012, Nice, France, 10 December 2012, pp. 31–36. ACM, New York (2012)
11. Afanasyev, M., Chen, T., Voelker, G.M., Snoeren, A.C.: Analysis of a mixed-use urban WiFi network: when metropolitan becomes neapolitan. In: Proceedings of the 8th ACM SIGCOMM Conference on Internet Measurement, IMC 2008, Vouliagmeni, Greece, 20–22 October 2008, pp. 85–98. ACM, New York (2008)
12. Lopez-Aguilera, E., Heusse, M., Rousseau, F., Duda, A., Casademont, J.: Performance of wireless LAN access methods in multicell environments. IEEE Global Telecommunications Conference, GLOBECOM 2006, San Francisco, CA, USA, 27 November –1 December 2006.https://doi.org/10.1109/glocom.2006.782
13. Part 11: Wireless LAN Medium Access Control (MAC) and Physical Layer (PHY) Spec-ifications. IEEE Std 802.11–2012, March 2012
A Finite-State Morphological Analyzer
for Wolaytta
Tewodros A. Gebreselassie1(&), Jonathan N. Washington2, Michael Gasser3, and Baye Yimam1
1 Addis Ababa University, Addis Ababa, Ethiopia [email protected] 2
Swarthmore College, Swarthmore, USA [email protected]
3
Indiana University, Bloomington, USA [email protected]
Abstract. This paper presents the development of a free/open-source fi nite-state morphological transducer for Wolaytta, an Omotic language of Ethiopia, using the Helsinki Finite-State Transducer toolkit (HFST). Developing a full-fledged morphological analysis tool for an under-resourced language like Wolaytta is an important step towards developing further NLP (Natural Lan-guage Processing) applications. Morphological analyzers for highly inflectional languages are most efficiently developed using finite-state transducers. To develop the transducer, a lexicon of root words was obtained semi-automatically. The morphotactics of the language were implemented by hand in the lexc formalism, and morphophonological rules were implemented in the twol formalism. Evaluation of the transducer shows as it has decent coverage (over 80%) of forms in a large corpus and exhibits high precision (94.85%) and recall (94.11%) over a manually verified test set. To the best of our knowledge, this work is the first systematic and exhaustive implementation of the mor-phology of Wolaytta in a morphological transducer.
Keywords: Wolaytta language
Morphological analysis and generation HFST
Apertium
NLP
1 Introduction
This paper describes the development of Free/Open-Source morphological analyzer and generator for Wolaytta, an Omotic language of Ethiopia with almost no compu-tational resources. This tool was created as part of the research for developing a framework for exploiting cross-linguistic similarities in learning the morphology of under-resourced languages.
In language technology research, morphological analysis studies how the internal structure of words and word formation of a language can be modelled computationally. Word analysis involves breaking a word into its morphemes, the smallest forms paired with a particular meaning [1,14]. The function of a morphological analyzer is to return a lemma and information about the morphology in a word. A morphological generator
©ICST Institute for Computer Sciences, Social Informatics and Telecommunications Engineering 2018
F. Mekuria et al. (Eds.): ICT4DA 2017, LNICST 244, pp. 14–23, 2018.
does exactly the reverse of this; i.e., given a root word and grammatical information, a morphological generator will generate a particular form of a word [2]. Morphological analysis is a key component and a necessary step in nearly all natural language pro-cessing (NLP) applications for languages with rich morphology [2]. The output of morphological analysis can be used in many NLP applications, such as machine translation, machine-readable dictionaries, speech synthesis, speech recognition, lexi-cography, and spell checkers especially for morphologically complex languages [3].
In this work, we have considered the standard written Wolaytta text and used Helsinki Finite State Toolkit and tools from Apertium to build the morphological analyzer. All of the resources prepared for the development of the Wolaytta morpho-logical transducer, including the lexicon, the morphotactics, the alternation rules, and the ‘gold standard’morphologically analysed word list of 1,000 forms are all freely available online under an open-source license in Apertium’s svn repository1. This paper is organized as follows. Section2 briefly reviews the literature on morphological analysis generally and morphological analysers implemented in a similar way to the one described in this paper. Section3 provides a brief overview of the Wolaytta language. The implementation of the morphological analyzer follows in Sect.4. Sec-tion5 then covers the evaluation and results. Finally, the paper concludes in Sect.6 with some discussion of future research directions.
2 Literature Review
The importance of the availability of a morphological analyzer for NLP application development is reviewed by different researchers. Malladi and Mannem [19] stated that NLP for Hindi has suffered due to the lack of a high-coverage automatic morphological analyzer. Agglutinative languages such as Turkish, Finnish, and Hungarian require morphological analysis before further processing in NLP applications due to the complex morphology of the words [20]. In machine translation for highly inflectional (morphologically complex) and resource-limited languages, the presence of a mor-phological analyzer is crucial to reduce data sparseness and improve translation quality [2,22]. It is with this reality that there exist fully functional morphological analyzers for languages like English, Finnish, French, etc.
Since Kimmo Koskenniemi developed the two-level morphology approach [15], several approaches have been attempted for developing morphological analyzers. The rule-based approach is based on a set of hand-crafted rules and a dictionary that contains roots, morphemes, and morphotactic information [14, 16, 17]. In this approach, the morphological analysis requires the existence of a well-defined set of rules to accommodate most of the words in the language. When a word is given as an input to the morphological analyzer and if the corresponding morphemes are missing in the dictionary, then the rule-based system fails [15].
1Available at:https://svn.code.sf.net/p/apertium/svn/incubator/apertium-wal/.
2.1 Related Work
The transducer for Wolaytta presented in this paper was developed using a rule-based approach, implemented using a Finite State Transducer (FST). As outlined in some of the sources below, the finite state methodology is sufficiently mature and well-developed for use in several areas of NLP. Other works overviewed show the appli-cation offinite-state transducers to other Afroasiatic languages.
Among languages of Ethiopia, there is some research on developing morphological analyzers, including for Amharic [2,3,21], Afan Oromo [2] and Tigrigna [2]. Amharic and Tigrigna are classified as Semitic languages, and Afan Oromo is classified as a Cushitic language. One of the most well-known of these is HornMorpho [2], which is accessible online. HornMorpho is a system for morphological processing of the most widely spoken Ethiopian languages—Amharic, Oromo, and Tigrinya—using finite state transducers. For each language, it has a lexicon of roots derived from dictionaries of each language. To evaluate the system, words from different parts of speech are selected randomly from each word list. The system shows 96% accuracy for Tigrinya verbs and 99% accuracy for Amharic verbs.
Washington et al. [9] describes the development of a Free/Open-Sourcefinite-state morphological transducer for Kyrgyz using the Helsinki Finite-State Toolkit (HFST). The paper described issues in Kyrgyz morphology, the development of the tool, some linguistic issues encountered and how they were dealt with, and issues left to resolve. An evaluation is presented showing that the transducer has medium-level coverage, between 82% and 87% on two freely available corpora of Kyrgyz, and high precision and recall over a manually verified test set. In the other work using the same formalism, Washington et al. [23] describe the development of Free/Open-Source finite-state morphological transducers for three more Turkic languages—Kazakh, Tatar, and Kumyk—also using HFST. These transducers were all developed as part of the Apertium project, which is aimed at creating rule-based machine translation (RBMT) systems for lesser resourced languages. This paper describes how the development of a transducer for each subsequent closely-related language took less development time because of being able to reuse large portions of the morphotactic description from the first two transducers. An evaluation is presented shows that the transducers all have a reasonable coverage around 90% on freely available corpora of the languages, and high precision over a manually verified test set.
Yona and Wintner [18] describe HAMSAH (HAifaMorphological System for Analyzing Hebrew), a morphological processor for Modern Hebrew, based on finite-state linguistically motivated rules and a broad coverage lexicon. The set of rules comprehensively covers the morphological, morpho-phonological and orthographic phenomena that are observable in contemporary Hebrew texts. They show that reliance on finite-state technology facilitates the construction of a highly efficient and com-pletely bidirectional system for analysis and generation.
3 Morphology of the Language
Wolaytta belongs to the Omotic language family, which is a branch of the Afroasiatic language phylum, and is spoken in the Wolaytta Zone and some other parts of the Southern Nations, Nationalities, and People’s Region of Ethiopia [4]. Wolaytta has had a formal orthography since the 1940s, and is written in the Latin alphabet. A Bible was published in Wolaytta in 1981 [5].
Wolaytta is an agglutinative language and word forms can be generated from root words by adding suffixes. From a single root word, many word forms can be generated using derivational and inflectional morphemes. The order of added morphemes is governed by the morphotactic rules of the language. While suffixation is the most common word formation strategy in Wolaytta [6], compounding is also used [5].
In forming a word, adding one suffix to another, or“concatenative morphotactics”, is an extremely productive element of Wolaytta’s grammar [24]. This process of adding one suffix to another suffix can result in relatively long word forms, which often contain the amount of semantic information equivalent to a whole English phrase, clause or sentence. For example,“7imisissiis”is one word form in Wolaytta, which is equivalent to the expression in English“He caused someone to make someone else cause giving something to someone else”. When we analyze this word, it consists of 7im-is-iss-iis give-CAUS.CAUS.-PF.3 M.SG. Due to this complex morphological structure, a single Wolaytta word can give rise to a very large number of parses.
The second word formation process in Wolaytta is compounding. Compounding is the process in which two or more lexemes combine into a single new word [6]. Although Wolaytta is very rich in compounds, compound morphemes are rare in Wolaytta and their formation process is irregular. As a result, it is difficult to determine the stem of compounds from which the words are made [5].
Wolaytta nouns are inflected for number, gender and case. According to Wakasa [4], common nouns in Wolaytta are morphologically divided into four subclasses, three of which are masculine and one of which is feminine. Place-name and personal nouns are inflected differently from common nouns. Numerals are morphologically divided into four subclasses. They inflect according to case, and concrete forms (singular and plural) of the common noun can be derived from them. Verbs in Wolaytta are inflected for person, number, gender, aspect and mood. Wolaytta has two genders (masculine and feminine), two numbers (singular and plural), three persons (first, second and third), andfive cases (absolutive, oblique, nominative, interrogative, and vocative).
In terms of derivational processes, a common noun stem may be derived from a common noun stem or a verb stem by adding a suffix that has a particular function. In the same way, a verb stem may be derived from a common noun stem.
4 Implementation of the Morphological Analyzer
Table 1. Words in their lexical and surface forms
Lexical form Surface form
d-. -NOM.M.SG. d-ées
wooss-. -PF.3 M.SG. wooss-íis m-. -PF.3 M.SG. miss-íis 7im-.-CAUS.-CAUS.-PF.3 M.SG 7im-is- iss-íis
language application development [9]. HFST has been used for creating morphological analyzers and spell checkers using a single open-source platform and supports extending and improving the descriptions with weights to accommodate the modeling of statistical information [11]. It implements both the lexc formalism for defining lexicons, and the twol and xfst formalisms for modeling morphophonological rules which describe what changes happen when morphemes are joined together.
FSTs are a computationally efficient, inherently bidirectional approach that dis-tinguishes between the surface and lexical realizations of a given morpheme and attempts to establish a mapping between the two. It can be used for both analysis (converting from word form to morphological analysis) and generation (converting from morphological analysis to word form) [10,13]. Table1below shows examples of lexical and surface form representations for sample Wolaytta words in the two-level morphology.
While building the Wolaytta morphological analyzer using HFST, the following information is used: a lexicon of Wolaytta words, morphotactics, and orthographic rules.
The lexicon is the list of stems and affixes together with basic information about them (Noun stem, Verb stem, etc.,). One of the challenges to develop natural language pro-cessing applications for languages like Wolaytta is the unavailability of digital resources. There are no available digital resources, like corpora, for Wolaytta. The Wolaytta lexicon was extracted semi-automatically from an unpublished Wolaytta-English bilingual dic-tionary and other printed reference books written for academic purposes. The data in Table2shows the part of speech, the number of stems in the lexicon of that part of speech, and an example of how the data is represented in the system.
Morphotactics is a model of morpheme ordering that explains which classes of morphemes can follow other classes of morphemes inside a word [10]. The lexicon and morphotactics are defined in the HFST-lexC compiler, which is a program that reads sets of morphemes and their morphotactic combinations in order to create afinite state transducer. Using HFST, morphophonology is mostly dealt with by assigning special segments in the morphotactics (lexc) which are used as the source, target, and/or part of the conditioning environment for twol rules [10]. In lexc, morphemes are arranged into named sets called sub-lexicons. As shown in Fig.1, each entry of a sub-lexicon is a pair offinite possibly empty strings separated by“:”and associated with the name of a sub-lexicon called a continuation class.
Fig. 1. Example lexicons representing a single path, for the formaacawsu.
One of the challenging tasks is identifying the existing roots and suffixes of each word in all the word classes, since the available linguistic studies of the language are limited. For this language, the most useful study is that of Wakasa [4], which we used to categorize the collected lexicons from the dictionary into different classes based on their morphological characteristics.
Morphophonological and orthographic rules are spelling rules used to model the changes that occur in a word when two morphemes combine. The orthographic rules for the Wolaytta language in the HFST architecture are written in the HFST-TwolC formalism. HFST-TwolC rules are parallel constraints on symbol-Pair strings gov-erning the realizations of lexical word forms as corresponding surface strings. HFST-TwolC is an accurate and efficient open-source two-level compiler. It compiles grammars of two level rules into sets offinite-state transducers. Identifying and writing the existing rules manually is a real difficulty for under-resourced languages like Wolaytta. Even when a resource such as Wakasa [4] exists, it may fail to express all relevant conditions. Some of the rules in the Wolaytta morphological analyzer are shown in Fig.2.
The symbol indicates comments; is an escape character, and archiphonemes are in . Whenever there are exceptions, the archiphoneme (which is always deleted in the output) is used to block phonology from applying.
5 Analysis and Evaluation
As mentioned before, the system is implemented using Helsinki finite state tools. Morphotactic rules and possible morphemes are defined in the lexiconfile. Alternation rules of Wolaytta verbs are defined and the rules are composed with the lexiconfile in a HFST-twolfile. The system works in two directions, between the lexical and surface levels.
We have prepared a Wolaytta sentence corpus from the Wolaytta-English bilingual dictionary. Identifying the existing Wolaytta-only sentences requires lots of manual work in line with the programs written to identify Wolaytta-only sentences. One of the difficulties is confusion with words that can also be English (E.g.“He”refers“This”in Wolaytta).
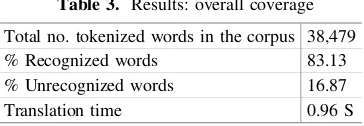
As listed in Table3 above, 16.87% of words are not recognized by the Wolaytta morphological analyzer. Since most Wolaytta texts use the apostrophe character (U +0027) to represent the glottal stop instead of the more proper modifier letter apostrophe (U+02BC), most words with glottal stops are unrecognised. Among the top twenty unrecognized words, more than 75% are words with glottal stop characters. The remaining words fall into out-of-vocabulary words (mostly proper nouns) and noise. The lexicon is collected mostly from the Wolaytta-English dictionary. Adding more lexical entries collected from different domains to the system could further improve the coverage. To evaluate the accuracy of the system, one thousand forms were chosen at random from a corpus of approximately 38K Wolaytta words. These forms were tokenised and hand-annotated, creating a gold standard. When compared against the output of the transducer, precision (the percentage of returned analyses that are correct) is 94.85% and recall (the percentage of correct analyses that are returned) is 94.11%.
6 Conclusions and Future Work
We described the construction of thefirst known morphological analyzer for Wolaytta using HFST and the Apertium framework. This morphological analyzer acts as a pre-liminary step to achieving relevant output for the applications like spell checking, text mining, text summarization, etc., by providing analyses of word forms. This morpho-logical transducer can also easily be used to for developing a machine translation system for Wolaytta-English since our system is already incorporated into Apertium.
To develop a fully functional analyzer, the lexicon needs to be exhaustive and rich in morpho-syntactic information, and it is necessary to write additional phonological rules to cover all cases where they are needed. Our analyzer can handle inflectional and derivational morphology for native Wolaytta words, but so far not for loan words. In future work, analysis for other categories needs to be handled by adding exceptions for widely used loan words to existing rules. Moreover, we the working system is available on the web to anyone interested in further enhancing the analyzer or in need of a Wolaytta transducer for use in their own application development.
Table 3. Results: overall coverage Total no. tokenized words in the corpus 38,479
% Recognized words 83.13
% Unrecognized words 16.87
Translation time 0.96 S
References
1. Allen, J.: Natural language understanding (1987)
2. Gasser, M.: HornMorpho: a system for morphological processing of Amharic, Oromo, and Tigrinya. In: Conference on Human Language Technology for Development, Alexandria, Egypt (2011)
3. Mulugeta, W., Gasser, M.: Learning morphological rules for Amharic verbs using inductive logic programming. Lang. Technol. Normalisation Less-Resourced Lang.7(2012) 4. Wakasa, M.: A descriptive study of the modern Wolaytta language. Unpublished Ph.D.
thesis, University of Tokyo (2008)
5. Lamberti, M., Roberto, S.: The Wolaytta Language, vol. 6. Rudiger Koppe, Cologne (1997) 6. Lessa, L.: Development of stemming algorithm for Wolaytta text. Diss. aau (2003) 7. Bosch, S.E., Pretorius, L.: A finite-state approach to linguistic constraints in Zulu
morphological analysis. Studia Orientalia Electronica103, 205–228 (2015)
8. Beesley, K.R., Karttunen, L.: Finite State Morphology. Center for the Study of Language and Information (2003)
9. Washington, J., Ipasov, M., Tyers, F.M.: A finite-State morphological transducer for Kyrgyz. In: LREC (2012)
10. Martin, J.H., Jurafsky, D.: Speech and Language Processing, International Edition 710 (2000)
11. Linden, K., Axelson, E., Hardwick, S., Silfverberg, M., Pirinen, T.: HFST—framework for compiling and applying morphologies. In: Mahlow, C., Pietrowski, M. (eds.) State of the Art in Computational Morphology. Communications in Computer and Information Science, vol. 100, pp. 67–85. Springer, Berlin Heidelberg (2011).
https://doi.org/10.1007/978-3-642-23138-4_5
12. Lindén, K., Silfverberg, M., Pirinen, T.: Hfst tools for morphology—an efficient open-source package for construction of morphological analyzers. In: Mahlow, C., Pietrowski, M. (eds.) State of the Art in Computational Morphology. Communications in Computer and Information Science, vol. 41, pp. 28–47. Springer, Berlin Heidelberg (2009).https://doi.org/
10.1007/978-3-642-04131-0_3
13. Karttunen, L.: Finite-state lexicon compiler. Technical report ISTL-NLTT-1993-04-02, Xerox Palo Alto Research Center, Palo Alto, California (1993)
14. Oflazer, K.: Two-level description of Turkish morphology. In: Proceedings of the Sixth Conference on European Chapter of the Association for Computational Linguistics, EACL 1993, p. 472. Association for Computational Linguistics, Stroudsburg (1993)
15. Koskenniemi, K.: A general computational model for word form recognition and production. In: Proceedings of the 10th International Conference on Computational Linguistics, pp. 178–
181. Association for Computational Linguistics (1984)
16. Grac, M.: Yet another formalism for morphological paradigm. In: Recent Advances in Slavonic Natural Language Processing, RASLAN 2009, p. 9 (2009)
17. Oflazer, K., Kuruoz, I.: Tagging and morphological disambiguation of Turkish text. In: Proceedings of the Fourth Conference on Applied Natural Language Processing, ANLC 1994, pp. 144–149. Association for Computational Linguistics, Stroudsburg (1994)
18. Yona, S., Wintner, S.: Afinite-state morphological grammar of Hebrew. Nat. Lang. Eng.14 (02), 173–190 (2008)
19. Malladi, D.K., Mannem, P.: Context based statistical morphological analyzer and its effect on Hindi dependency parsing. In: Fourth Workshop on Statistical Parsing of Morpholog-ically Rich Languages, vol. 12, p. 119 (2013)
20. Eray Yildiz, C., Bahadir Sahin, H., Mustafa Tolga Eren, O.: A morphology-aware network for morphological disambiguation (2016)
21. Amsalu, S., Gibbon, D.: Finite state morphology of Amharic. In: Proceedings of RANLP (2005)
22. Goldwater, S., McClosky, D. Improving statistical MT through morphological analysis. In: Proceedings of the Conference on Human Language Technology and Empirical Methods in Natural Language Processing, pp. 676–683. Association for Computational Linguistics
(2005)
23. Washington, J., Salimzyanov, I., Tyers, F.M.: Finite-state morphological transducers for three Kypchak languages. In: Proceedings of LREC, pp. 3378–3385 (2014)
24. Beesley, K.R., Karttunen, L.: Finite-state non-concatenative morphotactics. In: Proceedings of the 38th Annual Meeting on Association for Computational Linguistics, pp. 191–198.
Association for Computational Linguistics (2000)
Malaria Detection and Classi
fi
cation
Using Machine Learning Algorithms
Yaecob Girmay Gezahegn1(&), Yirga Hagos G. Medhin2, Eneyew Adugna Etsub1, and Gereziher Niguse G. Tekele2
1
Addis Ababa University, Addis Ababa, Ethiopia [email protected], [email protected]
2
Mekelle University, Mekelle, Ethiopia
[email protected], [email protected]
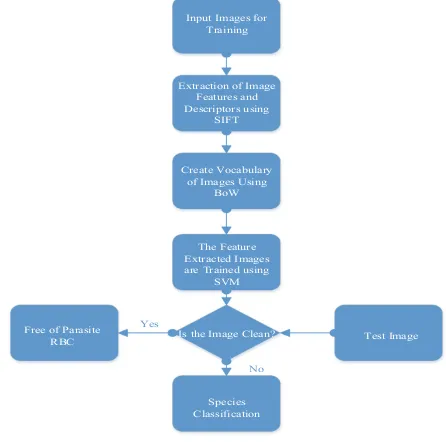
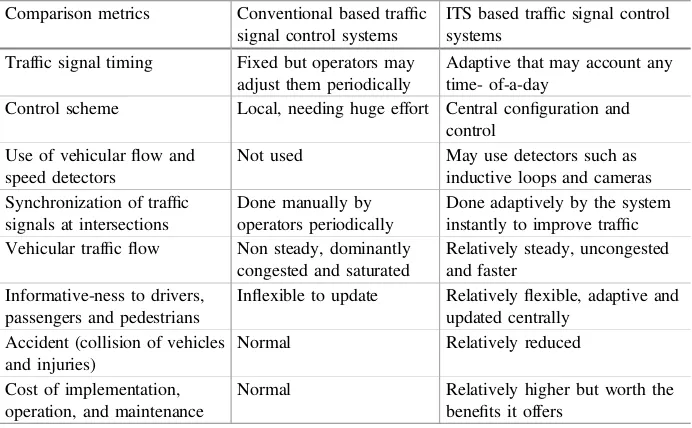
Abstract. Malaria is one of the most infectious diseases, specifically in tropical areas where it affects millions of lives each year. Manual laboratory diagnosis of Malaria needs careful examination to distinguish infected and healthy Red Blood Cells (RBCs). However, it is time consuming, needs experience, and may face inaccurate lab results due to human errors. As a result, doctors and spe-cialists are likely to provide improper prescriptions. With the current techno-logical advancement, the whole diagnosis process can be automated. Hence, automating the process needs analysis of the infected blood smear images so as to provide reliable, objective result, rapid, accurate, low cost and easily inter-pretable outcome. In this paper comparison of conventional image segmentation techniques for extracting Malaria infected RBC are presented. In addition, Scale Invariant Feature Transform (SIFT) for extraction of features and Support Vector Machine (SVM) for classification are also discussed. SVM is used to classify the features which are extracted using SIFT. The overall performance measures of the experimentation are, accuracy (78.89%), sensitivity (80%) and specificity (76.67%). As the dataset used for training and testing is increased, the performance measures can also be increased. This technique facilitates and translates microscopy diagnosis of Malaria to a computer platform so that reliability of the treatment and lack of medical expertise can be solved wherever the technique is employed.
Keywords: Machine learning
Image segmentation
SIFT
SVM Blood smear
Microscopic
Feature extraction
1 Introduction
Malaria is an endemic and most serious infectious disease next to tuberculosis throughout the world. Africa, Asia, South America, to some extent in the Middle East and Europe are affected by the disease [1]. Plasmodium species which affect humans are: Malariae, Ovale, Vivax, Falciparum and recently Knowlesi. The only species that is potentially fatal is Plasmodium Falciparum according to Center for Infectious Diseases (CDC) report [2,4].
©ICST Institute for Computer Sciences, Social Informatics and Telecommunications Engineering 2018 F. Mekuria et al. (Eds.): ICT4DA 2017, LNICST 244, pp. 24–33, 2018.
The distribution of Malaria in Ethiopia can be found in places where the elevation is less than 2300 m above sea level, as can be shown in Fig.1. The transmission of Malaria is seasonal and hence reaches its peak from September to December following the rainy summer season [12].
The two widely known species of Plasmodium in Ethiopia are Falciparum (77%) and Vivax (22%). Relative frequency varies in time and space within a given geo-graphical range. Plasmodium Malariae and Ovale are rare and less than 1%. 60% of the population lives in lowland areas where Malaria can easily spread. Out of the overall population more than 11 million (13%) is under high risk of the infectious disease.
The economic impact in the countries which are affected by Malaria is huge. According to World Health Organization (WHO), total funding for Malaria was esti-mated to be US$ 2.9 billion in 2015. Governments of endemic countries provided 32% of total funding. According to different studies, 40% of public health drug expenditure is allocated for Malaria, 30% to 50% of inpatient admissions and up to 60% of out-patient health clinic visits are due to Malaria [2,3], not to mention the humanitarian and non-governmental organizations supporting in different ways.
The reasons for the death toll in the aforementioned regions are due to convenient tropical climate for the growth of the parasites, inadequate technology to combat the disease, illiteracy, and poor socio-economic conditions which make access difficult to health and prevention resources [3]. So, to prevent and eradicate Malaria by the help of technological applications, this paper tries to address image processing techniques and machine learning based identification and classification algorithms which facilitate the diagnosis process.
Mosquito consumes human blood by biting, sporozoites circulate in the blood stream andfinally move to the liver where they multiply asexually for some time. In the liver merozoites are regenerated and then invade RBCs [4,5]. Within RBC the parasite either grows until it reaches a mature form and breaks the cell to release more mero-zoites into the blood stream to conquer new RBCs or it may grow to reach asexual form named gametocyte and be taken by a mosquito to infect another person where it sexually regenerates to produce sporozoites [6].
Fig. 1. Map of malaria strata in Ethiopia (©2014) [12].
![Fig. 2. Healthy thin blood film image with RBCs, WBCs and Platelets [9]. (Color figure online)](https://thumb-ap.123doks.com/thumbv2/123dok/3934383.1877803/38.439.128.301.59.151/healthy-blood-lm-image-platelets-color-gure-online.webp)
![Table 1. Comparisons of manual, RDT and computerized microscopy diagnosis requirementsand specifications [14, 15].](https://thumb-ap.123doks.com/thumbv2/123dok/3934383.1877803/39.439.54.401.82.325/table-comparisons-manual-computerized-microscopy-diagnosis-requirementsand-specications.webp)
![Fig. 1. Triangulation positioning techniques [3]](https://thumb-ap.123doks.com/thumbv2/123dok/3934383.1877803/59.439.174.280.529.587/fig-triangulation-positioning-techniques.webp)
![Fig. 2. 2D trilateration positioning techniques [3]](https://thumb-ap.123doks.com/thumbv2/123dok/3934383.1877803/60.439.123.306.82.166/fig-d-trilateration-positioning-techniques.webp)