“Saya akui laporan ini adalah hasil kerja saya sendiri kecuali ringkasan dan petikan yang tiap-tiap satunya telah saya jelaskan sumbernya.”
Tandatangan : ………....
Nama Penulis : ………....
Tarikh : ………....
LEE YIN HUI
iv
“Saya/kami akui bahawa saya telah membaca karya ini pada pandangan saya/kami karya ini adalah memadai dari skop dan kualiti untuk tujuan penganugerahan Ijazah
Sarjana Muda Kejuruteraan Elektronik (Komunikasi Wayarles).”
Tandatangan : ………....
Nama Penyelia : ………....
vi
ACKNOWLEDGEMENT
First and foremost, I would like to acknowledge and express my utmost gratitude to my supervisor, Dr. Lim Kim Chuan from Faculty of Electronics and Computer Engineering, Universiti Teknikal Malaysia Melaka (UTeM) for his essential guidance and supervision throughout the research of this final year project. I am grateful for he has generously shared his experience and valuable knowledge, the unconditional support and encouragement towards the completion of the thesis.
I would like to express my appreciation to my co-supervisor, Dr Soo Yew Guan and Professor Madya Tan Kim See for their magnificent support towards the completion of the project.
Next, I would like to extend my gratitude to the master students, Mr. Cheng Kah Loon and Mr. Hoo Jian Ea for their generous guidance throughout the project. My appreciation specially extended to Mr. James Teo Jiun Jye for his valuable guidance and support.
With the deepest gratitude I wish to thank Ms. Choong Mei Teng, Mr. Brian Poon, Mr. Yap Eng Sing, Ms. Yeo Xin Yi and Ms. Lam Vivian for their unconditional support throughout the entire project.
ABSTRACT
Traffic congestion issues have always been a concern for this fast growing metropolitans in which more than 90 percent of trips are made entirely by private means of transportation i.e. by car and motorcycle. As Malaysia is actively engaged in infrastructure development especially in the transportation network to facilitate the movements of people and goods, a high demand for better public transportation is needed to reduce the issue of road congestion (RM5.51 billion of productivity lost annually in Malaysia due to the traffic congestion). Therefore, a cost effective Wi-Fi sniffing based bus commuters’ statistic collection system is designed and developed to predict the necessity of scheduling additional bus services which in turn assist in reducing the waiting time as well as improving the quality of commuting experience. Raspberry-Pi 2 which has substantial computing capability and ability of sniffing each of the unique MAC addresses embedded throughout the communication between nearby smartphones with the free Wi-Fi access point is deployed to the busiest bus stop in UTeM. By implementing the sniffing of probe request and data frames, the number of commuters’ device unique MAC addresses are collected and processed. To validate the feasibility of the proposed system, the amount of sniffed unique MAC address is then cross validated with the captured camera video image installed on the Raspberry-Pi 2. The obtained results also show that variation of sniffed MAC address exhibit parallelism to the actual number of commuters waiting at the bus station as observed in the bus station video image. Result also shows that the MAC address based counting system can help to alert the bus management for better scheduling when the commuter at the particular bus stop is traveling to the same destination.
viii
ABSTRAK
TABLE OF CONTENT
CHAPTER TITLE PAGE
PROJECT TITLE i
REPORT STATUS COMFIRMATION FORM ii
DECLARATION iii
VERIFICATION OF SUPERVISOR iv
DEDICATION v
ACKNOWLEDGMENT vi
ABSTRACT vii
ABSTRAK viii
TABLE OF CONTENTS ix
LIST OF TABLES xiii
LIST OF FIGURES xiv
I INTRODUCTION 1
1.1 BACKGROUND 1
1.2 PROBLEM STATEMENT 2
1.3 OBJECTIVES 2
1.4 SCOPE OF PROJECT 3
1.5 STRUCTURE OF THESIS 3
II LITERATURE REVIEW 4
2.1 COMPARISON OF LINUX BASED SBC 4
x 2.3 OPTIMIZED CHANNEL DETECTION
2.3.1 AVERAGE TIME CHANNEL ALLOCATION 2.3.2 CACFA
2.3.3 CAOCA
5 6
7 8
2.4 FACTORS AFFECT WI-FI MONITORING 9
2.5 RECEIVED SIGNAL STRENGTH 10
2.6 APPLICATION OF WIRELESS MONITORING 10
2.7 BUS TRACKING SYSTEM 15
2.8 CONCERN OF WI-FI SNIFFING
17
III METHODOLOGY 18
3.1 SELECTION OF RASPBERRY-PI (SINGLE CORE AND QUAD CORE)
18
3.1.1 Testbed Setup for Raspberry-Pi CPU capability measurement
19
3.1.2 Measurement of CPU Utilization 20 3.1.3 Preparation for site measurement 21 3.1.4 Deployment of Raspberry-Pi 2 Camera 22 3.2 PRE-PROCESSING OF SNIFFING RESULT 23 3.3 POST-PROCESSING OF SNIFFING RESULT FILE 26 3.4 EMPLOYMENT OF QLIK SENSE TO DISPLAY
RESULTS
29
IV RESULT AND DISCUSSION 33
4.1 RASPBERRY-PI 2 COMPUTING CAPABILITIES STUDIES AND DEPLOYMENT
33
4.1.1 Identifying maximum Wi-Fi link throughput of the selected Wi-Fi adapter
4.1.2 Identifying maximum computing capability of Raspberry-Pi 2 with python Scapy
37
4.1.3 Site Wi-Fi link traffic assessment 42 4.1.4 Developed Raspberry-Pi 2 Wi-Fi sniffing
prototype for site deployment
44
4.2 IDENTIFY SUITABLE WI-FI FRAME TYPE FOR BUS PASSENGER STUDY
45
4.2.1 Analysis of data frames 45 4.3.2 Analysis of probe request frames 47 4.3 VISUALIZATION AND ANALYSIS OF SNIFFING
RESULTS
49
4.3.1 Dominance boarding destination (Emerald Park)
50
4.3.2 Multiple boarding destination (Emerald Park and Sri Utama)
53
4.3.3 Accuracy study of the total sniffed unique MAC address with respect to the observed commuter
55
V CONCLUSION AND FUTURE WORK 62
5.1 CONCLUSION 62
5.2 FUTURE WORK 64
REFERENCES 66
xii
LIST OF TABLES
NO TITLE PAGE
2.1 Modes of Network Interface Card 5
2.2 Comparison of system implementation using single antenna and multiple antenna
9
2.3 Comparison of ways to obtain number of passengers and the needs to improve public transport service
16
3.1 Command and explanation of conducting Iperf testing 19
3.2 Command and explanation of configuring the monitor mode of network interface card
21
3.3 802.11 Frame Control Subfield 23
3.4 UTeM Bus Timetable 26
4.1 CPU utilization of Raspberry-Pi 2 running Iperf server correspond to the traffic generated by Iperf client
35
4.2 CPU utilization of Raspberry-Pi 2 running python Scapy correspond to the traffic generated by Iperf client
39
4.3 Difference between the unique MAC address obtained from probe request frames and data frames for five consecutive days.
47
4.5 Difference between number of MAC address sniffed correspond to the actual number of passengers observed from captured image
58
4.6 Difference between the number of MAC address sniffed correspond to the actual number of passengers observed and the percentage of error calculated
xiv
LIST OF FIGURES
NO TITLE PAGE
2.1 Example of CACFA algorithm 7
2.2 Example of CAOCA algorithm 8
2.3 Illustration of experimental setups and real environments in a coffee shop
12
2.4 Illustration of experimental setups and real environments in an airport
13
2.5 Raspberry-Pi software 13
2.6 Renew’s recycling bins tracked the MAC addresses of pedestrians’ phones
14
2.7 Mo-Fi system with front end Wi-Fi sniffer and back-end data analysis
15
3.1 Iperf testing setup 20
3.2 Terminal showing CPU utilisation (CPU0 to CPU3) of the device with Linux top command
21
3.3 Command for setting up the Wireshark experiment 22
3.4 Python script of using Raspberry-Pi 2 camera to capture the image. 23
3.7 (i) Smartphone A initiates a probe request. Probe response (ii) for Smartphone A, replied by the access point, is picked up by the sniffer.
25
3.8 Graph analysis of time versus number of MAC address for probe response frame
26
3.9 Post processing of sniffing results using Python script 27 3.10 Removing null addresses and broadcast addresses using Matlab
script
28
3.11 Processing of sniffed results using Matlab script to present in Qlik Sense Desktop
29
3.12 Interface of Qlik sense for data analysis 30
3.13 Visualizing the time specific MAC address appeared throughout the day
31
3.14 Visualizing the peak hour throughout a day by clicking on the ‘Date’
31
3.15 Block diagram of the proposed bus prediction system using Wi-Fi sniffing technology
32
4.1 Results of Iperf client generating UDP traffic of 1Mbit/s, 10Mbit/s, 20Mbit/s and 40Mbit/s.
33
4.2 CPU utilization of Iperf server when UDP traffic is 1Mbit/s 34 4.3 number of traffic generated by Iperf client to the Iperf server
increased from 0.5Mbit/s to 1.5Mbit/s
36
4.4 ‘Top’ command is used to show the CPU utilization of the Raspberry-Pi 2 when performing sniffing using Scapy and the traffic generated (0.5Mbit/s) by Iperf client
xvi 4.5 Graph of CPU utilization (python Scapy) versus the amount of
traffic generated
39
4.6 the average traffic sniffed by using Wireshark at around 1:30pm 42
4.7 the average traffic sniffed by using Wireshark at around 4:30pm 42
4.8 Wi-Fi sniffer prototype 43
4.9 Log file of data frames displaying the date time (first column) and three different addresses (address 1, 2 and 3)
44
4.10 Unique MAC addresses that are filtered from the data frames log file for five consecutive days.
46
4.11 Log file of probe request frames displaying the time, date, clients’ MAC address and access points’ MAC address
47
4.12 Graph of number of MAC address versus time obtained from probe request frames for interval of 5 minutes per scheduled hour
43
4.13 Observed number of passengers waiting at the bus station at 5:30pm is estimated at approximate of 65
51
4.14 Observed number of passengers waiting at the bus station at 6:30pm is estimated at approximate of 62 whereby most of the passengers have been waiting for an hour (from 5:30pm to 6:30pm)
51
4.15 An estimate number of 39 passengers observed from the captured image at 4:31pm are traveling to Emerald Park
53
4.16 Bus boarding to Emerald Park at 11:34am arrived. Observed number of passengers to across the recorded image sequences is around 25
54
4.17 Bus boarding to Sri Utama at 11:30am arrived. Observed number of passengers to across the recorded image sequences is around 3 person
CHAPTER 1
INTRODUCTION
1.1 Background
Malaysia has been reported that the number of vehicles on roads was at 22.7 million as of December 2013 (Tajuddin R, 2014). Traffic congestion happens every day in megacity and this will certainly contribute to a loss of productivity. Alternatives measures such as MRT project, building new highways and widen the roads have been implemented by the government. However, the proposed solution account for large funding. The possible solution is to make use of the available resources such as upgrading the existing public transportation services to overcome the traffic congestion on roads. UTeM bus services has always been an issue for both the university management and the students commuting between the university and the hostel. The location of the students’ hostel is hardly reached by walking distance; largely dependent on the bus and other modes of transportation. However, the ineffective bus system has always led to various problems encountered by the students. For instance, the bus capacity can only afford 40 students while at some particular hours, the number of students exceeded the carrying capacity. Time is wasted when there is no additional bus provided and bus that is overcrowded just make the commuting experience even worst.
2 a number of them are using the free Wi-Fi internet access provided by the University while waiting for the bus to arrive, a Wi-Fi sniffing based bus commuters destination prediction system, counting the number of unique Wi-Fi MAC address embedded throughout the communication between the smartphone and the access point, could help to predict the need of scheduling additional bus whenever is needed.
1.2 Problem Statement
A system that can increase the effectiveness and reliability of the bus system is the main priority of the project. A suitable Wi-Fi sniffing device and system to make use of the observed total number of unique Wi-Fi MAC address as the commuters’ statistic to predict the need of scheduling additional bus is yet to be implemented.
1.3 Objectives
The following objectives will be achieved throughout the implementation of the system:
1. To study the computing capabilities and deployment of sniffing device. 2. To identify and record the needed Wi-Fi frame for bus commuter statistic study 3. To import, visualize and extract needed Wi-Fi MAC address from the sniffing
results for bus commuter statistic study.
4. To determine the accuracy of the sniffed MAC address and the number of observed traveller.
1.4 Scope of Project
4
CHAPTER 2
LITERATURE REVIEW
With the explosive growth and wide-spread use of Wi-Fi enabled smartphones, peoples are fond of accessing the Internet through Wi-Fi network interfaces of smartphones. Each smartphones has the unique MAC address, and by deploying Wi-Fi sniffer sensors, it is possible to capture Wi-Wi-Fi messages and possible to identify the owner’s presence in the area of interest.
2.1 Comparison of different Linux-based open-spec single-board computers
According to the Hacker SBC (single board computer) Survey dated 11 June 2015, LinuxGizmos.com and Linux Foundation’s Linux.com community website announced the winner for the SBC is Raspberry Pi 2 Model B. This model outweighed the other SBC in terms of specifications and features of the Raspberry Pi 2. The Raspberry Pi 2 Model B is one of the most affordable device which consists of Quadrature CPU (Cortex-A7) and has 1GB built-in Random Access Memory (RAM).
2.2 Packet Sniffing
troubleshoot the network. Packet sniffing can be categorized into passive sniffing and active sniffing.Passive sniffing is referred to as the sniffing station listen to a particular channel and extract Media Access Control (MAC) address and received signal strength from the captured packet without joining the wireless network. N.T. Anh (2005) said that passive sniffer can easily eavesdrop traffic by turning the network card into the RF-Mon (Radio frequency monitoring) mode.
On the other hand, active sniffing involves that a client first sending a probe request frame on each available channel. It then wait for the probe response frame from the available APs. Once the client received the probe response, it acknowledged back to the AP where the acknowledgement comprises client’s MAC address which is necessary for tracking.
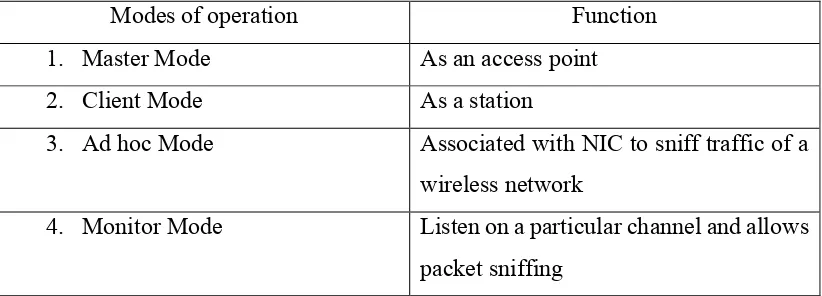
In order to capture the packet, the network interface card (NIC) need to be set in the promiscuous mode. Packet sniffers will receive all packets even they are not intended for it.
Table 2.1: Modes of Network Interface Card
Modes of operation Function
1. Master Mode As an access point
2. Client Mode As a station
3. Ad hoc Mode Associated with NIC to sniff traffic of a wireless network
4. Monitor Mode Listen on a particular channel and allows packet sniffing
2.2.1 Tools for Traffic Analysis
6 network. According to N.T. Anh (2005), Ethereal can capture the live packet and write to dumpfiles. It outweighs Wellenreiter and Kismet in the ability to analyze dumpfiles.
Tcpdump is another common packet analyzer that runs under the command line. G. Anshul (Jul 2013) described that while many others software packages that can take packet traces tend to leave the analysis to the operator of the packet sniffer, tcpdump uses the libpcap module, which is an API for packet capture and analysis to present packets in a more readable format. Tcpdump is also known as a protocol analyzer which combines the ability to retrieve packets from networks and to decompose the relevant protocols to validate the analysis.
Scapy is a very powerful interactive packet manipulation program. The ability of Scapy includes decoding packets, sending packets on wire, capturing packets, matching requests and replies. Besides, Scapy is able to handle tasks such as trace routing, scanning, probing and unit testing.
2.3 Optimized Channel Detection and Selection
The channel detection and selection method is used to monitor and aggregate Wi-Fi messages from smartphones including probe message and data messages as many as possible. Wi-Fi probe messages are periodically sent to all fourteen channels via smartphones and Wi-Fi data messages are sent in the fixed working channel of connected Wi-Fi network when associated with a Wi-Fi access point.
2.3.1 Average Time Channel Allocation (ATCA)
2.3.2 Channel Activeness Based Channel Fair Allocation (CACFA)
The CACFA method allocates the varied length of sniffing time slices for all fourteen Wi-Fi channels based on the received message number and weights of each channel. This method sorts each channel message counting list in ascending order in the first five minutes, then separates the remainder 55 minutes into numbers of time slices by fifteen seconds interval and dispatches the slices to each channel in the counting list due to the packets percentage of total packets number. Each channel on list would at least get one time slice.
Zhuliang Xu et al. (2013) showed that there is trade-off between hopping time and scanning time. Shorter hopping time will cause packets loss in one specific channel because it spends less time to monitor the channel. On the other hand, longer hopping time will cause packets loss in other channels.
Meanwhile, shorter scanning time will decrease the number of scanned channels but if the scanning time is longer, it will reduce the data volume and the data accuracy which shows the possible location in a movement trace. Therefore, the time is evenly allocated to each channel for packets sniffing. This is a balance for the trade-off which mentioned above.
Figure 2.1: Example of CACFA algorithm
8
2.3.3 Channel Activeness Based Optimization Channel Allocation (CAOCA)
The CAOCA method is derived from the CACFA method which allocate more time on the channels with higher level of activeness and discards the channels with extremely low activeness. The CAOCA method sorts the channel’s weights in descending order in the first five minutes in the detection phase. Then it separates the remainder 55 minutes into time slices by 15 seconds interval and allocates the time slices to those high-quality channels first in the list according to the packets percentage of total packets number. When over 95% time slices have been allocated, the algorithms stop.
Eventually, one or a few channels with high quality from the total of fourteen channels have been selected. The packet counting results have showed that the CAOCA method is a little better than the CACFA method and about seventy six percent higher than the best channel of fixed channel allocation algorithms.
Figure 2.2: Example of CAOCA algorithm
2.3.4 Greedy-sum Heuristic
Greedy-sum heuristic is designed for the min-sum objective. It models the sniffer channel selection problem as a minimum set covering problem: map each sniffer to C virtual sniffers, each monitoring one channel in C, then the min-sum problem is equivalent to finding the minimum number of virtual sniffers so that all access points are monitored and hence the number of virtual sniffers is minimized. Greedy-sum follows a greedy algorithm and it runs in iterations. In each iteration, it picks a sniffer and channel pair that monitors the maximum number of APs. The iteration stops when all the APs are monitored.
2.4 Factors that affect Wi-Fi monitoring
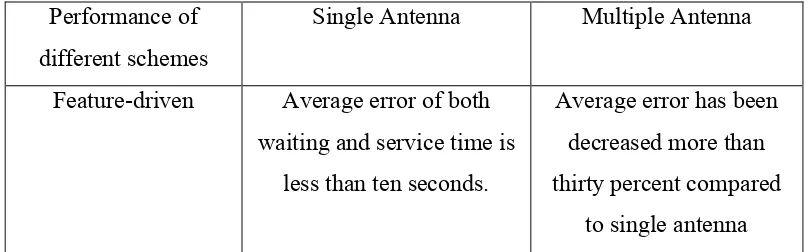
There are various causes which may lead to the accuracy of the Wi-Fi monitoring system. One of which is the use of antenna in the system. Based on findings from N.Abedi et al (2013), the types of antennas used did contribute to the efficiency of scanning MAC address. Basically, omnidirectional antennas and directional antennas are common types of Wi-Fi antennas. In order to capture all the required MAC addresses, types of antennas used are to be determined to ensure a complete coverage area where interference may occur due to blockings of walls, trees, human density and so on.
Table 2.2: Comparison of system implementation using single antenna and multiple antenna
Performance of different schemes
Single Antenna Multiple Antenna
Feature-driven Average error of both waiting and service time is
less than ten seconds.
Average error has been decreased more than thirty percent compared
10 Bayesian Network Outweighed feature-driven
scheme by more than fifty percent.
Effective in minimizing the errors due to signal
fluctuations.
2.5 Received Signal Strength
According to Z.L. Xu et al. (2013), received signal strength indicator (RSSI) is a parameter used to represent the power of the received radio signal. The received signal strength simply means the strength received by wireless end devices’ antenna. Many factors can affect the received signal strength, one of it is the dynamic outdoor environment. Slow fading and fast fading can contribute to the difference in signal strength too. N.Abedi et al. (2013) pointed out that the if the impact of environment and received signal strength of the antenna was assessed, the distance between the sniffer and the MAC devices/smartphones can be approximately estimated by referring to the value of signal strength. Research showed that the RSS decreases when the smartphones/Wi-Fi devices move away from the sniffer while keeping the antenna and environment type constant.
Referring to researches carried out by A.J. Ruiz et al (2014), the MAC addresses are encrypted and their position is estimated by computing the RSS measurements and it requires only the position of the access points.
2.6 Application of Wireless Monitoring