learning the concepts simple and fun. It will change the way you think and approach problems using proven techniques and free tools. Concepts are good in theory and even better in practicality.”
— Anthony Rose, President, Support Analytics
“Head First Data Analysis does a fantastic job of giving readers systematic methods to analyze real-world problems. From coffee, to rubber duckies, to asking for a raise, Head First Data Analysis shows the reader how to find and unlock the power of data in everyday life. Using everything from graphs and visual aides to computer programs like Excel and R, Head First Data Analysis gives readers at all levels accessible ways to understand how systematic data analysis can improve decision making both large and small.”
— Eric Heilman, Statistics teacher, Georgetown Preparatory School
“Buried under mountains of data? Let Michael Milton be your guide as you fill your toolbox with the analytical skills that give you an edge. In Head First Data Analysis, you’ll learn how to turn raw numbers into real knowledge. Put away your Ouija board and tarot cards; all you need to make good decisions is some software and a copy of this book.”
Pra ise for ot he r H e a d First
book s
“Kathy and Bert’s Head First Java transforms the printed page into the closest thing to a GUI you’ve ever seen. In a wry, hip manner, the authors make learning Java an engaging ‘what’re they gonna do next?’ experience.”
—Warren Keuffel, Software Development Magazine
“Beyond the engaging style that drags you forward from know-nothing into exalted Java warrior status, Head First Java covers a huge amount of practical matters that other texts leave as the dreaded “exercise for the
reader...” It’s clever, wry, hip and practical—there aren’t a lot of textbooks that can make that claim and live up to it while also teaching you about object serialization and network launch protocols.”
—Dr. Dan Russell, Director of User Sciences and Experience Research IBM Almaden Research Center (and teacher of Artificial Intelligence at Stanford University)
“It’s fast, irreverent, fun, and engaging. Be careful—you might actually learn something!”
—Ken Arnold, former Senior Engineer at Sun Microsystems
Coauthor (with James Gosling, creator of Java), The Java Programming Language
“I feel like a thousand pounds of books have just been lifted off of my head.”
—Ward Cunningham, inventor of the Wiki and founder of the Hillside Group
“Just the right tone for the geeked-out, casual-cool guru coder in all of us. The right reference for practi-cal development strategies—gets my brain going without having to slog through a bunch of tired stale professor -speak.”
—Travis Kalanick, Founder of Scour and Red Swoosh Member of the MIT TR100
“There are books you buy, books you keep, books you keep on your desk, and thanks to O’Reilly and the Head First crew, there is the ultimate category, Head First books. They’re the ones that are dog-eared, mangled, and carried everywhere. Head First SQL is at the top of my stack. Heck, even the PDF I have for review is tattered and torn.”
— Bill Sawyer, ATG Curriculum Manager, Oracle
“This book’s admirable clarity, humor and substantial doses of clever make it the sort of book that helps even non-programmers think well about problem-solving.”
— Cory Doctorow, co-editor of BoingBoing Author, Down and Out in the Magic Kingdom
fun, but they cover a lot of ground and they are right to the point. I’m really impressed.”
— Erich Gamma, IBM Distinguished Engineer, and co-author of Design Patterns
“One of the funniest and smartest books on software design I’ve ever read.”
— Aaron LaBerge, VP Technology, ESPN.com
“What used to be a long trial and error learning process has now been reduced neatly into an engaging paperback.”
— Mike Davidson, CEO, Newsvine, Inc.
“Elegant design is at the core of every chapter here, each concept conveyed with equal doses of pragmatism and wit.”
— Ken Goldstein, Executive Vice President, Disney Online
“I ♥ Head First HTML with CSS & XHTML—it teaches you everything you need to learn in a ‘fun coated’ format.”
— Sally Applin, UI Designer and Artist
“Usually when reading through a book or article on design patterns, I’d have to occasionally stick myself in the eye with something just to make sure I was paying attention. Not with this book. Odd as it may sound, this book makes learning about design patterns fun.
“While other books on design patterns are saying ‘Buehler… Buehler… Buehler…’ this book is on the float belting out ‘Shake it up, baby!’”
— Eric Wuehler
“I literally love this book. In fact, I kissed this book in front of my wife.”
Ot he r re lat e d book s from O’Re illy
Analyzing Business Data with Excel
Excel Scientific and Engineering Cookbook Access Data Analysis Cookbook
Ot he r book s in O’Re illy’s H e a d First se rie s
Head First Java
Head First Object-Oriented Analysis and Design (OOA&D) Head First HTML with CSS and XHTML
Head First Design Patterns Head First Servlets and JSP Head First EJB
Head First PMP Head First SQL
Head First Software Development Head First JavaScript
Head First Ajax Head First Physics Head First Statistics Head First Rails
Beijing • Cambridge • Farnham • Kln • Sebastopol • Taipei • Tokyo
Wouldn’t it be dreamy if there was a book on data analysis that wasn’t just a glorified printout of Microsoft Excel help files? But it’s
probably just a fantasy...
H e a d First Dat a Ana lysis by Michael Milton
Copyright © 2009 Michael Milton. All rights reserved.
Printed in the United States of America.
Published by O’Reilly Media, Inc., 1005 Gravenstein Highway North, Sebastopol, CA 95472.
O’Reilly Media books may be purchased for educational, business, or sales promotional use. Online editions are also available for most titles (safari.oreilly.com). For more information, contact our corporate/institutional sales department: (800) 998-9938 or [email protected].
Se rie s Cre at ors: Kathy Sierra, Bert Bates
Se rie s Edit or: Brett D. McLaughlin
Edit or: Brian Sawyer
Cove r De signe rs: Karen Montgomery
Produc t ion Edit or: Scott DeLugan
Proofre a de r: Nancy Reinhardt
I ndexe r: Jay Harward
Pa ge V ie w e rs: Mandarin, the fam, and Preston
Print ing H ist or y:
July 2009: First Edition.
The O’Reilly logo is a registered trademark of O’Reilly Media, Inc. The Head First series designations,
Head First Data Analysis and related trade dress are trademarks of O’Reilly Media, Inc.
Many of the designations used by manufacturers and sellers to distinguish their products are claimed as trademarks. Where those designations appear in this book, and O’Reilly Media, Inc., was aware of a trademark claim, the designations have been printed in caps or initial caps.
While every precaution has been taken in the preparation of this book, the publisher and the authors assume no responsibility for errors or omissions, or for damages resulting from the use of the information contained herein.
No data was harmed in the making of this book.
This book uses RepKover™, a durable and flexible lay-flat binding. TM
The fam
Preston
the author
Author of Head First Data Analysis
Michael Milton
has spent most of his career helping nonprofit organizations improve their fundraising by interpreting and acting on the data they collect from their donors.He has a degree in philosophy from New College of Florida and one in religious ethics from Yale University. He found reading Head First to be a revelation after spending years reading boring books filled with terribly important stuff and is grateful to have the opportunity to write an exciting book filled with terribly important stuff.
When he’s not in the library or the bookstore, you can find him running, taking pictures, and brewing beer.
Table of Contents (the real thing)
Your brain on data analysis.
H e re you are trying to learn something, while here your brain is doing you a favor by making sure the learning doesn’t stick.Your brain’s thinking, “Better leave room for more important things, like which wild
animals to avoid and whether naked snowboarding is a bad idea.” So how do you
trick your brain into thinking that your life depends on knowing data analysis?
I nt ro
Who is this book for? xxviii
We know what you’re thinking xxix
Metacognition xxxi
Bend your brain into submission xxxiii
Read Me xxxiv
The technical review team xxxvi
Acknowledgments xxxvii
Table of Contents (Summary)
Intro xxvii
1 Introduction to Data Analysis: Break It Down 1 2 Experiments: Test Your Theories 37 3 Optimization: Take It to the Max 75 4 Data Visualization: Pictures Make You Smarter 111 5 Hypothesis Testing: Say It Ain’t So 139 6 Bayesian Statistics: Get Past First Base 169 7 Subjective Probabilities: Numerical Belief 191 8 Heuristics: Analyze Like a Human 225 9 Histograms: The Shape of Numbers 251
10 Regression: Prediction 279
11 Error: Err Well 315
12 Relational Databases: Can You Relate? 359 13 Cleaning Data: Impose Order 385 i Leftovers: The Top Ten Things (We Didn’t Cover) 417
ii Install R: Start R Up! 427
table of contents
Acme Cosmetics needs your help 2
The CEO wants data analysis to help increase sales 3
Data analysis is careful thinking about evidence 4
Define the problem 5
Your client will help you define your problem 6
Acme’s CEO has some feedback for you 8
Break the problem and data into smaller pieces 9
Now take another look at what you know 10
Evaluate the pieces 13
Analysis begins when you insert yourself 14
Make a recommendation 15
Your report is ready 16
The CEO likes your work 17
An article just came across the wire 18
You let the CEO’s beliefs take you down the wrong path 20
Your assumptions and beliefs about the world are your mental model 21
Your statistical model depends on your mental model 22
Mental models should always include what you don’t know 25
The CEO tells you what he doesn’t know 26
Acme just sent you a huge list of raw data 28
Time to drill further into the data 31
General American Wholesalers confirms your impression 32
Here’s what you did 35
Your analysis led your client to a brilliant decision 36
Bre a k it dow n
1
introduction to data analysis
Data is everywhere.
Nowadays, everyone has to deal with mounds of data, whether they call themselves “data analysts” or not. But people who possess a toolbox of data analysis skills have a massive edge on everyone else, because they understand what to do with all that stuff. They know how to translate raw numbers into
intelligence that drives real-world action. They know how to break down and structure complex problems and data sets to get right to the heart of the problems in their business.
Te st your t he orie s
Can you show what you believe?
In a real empirical test? There’s nothing like a good experiment to solve your problems and show you the way the world really works. Instead of having to rely exclusively on your observational data, a well-executed experiment can often help you make causal connections. Strong empirical data will make your analytical judgments all the more powerful.
experiments
2
It’s a coffee recession! 38
The Starbuzz board meeting is in three months 39
The Starbuzz Survey 41
Always use the method of comparison 42
Comparisons are key for observational data 43
Could value perception be causing the revenue decline? 44
A typical customer’s thinking 46
Observational studies are full of confounders 47
How location might be confounding your results 48
Manage confounders by breaking the data into chunks 50
It’s worse than we thought! 53
You need an experiment to say which strategy will work best 54
The Starbuzz CEO is in a big hurry 55
Starbuzz drops its prices 56
One month later… 57
Control groups give you a baseline 58
Not getting fired 101 61
Let’s experiment again for real! 62
One month later… 63
Confounders also plague experiments 64
Avoid confounders by selecting groups carefully 65
Randomization selects similar groups 67
Randomness Exposed 68
Your experiment is ready to go 71
The results are in 72
Starbuzz has an empirically tested sales strategy 73 Economy
People have less money
People think Starbuzz is less of a value
Starbuzz sales go down People are still
rich
Starbuzz is still a value
table of contents
You’re now in the bath toy game 76
Constraints limit the variables you control 79
Decision variables are things you can control 79
You have an optimization problem 80
Find your objective with the objective function 81
Your objective function 82
Show product mixes with your other constraints 83
Plot multiple constraints on the same chart 84
Your good options are all in the feasible region 85
Your new constraint changed the feasible region 87
Your spreadsheet does optimization 90
Solver crunched your optimization problem in a snap 94
Profits fell through the floor 97
Your model only describes what you put into it 98
Calibrate your assumptions to your analytical objectives 99
Watch out for negatively linked variables 103
Your new plan is working like a charm 108
Your assumptions are based on an ever-changing reality 109
Ta ke it t o t he m a x
3
optimization
We all want more of something.
And we’re always trying to figure out how to get it. If the things we want more of—
profit, money, efficiency, speed—can be represented numerically, then chances are, there’s an tool of data analysis to help us tweak our decision variables, which will help us find the solution or optimal point where we get the most of what we want. In this chapter, you’ll be using one of those tools and the powerful spreadsheet Solver package that implements it.
0 100 200 300 400
100 200 300 400
D
ucks
0 10 20 30 40
You need more than a table of numbers.
Your data is brilliantly complex, with more variables than you can shake a stick at. Mulling over mounds and mounds of spreadsheets isn’t just boring; it can actually be a waste of your time. A clear, highly multivariate visualization can, in a small space, show you the forest that you’d miss for the trees if you were just looking at spreadsheets all the time.
data visualization
4
New Army needs to optimize their website 112
The results are in, but the information designer is out 113
The last information designer submitted these three infographics 114
What data is behind the visualizations? 115
Show the data! 116
Here’s some unsolicited advice from the last designer 117
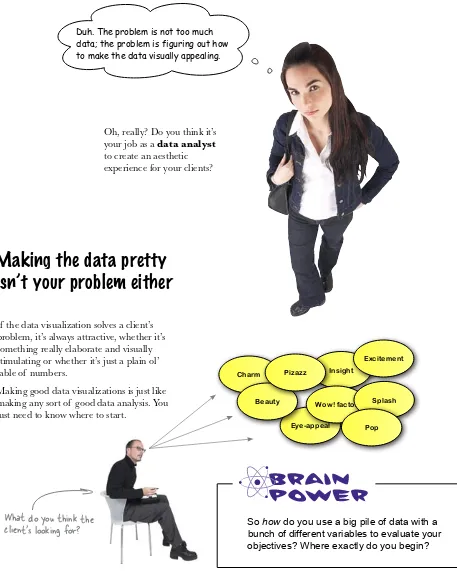
Too much data is never your problem 118
Making the data pretty isn’t your problem either 119
Data visualization is all about making the right comparisons 120
Your visualization is already more useful than the rejected ones 123
Use scatterplots to explore causes 124
The best visualizations are highly multivariate 125
Show more variables by looking at charts together 126
The visualization is great, but the web guru’s not satisfied yet 130
Good visual designs help you think about causes 131
The experiment designers weigh in 132
The experiment designers have some hypotheses of their own 135
The client is pleased with your work 136
table of contents
Gimme some skin… 140
When do we start making new phone skins? 141
PodPhone doesn’t want you to predict their next move 142
Here’s everything we know 143
ElectroSkinny’s analysis does fit the data 144
ElectroSkinny obtained this confidential strategy memo 145
Variables can be negatively or positively linked 146
Causes in the real world are networked, not linear 149
Hypothesize PodPhone’s options 150
You have what you need to run a hypothesis test 151
Falsification is the heart of hypothesis testing 152
Diagnosticity helps you find the hypothesis with the least disconfirmation 160
You can’t rule out all the hypotheses, but you can say which is strongest 163
You just got a picture message… 164
It’s a launch! 167
Sa y it a in’t so
5
The world can be tricky to explain.
hypothesis testing
And it can be fiendishly difficult when you have to deal with complex,
Ge t pa st first ba se
You’ll always be collecting new data.
And you need to make sure that every analysis you do incorporates the data you have that’s relevant to your problem. You’ve learned how falsification can be used to deal with heterogeneous data sources, but what about straight up probabilities? The answer involves an extremely handy analytic tool called Bayes’ rule, which will help you incorporate your base rates to uncover not-so-obvious insights with ever-changing data.
bayesian statistics
6
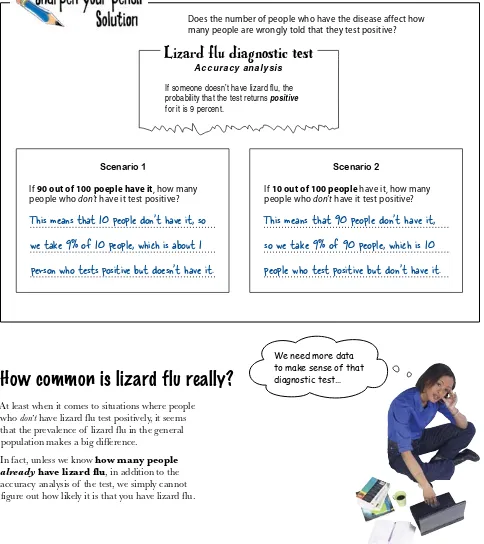
The doctor has disturbing news 170
Let’s take the accuracy analysis one claim at a time 173
How common is lizard flu really? 174
You’ve been counting false positives 175
All these terms describe conditional probabilities 176
You need to count false positives, true positives, false negatives, and true negatives 177
1 percent of people have lizard flu 178
Your chances of having lizard flu are still pretty low 181
Do complex probabilistic thinking with simple whole numbers 182
Bayes’ rule manages your base rates when you get new data 182
You can use Bayes’ rule over and over 183
Your second test result is negative 184
The new test has different accuracy statistics 185
New information can change your base rate 186
What a relief ! 189
table of contents
7
Backwater Investments needs your help 192
Their analysts are at each other’s throats 193
Subjective probabilities describe expert beliefs 198
Subjective probabilities might show no real disagreement after all 199
The analysts responded with their subjective probabilities 201
The CEO doesn’t see what you’re up to 202
The CEO loves your work 207
The standard deviation measures how far points are from the average 208
You were totally blindsided by this news 213
Bayes’ rule is great for revising subjective probabilities 217
The CEO knows exactly what to do with this new information 223
Russian stock owners rejoice! 224
N um e ric a l be lie f
subjective probabilities
Sometimes, it’s a good idea to make up numbers.
Seriously. But only if those numbers describe your own mental states, expressing your beliefs. Subjective probability is a straightforward way of injecting some real rigor into your hunches, and you’re about to see how. Along the way, you are going to learn how to evaluate the spread of data using standard deviation and enjoy a special guest appearance from one of the more powerful analytic tools you’ve learned.Let’s hope
The news about selling
the oil fields.
Time
Your first analysis of
subjective probabilities.
8
Ana lyze like a hum a n
The real world has more variables than you can handle.
There is always going to be data that you can’t have. And even when you do have data on most of the things you want to understand, optimizing methods are often elusive and time consuming. Fortunately, most of the actual thinking you do in life is not “rational maximizing”—it’s processing incomplete and uncertain information with rules of thumb so that you can make decisions quickly. What is really cool is that these rules can actually work and are important (and necessary) tools for data analysts.heuristics
LitterGitters submitted their report to the city council 226
The LitterGitters have really cleaned up this town 227
The LitterGitters have been measuring their campaign’s effectiveness 228
The mandate is to reduce the tonnage of litter 229
Tonnage is unfeasible to measure 230
Give people a hard question, and they’ll answer an easier one instead 231
Littering in Dataville is a complex system 232
You can’t build and implement a unified litter-measuring model 233
Heuristics are a middle ground between going with your gut and optimization 236
Use a fast and frugal tree 239
Is there a simpler way to assess LitterGitters’ success? 240
Stereotypes are heuristics 244
Your analysis is ready to present 246
table of contents
Your annual review is coming up 252
Going for more cash could play out in a bunch of different ways 254
Here’s some data on raises 255
Histograms show frequencies of groups of numbers 262
Gaps between bars in a histogram mean gaps among the data points 263
Install and run R 264
Load data into R 265
R creates beautiful histograms 266
Make histograms from subsets of your data 271
Negotiation pays 276
What will negotiation mean for you? 277
T he sha pe of num be rs
9
histograms
How much can a bar graph tell you?
There are about a zillion ways of showing data with pictures, but one of them is special. Histograms, which are kind of similar to bar graphs, are a super-fast and easy way to summarize data. You’re about to use these powerful little charts to measure your data’s spread, variability, central tendency, and more. No matter how large your data set is, if you draw a histogram with it, you’ll be able to “see” what’s happening inside of it. And you’re about to do it with a new, free, crazy-powerful software tool.
Negotiate
Pre dic t ion
Predict it.
Regression is an incredibly powerful statistical tool that, when used correctly, has the ability to help you predict certain values. When used with a controlled experiment, regression can actually help you predict the future. Businesses use it like crazy to help them build models to explain customer behavior. You’re about to see that the judicious use of regression can be very profitable indeed.
regression
10
What are you going to do with all this money? 280
An analysis that tells people what to ask for could be huge 283
Behold… the Raise Reckoner! 284
Inside the algorithm will be a method to predict raises 286
Scatterplots compare two variables 292
A line could tell your clients where to aim 294
Predict values in each strip with the graph of averages 297
The regression line predicts what raises people will receive 298
The line is useful if your data shows a linear correlation 300
You need an equation to make your predictions precise 304
Tell R to create a regression object 306
The regression equation goes hand in hand with your scatterplot 309
The regression equation is the Raise Reckoner algorithm 310
Your raise predictor didn’t work out as planned… 313
Request
table of contents
Your clients are pretty ticked off 316
What did your raise prediction algorithm do? 317
The segments of customers 318
The guy who asked for 25% went outside the model 321
How to handle the client who wants a prediction outside the data range 322
The guy who got fired because of extrapolation has cooled off 327
You’ve only solved part of the problem 328
What does the data for the screwy outcomes look like? 329
Chance errors are deviations from what your model predicts 330
Error is good for you and your client 334
Chance Error Exposed 335
Specify error quantitatively 336
Quantify your residual distribution with Root Mean Squared error 337
Your model in R already knows the R.M.S. error 338
R’s summary of your linear model shows your R.M.S. error 340
Segmentation is all about managing error 346
Good regressions balance explanation and prediction 350
Your segmented models manage error better than the original model 352
Your clients are returning in droves 357
Err w e ll
11
The world is messy.
error
The Dataville Dispatch wants to analyze sales 360
Here’s the data they keep to track their operations 361
You need to know how the data tables relate to each other 362
A database is a collection of data with well-specified relations to each other 365
Trace a path through the relations to make the comparison you need 366
Create a spreadsheet that goes across that path 366
Your summary ties article count and sales together 371
Looks like your scatterplot is going over really well 374
Copying and pasting all that data was a pain 375
Relational databases manage relations for you 376
Dataville Dispatch built an RDBMS with your relationship diagram 377
Dataville Dispatch extracted your data using the SQL language 379
Comparison possibilities are endless if your data is in a RDBMS 382
You’re on the cover 383
Ca n you re lat e ?
table of contents
xxii
Just got a client list from a defunct competitor 386
The dirty secret of data analysis 387
Head First Head Hunters wants the list for their sales team 388
Cleaning messy data is all about preparation 392
Once you’re organized, you can fix the data itself 393
Use the # sign as a delimiter 394
Excel split your data into columns using the delimiter 395
Use SUBSTITUTE to replace the carat character 399
You cleaned up all the first names 400
The last name pattern is too complex for SUBSTITUTE 402
Handle complex patterns with nested text formulas 403
R can use regular expressions to crunch complex data patterns 404
The sub command fixed your last names 406
Now you can ship the data to your client 407
Maybe you’re not quite done yet… 408
Sort your data to show duplicate values together 409
The data is probably from a relational database 412
Remove duplicate names 413
You created nice, clean, unique records 414
Head First Head Hunters is recruiting like gangbusters! 415
Leaving town... 416
I m pose orde r
13
Your data is useless…
cleaning data
…if it has messy structure. And a lot of people who collect data do a crummy job
of maintaining a neat structure. If your data’s not neat, you can’t slice it or dice it, run formulas on it, or even really see it. You might as well just ignore it completely, right? Actually, you can do better. With a clear vision of how you need it to look and a few text manipulation tools, you can take the funkiest, craziest mess of data and whip it into something useful.
Clean and
T he Top Te n T hings (w e didn’t c ove r)
You’ve come a long way.
But data analysis is a vast and constantly evolving field, and there’s so much left the learn. In this appendix, we’ll go over ten items that there wasn’t enough room to cover in this book but should be high on your list of topics to learn about next.
leftovers
i
#1: Everything else in statistics 418
#2: Excel skills 419
#3: Edward Tufte and his principles of visualization 420
#4: PivotTables 421
#5: The R community 422
#6: Nonlinear and multiple regression 423
#7: Null-alternative hypothesis testing 424
#8: Randomness 424
#9: Google Docs 425
#10: Your expertise 426
Statistics not covered in
Head First Data Analysis
Tests of significance
The null and the alternative
t-Test
Chi Squared Test
z-Test
Chance variability
The law of averages
table of contents
Get started with R 428
St a r t R up!
ii
install r
Behind all that data-crunching power is enormous
complexity.
But fortunately, getting R installed and startedis something you can accomplish in
T he ToolPa k
Some of the best features of Excel aren’t installed by
default.
That’s right, in order to run the optimization from Chapter 3 and the histograms from Chapter 9, you need to activate the Solver and the Analysis ToolPak, two extensions that are included in Excel by default but not activated without your initiative.
install excel analysis tools
iii
I nt ro
In this section we answer the burning ques
tion:
“So why DID they put that in a data ana
lysis book?”
I can’t believe
they put
that
in adata analysis book.
I s t his book for you?
how to use this book
Who is this book for?
Who should probably back away from this book?
If you can answer “yes” to all of these:
If you can answer “yes” to any of these: this book is for you.
this book is not for you.
[Note from marketing: this book is
for anyone with a credit card.]
Do you prefer stimulating dinner party conversation to dry, dull, academic lectures?
3
Do you want to learn, understand, and remember how to create brilliant graphics, test hypotheses, run a regression, or clean up messy data?
2
Have you never loaded and used Microsoft Excel or OpenOffice calc?
2
Do you feel like there’s a world of insights buried in your data that you’d only be able to access if you had the right tools?
1
Are you a seasoned, brilliant data analyst looking for a survey of bleeding edge data topics?
1
Are you afraid to try something different? Would you rather have a root canal than mix stripes with plaid? Do you believe that a technical book can’t be serious if it anthropomorphizes control groups and objective functions?
“How can this be a serious data analysis book?” “What’s with all the graphics?”
“Can I actually learn it this way?”
Your brain craves novelty. It’s always searching, scanning, waiting for something unusual. It was built that way, and it helps you stay alive.
So what does your brain do with all the routine, ordinary, normal things you encounter? Everything it can to stop them from interfering with the brain’s real job—recording things that matter. It doesn’t bother saving the boring things; they never make it past the “this is obviously not important” filter.
How does your brain know what’s important? Suppose you’re out for a day hike and a tiger jumps in front of you, what happens inside your head and body?
Neurons fire. Emotions crank up. Chemicals surge. And that’s how your brain knows...
T his m ust be im por t a nt ! Don’t forge t it !
But imagine you’re at home, or in a library. It’s a safe, warm, tiger-free zone. You’re studying. Getting ready for an exam. Or trying to learn some tough
technical topic your boss thinks will take a week, ten days at the most. Just one problem. Your brain’s trying to do you a big favor. It’s trying to make sure that this obviously non-important content doesn’t clutter up scarce resources. Resources that are better spent storing the really big things. Like tigers. Like the danger of fire. Like how you should never have posted those “party” photos on your Facebook page. And there’s no simple way to tell your brain, “Hey brain, thank you very much, but no matter how dull this book is, and how little I’m registering on the emotional Richter scale right now, I really do want you to keep this stuff around.”
We know what you’re thinking
We know what your brain is thinking
Your brain think
s
THIS is imp
ortant.
Your brain think
s
THIS isn’t w
orth
saving.
how to use this book
So what does it take to learn something? F
irst, you have to get it, then make sure you
don’t forget it. It’s not about pushing facts into y
our head. Based on the latest research
in cognitive science, neurobiology, and educa
tional psychology, learning takes a lot
more than text on a page. We know what turns y
our brain on.
Som e of t he H e a d First le a r ning princ ip le s:
M a ke it visua l. Images are far more memor
able than words alone, and make learning
much more effective (up to 89 percent improv
ement in recall and transfer studies). It also
makes things more understandable. Put t he w or ds w
it hin or ne a r t he gra phic s
they relate to, rather than on the bottom or on another page
, and learners will be up to
twice as likely to solve problems related to the conten t.
U se a c onve r sa tiona l a nd pe r son
a lize d st yle . In recent studies, students performed up to
40 percent better on post-learning tests if the c
ontent spoke directly to the reader, using a first -person,
conversational style rather than taking a formal tone. Tell stories inst
ead of lecturing. Use casual language.
Don’t take yourself too seriously. Which w
ould you pay more attention to: a stimulating dinner par ty
companion, or a lecture?
Ge t t he le a r ne r t o t hink m ore dee ply.
In other words, unless you actively
flex your neurons, nothing much happens in y
our head. A reader has to be motivated,
engaged, curious, and inspired to solve problems
, draw conclusions, and generate new
knowledge. And for that, you need challenges
, exercises, and thought-provoking questions ,
and activities that involve both sides of the br
ain and multiple senses.
Ge t —a nd ke e p—the re a de r’s a t t ent ion.
We’ve all had the “I really want to learn this but I can ’t stay
awake past page one” experience. Your brain pays attention to things tha
t are out of the ordinary, interesting,
strange, eye-catching, unexpected. Learning a new
, tough, technical topic doesn’t have to be boring. Your
brain will learn much more quickly if it’s not.
Touc h t he ir e m ot ions. We now know that y
our ability to remember something
is largely dependent on its emotional content. You remember wha
t you care about.
You remember when you feel something. No, we’r
e not talking heart-wrenching
stories about a boy and his dog. We’re talking emotions like sur
prise, curiosity, fun,
“what the...?” , and the feeling of “I Rule!” tha
t comes when you solve a puzzle, learn
something everybody else thinks is hard, or realize you kno
w something that “I’m
more technical than thou” Bob from engineer
ing doesn’t.
Metacognition: thinking about thinking
I wonder how I can trick my brain into remembering this stuff...
If you really want to learn, and you want to learn more quickly and more deeply, pay attention to how you pay attention. Think about how you think. Learn how you learn.
Most of us did not take courses on metacognition or learning theory when we were growing up. We were expected to learn, but rarely taught to learn.
But we assume that if you’re holding this book, you really want to learn data analysis. And you probably don’t want to spend a lot of time. If you want to use what you read in this book, you need to remember what you read. And for that, you’ve got to understand it. To get the most from this book, or any book or learning experience, take responsibility for your brain. Your brain on this content.
The trick is to get your brain to see the new material you’re learning as Really Important. Crucial to your well-being. As important as a tiger. Otherwise, you’re in for a constant battle, with your brain doing its best to keep the new content from sticking.
So just how DO you ge t your bra in t o t re at dat a a na lysis like it w a s a hungr y t ige r?
There’s the slow, tedious way, or the faster, more effective way. The
slow way is about sheer repetition. You obviously know that you are able to learn and remember even the dullest of topics if you keep pounding the same thing into your brain. With enough repetition, your brain says, “This doesn’t feel important to him, but he keeps looking at the same thing over and over and over, so I suppose it must be.”
The faster way is to do anything that increases brain activity, especially different types of brain activity. The things on the previous page are a big part of the solution, and they’re all things that have been proven to help your brain work in your favor. For example, studies show that putting words within the pictures they describe (as opposed to somewhere else in the page, like a caption or in the body text) causes your brain to try to makes sense of how the words and picture relate, and this causes more neurons to fire. More neurons firing = more chances for your brain to get that this is something worth paying attention to, and possibly recording.
A conversational style helps because people tend to pay more attention when they perceive that they’re in a conversation, since they’re expected to follow along and hold up their end. The amazing thing is, your brain doesn’t necessarily care that the “conversation” is between you and a book! On the other hand, if the writing style is formal and dry, your brain perceives it the same way you experience being lectured to while sitting in a roomful of passive attendees. No need to stay awake.
how to use this book
Here’s what WE did:
We used pictures, because your brain is tuned for visuals, not text. As far as your brain’s concerned, a picture really is worth a thousand words. And when text and pictures work together, we embedded the text in the pictures because your brain works more effectively when the text is within the thing the text refers to, as opposed to in a caption or buried in the text somewhere.
We used redundancy, saying the same thing in different ways and with different media types, and multiple senses, to increase the chance that the content gets coded into more than one area of your brain.
We used concepts and pictures in unexpected ways because your brain is tuned for novelty, and we used pictures and ideas with at least some emotional content, because your brain is tuned to pay attention to the biochemistry of emotions. That which causes you to feel something is more likely to be remembered, even if that feeling is nothing more than a little humor, surprise, or interest.
We used a personalized, conversational style, because your brain is tuned to pay more attention when it believes you’re in a conversation than if it thinks you’re passively listening to a presentation. Your brain does this even when you’re reading.
We included more than 80 activities, because your brain is tuned to learn and remember more when you do things than when you read about things. And we made the exercises challenging-yet-do-able, because that’s what most people prefer.
We used multiple learning styles, because you might prefer step-by-step procedures, while someone else wants to understand the big picture first, and someone else just wants to see an example. But regardless of your own learning preference, everyone benefits from seeing the same content represented in multiple ways.
We include content for both sides of your brain, because the more of your brain you engage, the more likely you are to learn and remember, and the longer you can stay focused. Since working one side of the brain often means giving the other side a chance to rest, you can be more productive at learning for a longer period of time.
And we included stories and exercises that present more than one point of view, because your brain is tuned to learn more deeply when it’s forced to make evaluations and judgments.
We included challenges, with exercises, and by asking questions that don’t always have a straight answer, because your brain is tuned to learn and remember when it has to work at something. Think about it—you can’t get your body in shape just by watching people at the gym. But we did our best to make sure that when you’re working hard, it’s on the right things. That you’re not spending one extra dendrite processing a hard-to-understand example, or parsing difficult, jargon-laden, or overly terse text.
So, we did our part. The rest is up to you. These tips are a starting point; listen to your brain and figure out what works for you and what doesn’t. Try new things.
6 Drink w at e r. Lot s of it .
Your brain works best in a nice bath of fluid. Dehydration (which can happen before you ever feel thirsty) decreases cognitive function.
9 Ge t your ha nds dir t y!
There’s only one way to learn data analysis: get your hands dirty. And that’s what you’re going to do throughout this book. Data analysis is a skill, and the only way to get good at it is to practice. We’re going to give you a lot of practice: every chapter has exercises that pose a problem for you to solve. Don’t just skip over them—a lot of the learning happens when you solve the exercises. We included a solution to each exercise—don’t be afraid to peek at the solution if you get stuck! (It’s easy to get snagged on something small.) But try to solve the problem before you look at the solution. And definitely get it working before you move on to the next part of the book.
8 Fe e l som e t hing.
Your brain needs to know that this matters. Get involved with the stories. Make up your own captions for the photos. Groaning over a bad joke is still better than feeling nothing at all.
7 List e n t o your bra in.
Pay attention to whether your brain is getting overloaded. If you find yourself starting to skim the surface or forget what you just read, it’s time for a break. Once you go past a certain point, you won’t learn faster by trying to shove more in, and you might even hurt the process.
5 Ta lk a bout it . Out loud.
Speaking activates a different part of the brain. If you’re trying to understand something, or increase your chance of remembering it later, say it out loud. Better still, try to explain it out loud to someone else. You’ll learn more quickly, and you might uncover ideas you hadn’t known were there when you were reading about it.
4 M a ke t his t he la st t hing you re a d be fore be d. Or at le a st t he la st cha lle nging t hing.
Part of the learning (especially the transfer to long-term memory) happens after you put the book down. Your brain needs time on its own, to do more processing. If you put in something new during that processing time, some of what you just learned will be lost.
3 Re a d t he “T he re a re N o Dum b Que st ions” That means all of them. They’re not optional
sidebars, they’re part of the core content! Don’t skip them.
Cut this out and stick it
on your refrigerator.
Here’s what YOU can do to bend
your brain into submission
2 Do t he exe rc ise s. Writ e your ow n not e s.
We put them in, but if we did them for you, that would be like having someone else do your workouts for you. And don’t just look at the exercises. Use a pencil. There’s plenty of evidence that physical activity while learning can increase the learning. Don’t just read. Stop and think. When the book asks you a question, don’t just skip to the answer. Imagine that someone really is asking the question. The more deeply you force your brain to think, the better chance you have of learning and remembering. Slow dow n. T he m ore you unde rst a nd, t he le ss you have t o m e m orize .
how to use this book
Read Me
This is a learning experience, not a reference book. We deliberately stripped out everything that might get in the way of learning whatever it is we’re working on at that point in the book. And the first time through, you need to begin at the beginning, because the book makes assumptions about what you’ve already seen and learned.
T his book is not a bout soft w a re t ools.
Many books with “data analysis” in their titles simply go down the list of Excel functions considered to be related to data analysis and show you a few examples of each. Head First Data Analysis, on the other hand, is about how to be a data analyst. You’ll learn quite a bit about software tools in this book, but they are only a means to the end of learning how to do good data analysis.
We ex pe c t you t o k now how t o use ba sic spre a dshe e t for m ula s.
Have you ever used the SUM formula in a spreadsheet? If not, you may want to bone up on spreadsheets a little before beginning this book. While many chapters do not ask you to use spreadsheets at all, the ones that do assume that you know how to use formulas. If you are familiar with the SUM formula, then you’re in good shape.
T his book is a bout m ore t ha n st at ist ic s.
There’s plenty of statistics in this book, and as a data analyst you should learn as much statistics as you can. Once you’re finished with Head First Data Analysis, it’d be a good idea to read Head First Statistics as well. But “data analysis” encompasses statistics and a number of other fields, and the many non-statistical topics chosen for this book are focused on the practical, nitty-gritty experience of doing data analysis in the real world.
T he a c t ivit ie s a re N OT opt iona l.
only thing you don’t have to do, but they’re good for giving your brain a chance to think about the words and terms you’ve been learning in a different context.
T he re dunda ncy is int e nt iona l a nd im por t a nt .
One distinct difference in a Head First book is that we want you to really get it. And we want you to finish the book remembering what you’ve learned. Most reference books don’t have retention and recall as a goal, but this book is about learning, so you’ll see some of the same concepts come up more than once.
T he book doe sn’t e nd he re .
We love it when you can find fun and useful extra stuff on book companion sites. You’ll find extra stuff on data analysis at the following url:
http://www.headfirstlabs.com/books/hfda/.
T he Bra in Pow e r exe rc ise s don’t have a nsw e rs.
the review team the review team
Eric Heilman graduated Phi Beta Kappa from the Walsh School of Foreign Service at Georgetown University with a degree in International Economics. During his time as an undergraduate in DC, he worked at the State Department and at the National Economic Council at the White House. He completed his graduate work in economics at the University of Chicago. He currently teaches statistical analysis and math at Georgetown Preparatory School in Bethesda, MD.
Bill Mietelski is a Software Engineer and a three-time Head First technical reviewer. He can’t wait to run a data analysis on his golf stats to help him win on the links.
Anthony Rose has been working in the data analysis field for nearly ten years and is currently the president of Support Analytics, a data analysis and visualization consultancy. Anthony has an MBA concentrated in Management and Finance degree, which is where his passion for data and analysis started. When he isn’t working, he can normally be found on the golf course in Columbia, Maryland, lost in a good book, savoring a delightful wine, or simply enjoying time with his young girls and amazing wife.
Technical Reviewers:
Bill Mietelski
Tony Rose
Eric Heilman
Acknowledgments
Brett McLaughlin
My editor:Brian Sawyer has been an incredible editor. Working with Brian is like dancing with a professional ballroom dancer. All sorts of important stuff is happening that you don’t really understand, but you look great, and you’re having a blast. Ours has been a exciting collaboration, and his support, feedback, and ideas have been invaluable.
The O’Reilly Team:
Brett McLaughlin saw the vision for this project from the beginning, shepherded it through tough times, and has been a constant support. Brett’s implacable focus on your experience with the Head First books is an inspiration. He is the man with the plan.
Karen Shaner provided logistical support and a good bit of cheer on some cold Cambridge mornings. Brittany Smith contributed some cool graphic elements that we used over and over.
Really smart people whose ideas are remixed in this book: While many of big ideas taught in this book are unconventional for books with “data analysis” in the title, few of them are uniquely my own. I drew heavily from the writings of these intellectual superstars: Dietrich Doerner, Gerd Gigerenzer, Richards Heuer, and Edward Tufte. Read them all! The idea of the anti-resume comes from Nassim Taleb’s The Black Swan (if there’s a Volume 2, expect to see more of his ideas). Richards Heuer kindly corresponded with me about the book and gave me a number of useful ideas. Friends and colleagues:
Lou Barr’s intellectual, moral, logistical, and aesthetic support of this book is much appreciated. Vezen Wu taught me the relational model.
Aron Edidin sponsored an awesome tutorial for me on intelligence analysis when I was an undergraduate. My poker group—Paul,
Brewster, Matt, Jon, and Jason—has given me an expensive education in the balance of heuristic and optimizing decision frameworks.
People I couldn’t live without:
The technical review team did a brilliant job, caught loads of errors, made a bunch of good suggestions, and were tremendously supportive. As I wrote this book, I leaned heavily on my friend Blair Christian, who
is a statistician and deep thinker. His influence can be found on every page. Thank you for everything, Blair.
My family, Michael Sr., Elizabeth, Sara, Gary, and Marie, have been tremendously supportive. Above all, I appreciate the steadfast support of my wife Julia, who means everything. Thank you all!
Brian Sawyer
Blair and Niko Christian
safari books online
Safari® Books Online
When you see a Safari® icon on the cover of your favorite technology book that means the book is available online through the O’Reilly Network Safari Bookshelf.
Break it dow n
Data is everywhere.
Nowadays, everyone has to deal with mounds of data, whether they call themselves “data analysts” or not. But people who possess a toolbox of data analysis skills have a massive edge on everyone else, because they understand what to do with all that stuff. They know
how to translate raw numbers into intelligence that drives real-world action. They know how to break down and structure complex problems and data sets to get right to the heart of the problems in their business.
sales are off
Acme Cosmetics needs your help
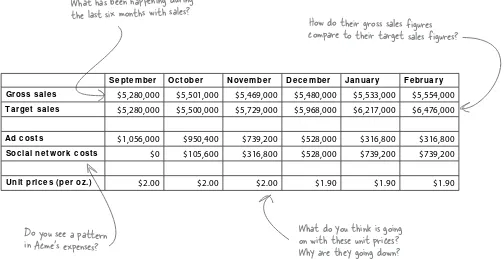
It’s your first day on the job as a data analyst, and you were just sent this sales data from the CEO to review. The data describes sales of Acme’s flagship moisturizer, MoisturePlus.
Take a look at the data. It’s fine not to know everything—just slow down and take a look.
What do you see? How much does the table tell you about Acme’s business? About Acme’s MoisturePlus moisturizer?
Do you see a pattern
in Acme’s expenses?
What do you think is going
on with these unit prices?
Why are they going down?
What has been happening during
the last six months with sales?
How do their gross sales figures
compare to their target sales figures?
Se pt e m be r Oc t obe r N ove m be r De c e m be r Ja nua r y Fe brua r y
Gross sa le s $5,280,000 $5,501,000 $5,469,000 $5,480,000 $5,533,000 $5,554,000
Ta rge t sa le s $5,280,000 $5,500,000 $5,729,000 $5,968,000 $6,217,000 $6,476,000
Ad c ost s $1,056,000 $950,400 $739,200 $528,000 $316,800 $316,800
Soc ia l ne t w ork c ost s $0 $105,600 $316,800 $528,000 $739,200 $739,200
U nit pric e s (pe r oz.) $2.00 $2.00 $2.00 $1.90 $1.90 $1.90
The CEO wants data analysis
to help increase sales
He wants you to “give him an analysis.”
It’s kind of a vague request, isn’t it? It sounds simple, but will your job be that straightforward? Sure, he wants more sales. Sure, he thinks something in the data will help accomplish that goal. But what, and how?
Welcome to the team. Take a look at our data and give me an analysis to help us figure out how to increase sales. Looking forward to your conclusions.
Think about what, fundamentally, the CEO is looking for from you with this question. When you analyze data, what are you doing?
Here’s the CEO.
Define Disassemble Evaluate Decide
the steps of analysis
The expression “data analysis” covers a lot of different activities and a lot of different skills. If someone tells you that she’s a data analyst, you still won’t know much about what specifically she knows or does.
But all good analysts, regardless of their skills or goals, go through this same basic process during the course of their work, always using empirical evidence to think carefully about problems.
In every chapter of this book, you’ll go through these steps over and over again, and they’ll become second nature really quickly. Ultimately, all data analysis is designed to lead to better decisions, and you’re about to learn how to make better decisions by gleaning insights from a sea of data.
Data analysis is careful
thinking about evidence
Define your problem.
Data analysis is all about
breaking problems and
data into smaller pieces
Here’s the meat of the analysis, where
you draw your conclusions about what
you’ve learned in the first two steps.
Finally, you put it all back together
and make (or recommend) a decision.
You might bet that she knows
Excel, but that’s about it!
How do you define your problem?
Define the problem
Doing data analysis without explicitly
defining your problem or goal is like heading out on a road trip without having decided on a destination.
Sure, you might come across some interesting sights, and sometimes you might want to wander around in the hopes you’ll stumble on something cool, but who’s to say you’ll find anything?
Ever seen an “analytical report” that’s a
million pages long, with tons and tons of charts and diagrams?
Every once in a while, an analyst really does need a ream of paper or an hour-long slide show to make a point. But in this sort of case, the analyst often
hasn’t focused enough on his problem and is pelting you with information as a way of ducking his obligation to
solve a problem and recommend a decision.
Sometimes, the situation is even worse: the problem isn’t defined at all and the analyst doesn’t want you to realize that he’s just wandering around in the data.
Map
Road trip without a destination.
what are you looking for?
Your client will help you
define your problem
He is the person your analysis is meant to serve. Your client might be your boss, your company’s CEO, or even yourself.
Your client is the person who will make decisions on the basis of your analysis. You need to get as much information as you can from him to define your problem. The CEO here wants more sales. But that’s only the beginning of an answer. You need to understand more specifically what he means in order to craft an analysis that solves the problem.
CEO of Acme
Cosmetics
There’s a bonus in it for you if you can figure out how to increase MoisturePlus sales.
Your client might be:
well or badly informed
about his data
well or badly informed
about his problems or goals
well or badly informed
intuitive or analytic
It’s a really good idea to know
your client as well as you can.
The better you understand your client, the
more likely your analysis will be able to help.
Keep an eye at the bottom of the
page during this chapter for these
cues, which show you where you are.
Define Disassemble Evaluate Decide
The general problem is that we need to increase sales. What questions would you ask the CEO to understand better what he means specifically? List five.
Q:
I always like wandering around in data. Do you mean that I need to have some specific goal in mind before I even look at my data?A:
You don’t need to have a problem in mind just to look at data. But keep in mind that looking by itself is not yet data analysis. Data analysis is all about identifying problems and then solving them.Q:
I’ve heard about “exploratory data analysis,” where you explore the data for ideas you might want to evaluate further. There’s no problem definition in that sort of data analysis!A:
Sure there is. Your problem in exploratory data analysis is tofind hypotheses worth testing. That’s totally a concrete problem to solve.
Q:
Fine. Tell me more about these clients who aren’t well informed about their problems. Does that kind of person even need a data analyst?A:
Of course!Q:
Sounds to me like that kind of person needs professional help.A:
Actually, good data analysts help their clients think through their problem; they don’t just wait around for their clients to tell them what to do. Your clients will really appreciate it if you can show them that they have problems they didn’t even know about.Q:
That sounds silly. Who wants more problems?A:
People who hire data analysts recognize that people withanalytical skills have the ability to improve their businesses. Some people see problems as opportunities, and data analysts who show their clients how to exploit opportunity give them a competitive advantage.
1
2
3
4
response from the client
Your questions might
be different.
From: CEO, Acme Cosmetics To: Head First
Subject: Re: Define the problem
By how much do you want to increase sales?
I need to get it back in line with our target sales, which you can see on the table. All our budgeting is built around those targets, and we’ll be in trouble if we miss them.
How do you think we’ll do it?
Well, that’s your job to figure out. But the strategy
is going to involve getting people to buy more, and by “people” I mean tween girls (age 11–15). You’re going to get sales up with marketing of some sort or another. You’re the data person. Figure it out!
How much of a sales increase do you think is feasible?
Are the target sales figures reasonable?
These tween girls have deep pockets. Babysitting money, parents, and so on. I don’t think there’s any limit to what we can make off of selling them MoisturePlus.
How are our competitors’ sales?
I don’t have any hard numbers, but my impression is that they are going to leave us in the dust. I’d say they’re 50–100 percent ahead of us in terms of gross moisturizer revenue.
What’s the deal with the ads and the social networking marketing budget?
We’re trying something new. The total budget is
20 percent of our first month’s revenue. All of that
used to go to ads, but we’re shifting it over to social networking. I shudder to think what’d be happening if we’d kept ads at the same level.
Acme’s CEO has some feedback for you
Here are some sample questions
to get the CEO to define
your analytical goals.
This email just came through in response to your questions. Lots of intelligence here…Always ask “how much.”
Make your goals and
beliefs quantitative.
Anticipate what your client
thinks about. He’s definitely going
to be concerned with competitors.
See something curious
in the numbers?
Ask about it!
The next step in data analysis is to take what you’ve learned about your problem from your client, along with your data, and break that information down into the level of
granularity that will best serve your analysis.
Break the problem and
data into smaller pieces
Divide the problem into smaller problems
You need to divide your problem into manageable,solvable chunks. Often, your problem will be vague, like this:
You can’t answer the big problem directly. But by answering the smaller problems, which you’ve analyzed
out of the big problem, you can get your answer to the big one.
Divide the data into smaller chunks
Same deal with the data. People aren’t going to present you the precise quantitative answers you need; you’ll need to extract important elements on your own.If the data you receive is a summary, like what you’ve received from Acme, you’ll want to know which elements are most important to you. If your data comes in a raw form, you’ll want to summarize the elements to make that data more useful.
Le t ’s give disa sse m bling a shot …
“How do we increase sales?”
“What do our best customers want from us?”“What promotions are most likely to work?” “How is our advertising doing?”Answer the smaller problems
to solve the bigger one.
Se pt e m be r Oc t obe r N ove m be r De c e m be r Ja nua r y Fe brua r y Gross sa le s $5,280,000 $5,501,000 $5,469,000 $5,480,000 $5,533,000 $5,554,000
Ta rge t sa le s $5,280,000 $5,500,000 $5,729,000 $5,968,000 $6,217,000 $6,476,000
Ad c ost s $1,056,000 $950,400 $739,200 $528,000 $316,800 $316,800
Soc ia l ne t w ork c ost s $0 $105,600 $316,800 $528,000 $739,200 $739,200
U nit pric e s (pe r oz.) $2.00 $2.00 $2.00 $1.90 $1.90 $1.90
December Target Sales $5,968,000
November Unit Prices $2.00
More on these buzzwords
in a moment!
These might be
the chunks you
need to watch.
revisit the data
Now take another look
at what you know
Let’s start with the data. Here you have a summary of Acme’s sales data, and the best way to start trying to isolate the most important elements of it is to find strong
comparisons.
Making good comparisons is at the core of data analysis, and you’ll be doing it throughout this book.
In this case, you want to build a conception in your mind of how Acme’s MoisturePlus business works by comparing their summary statistics.
Se pt e m be r Oc t obe r N ove m be r De c e m be r Ja nua r y Fe brua r y
Gross sa le s $5,280,000 $5,501,000 $5,469,000 $5,480,000 $5,533,000 $5,554,000
Ta rge t sa le s $5,280,000 $5,500,000 $5,729,000 $5,968,000 $6,217,000 $6,476,000
Ad c ost s $1,056,000 $950,400 $739,200 $528,000 $316,800 $316,800
Soc ia l ne t w ork c ost s $0 $105,600 $316,800 $528,000 $739,200 $739,200
U nit pric e s (pe r oz.) $2.00 $2.00 $2.00 $1.90 $1.90 $1.90