The Effects of Applying Revenue Management on Customer
Satisfaction in Airline Industry: An Experimental Study in
Indonesia
Rambat Lupiyoadi* and Bramana Putra**
This research mainly discusses about the effects of applying revenue management, specifically in the contexts of inventory control (variation in ticket prices for the same flight and class) and denied
boarding (permissibility of reservations exceeding carrying capacity as a hedging practice over the
possibility of tickets cancellation) on the customers’ satisfaction toward airlines in Indonesia. Ex
-perimental method was applied on the research, involving students from University of Indonesia as participants. The results showed that inventory control policy partly affected customer satisfaction, while the denied boarding policy fully affected their satisfaction. These research findings can con
-tribute to further studies on consumers’ behaviour in dynamic airlines industry, mainly in emerging markets such as Indonesia.
Keywords: Airlines, Revenue Management, Customer Satisfaction
Penelitian ini membahas mengenai pengaruh penerapan manajemen pemasukan (revenue manage-ment), khususnya dalam konteks pengendalian inventori (inventory control , yaitu variasi harga tiket
dalam penerbangan dan kelas yang sama) dan penolakan untuk naik pesawat (denied boarding,
prak-tik jumlah reservasi yang melebihi kapasitas angkut pesawat sebagai prakprak-tik antisipasi kemungkinan pembatalan tiket oleh penumpang) terhadap kepuasan konsumen pada perusahaan penerbangan di Indonesia. Penelitian ini menerapkan metode eksperimen, dengan melibatkan mahasiswa Universitas Indonesia sebagai partisipan dalam eksperimen. Hasil penelitian menunjukkan bahwa kebijakan pen -gendalian inventori secara parsial mempengaruhi kepuasan pelanggan, sedangkan denied boarding
mempengaruhi kepuasan pelanggan secara penuh. Temuan penelitian ini dapat memberikan kontri -busi terhadap studi tentang perilaku konsumen industri penerbangan yang dinamis, khususnya dalam
pasar yang berkembang seperti di Indonesia.
Kata kunci: Penerbangan, manajemen pemasukan, kepuasan pelanggan
Introduction
The growth of air passengers in Indonesia is quite high, amounting to 18.18% in 2010 and 16.27% in 2011 (Tempo, 2012). This growth is quite logical considering Indonesia’s relatively
good macroeconomic condition as indicated
by Indonesia’s Gross Domestic Product (GDP) growth that reached 6% year-on-year, while
the proportion of private consumption reached
50% of GDP during 2009 to 2012 (Kuntjoro-Jakti, 2012). The market of domestic airlines in early 2012 was dominated by a few major players: Lion Air (41.59%), Garuda Indonesia (22.82%), Sriwijaya Air (13.8%) and Batavia Air (11.25%), (The Jakarta Post, 2012).
The growing number of passengers is in
-fluenced by the growth in consumer purchas
-ing power and the will-ingness of the airlines to reach the purchasing power of the sub-marginal consumers by lowering ticket prices. The lower
ticket price is a result of revenue or yield
man-agement; defined as different pricing for dif -ferent perceived-value consumers on the same
product based on the sensitivity toward price
* Department of Management, Faculty of Eonomics and Business University of Indonesia and Faculty of Economics and Business, Padjajaran University, Email:
;
(Lovelock & Wirtz, 2011). This method is ex
-pected to maximize the companies’ profit.
Revenue or yield management in airlines in-dustry is basically about creating variations of
price on a specific route at a given flight date and time. Thus, sub-classes are created to make
it easier in creating this variations of price on a
specific route at a specified date and time (in a single flight or same trip). The number of tick -ets available for each sub - class and the num-ber of sub - class depends on the policy of each
company in managing its earnings.
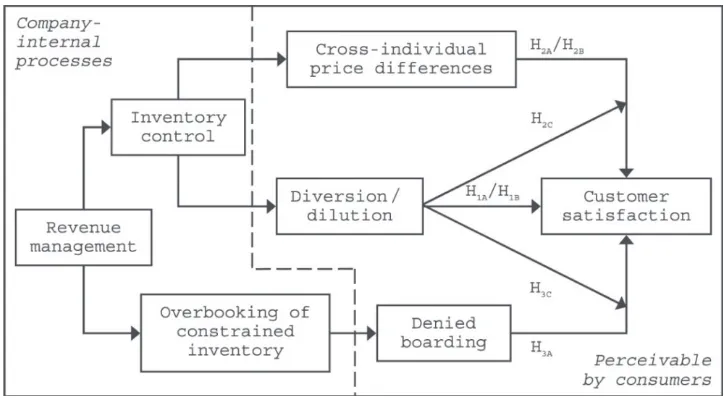
Lindenmeier & Tscheulin (2008) stated that
revenue management on airlineshas two com -ponents, namely inventory control and
over-booking of constrained inventory. Inventory control deals with variation in ticket prices for the same flight and class. Consumers see this practice in two distinct parts: diversion / dilu -tion (ticket price differences obtained by the
ex-pected ticket prices) and cross-individual price
differences (ticket price differences of a
con-sumer compared to other concon-sumers). Mean
-while, overbooking of constrained inventory
is reservations exceeding the aircraft carrying capacity as a hedging practice over the
possibil-ity of ticket cancellation. This practice allows the delayed departure (denied boarding) in the absence of passengers who cancel flights.
In a broader context, revenue management is simply a tool to maximize companies’ profit which would then affect the consumers along with seven other service marketing mix. In the services marketing triangle, Zeithaml, Bitner & Gremler (2009) classified consumers, manage
-ment and frontliner into distinct entities. Man -agement has dual-responsibilities; assessing each policy from the consumer standpoint, and preparing the frontliner to be able to convey the
formulated policies to the consumers. Therefore
it becomes important for management to learn
how the application of revenue management af
-fects their consumers. In addition, Lindenmeier & Tscheulin (2008) suspected revenue manage
-ment would result in negative effects on cus
-tomer satisfaction.
Thus, this study is aimed to analyze the ef-fects of applying revenue management,
(par-ticularly inventory control) on customer sat
-isfaction. Specifically, the authors would like
to analyze the effects of revenue management
practice (in form of overbooking policy that
result in denied boarding) on customers’ satis
-faction. In addition, the authors would like to analyze: (1) the interaction between diversion /
dilution and cross-individual price differences,
and (2) interaction between the diversion / dilu
-tion and overbooking allowance that cause de
-nied boarding.
Literature Review
The Concept of Revenue Management
Revenue management or yield management is different pricing for different perceived-val-ue consumers on the same product based on
sensitivity toward price (Lovelock & Wirtz, 2011). Companies perform segmentation based
on consumer price sensitivity; so that each
seg-ment will get the price and features that fit their needs. Consumers who are less sensitive to price will be directed to pay higher price but better service. Service companies are not nec -essarily able to sell all of its products to these
consumers. The remaining capacity will be al
-located to consumers who are more sensitive to price by offering low prices but with a more limited service.
Revenue management in airline service
separates between passenger segments (price fencing) using limit (fence) that are non-phys
-ical in nature. Each segment will be named as sub-class. The non-physical limitations mean all segments in a class will get the same techni -cal core services, but each sub-class has
differ-ent ticket flexibility. Revenue managemdiffer-ent is
not only covering price discrimination, but also inventory management through multiple book-ing classes and orders exceedbook-ing the capacity
(overbooking) as hedging practices (Belobaba & Botimer, 1999).
Inventory Control and Denied Boarding
Inventory control is the practice of balancing
the amount of the cheapest tickets
(promotion-al tickets) and the most expensive ticket (full fare tickets) to maximize revenue from tickets sales as its objective (Belobaba, 1987). Inven -tory control is an internal process of an airline,
Passengers feel the effects when the inventory control is applied to diversion / dilution and cross-individual price difference, where the two constructs have passed the line of visibility.
Diversion is a condition where a passenger
could not make ticket reservation on the
ex-pected price and then be transferred (diverted) to a more expensive price, while Dilution is the opposite condition, when a passenger makes reservation and gets a cheaper price (Beloba
-ba, 1999). Cross- individual price difference is a situation when passengers realized that the
price paid by each passenger is not the same
for the same service (with the exclusion of the terms and conditions of ticket). The price dif
-ference cause jealousy, especially when pas
-sengers realized there are other pas-sengers who get lower prices (unfavorable price difference). On the other side, some of them will feel happy when they realized that they managed to get a
cheaper price than other passengers (favorable
price difference).
Overbooking is the practice of accepting res-ervations exceeding the capacity as a form of hedge against the possibility of trip cancellation
(Karaesmen & Van Ryzin, 2004). Apart from
the terms and conditions of refunding on each ticket sub - class, the possibility of trip cancel-lation by the passengers can cause the
phenom-enon of empty seats in a fully booked flight.
This means the capacity is recorded as full be-cause passengers have fully paid the airfare and the tickets have been issued, but in reality, the
flight is not actually full as there are passengers who fail to participate in the trip. This specula
-tion also present negative consequences; when all passengers participating in the flight (no pas
-senger cancels her/his trip), then some of them will not be carried (assuming the airlines do not change the aircraft to a larger aircraft). This phenomenon is referred as denied boarding.
Indonesian Airlines Market at a Glance
There are several carriers either state and
private owned airlines that operate scheduled
and unscheduled commercial passengers routes
in Indonesia. The application of revenue man -agement concept on these carries is tangible as there are numerous variations of ticket price
offered to passengers that always change from
time to time. The details of their revenue sys -tems should be unseen by public, but the
ex-istence of Ministerial Regulation no. 26, year 2010 legitimizes the practice of ticket price
variation as it also contains the maximum and minimum ticket price reference for commercial
passenger routes in Indonesia. Furthermore, the Ministerial Regulation no. 77 year 2011 and The Law of the Republic of Indonesia no. 1 of 2009 complement the previous regulation to give more protection to passengers. It said
that the airlines have obligation to give com-pensation to the passengers that affected from
the cancellation or delay on the flight caused by commercial reason.
Methods
Conceptual Framework
Lovelock & Wirtz (2011) stated that the pro -cess of value creation in services and the
val-ue delivery is divided into two areas: the area of company’s internal processes and the area where consumers are involved, as depicted in this model of study. The study involved five
constructs: cross-individual price differences, diversion, dilution, denied boarding and
cus-tomer satisfaction. All of these constructs are
the concrete aspects of revenue management
that can be felt by consumers. Meanwhile rev -enue management, inventory control and
over-booking allowance are an internal process of the company or a concept in the eyes of consumers.
Zeithaml, Bitner & Gremler (2009) stated that customer satisfaction is influenced by
three factors: product quality, service quality
and price. Cross-individual price differences, and diversion / dilution are closely linked to the price issue, while denied boarding is reflect
service quality, particularly reliability
dimen-sion. Lindenmeier & Tscheulin (2008) have
reported negative effects of applying revenue
management. Therefore, this study is intended to analyze whether the revenue management with both components directly affect custom
-ers’ satisfaction in developing countries such as Indonesia. Figure 1 depicts the research frame
-work adopted in this study. However this study
is limited to the scheduled commercial
Hypothesis
Inventory control is assumed to affect
pas-sengers’ satisfaction directly with the consider -ation of passengers evaluating the ticket price
issued against the benefits of tickets’ flexibility obtained. Tickets at the lower price sub-class will have less flexibility than in the higher price sub-class (Belobaba & Botimer, 1999). Passen
-gers who get higher priced tickets are assumed to remain dissatisfied although they get a more flexible ticket (Oliver, 1980). Passengers’ sat -isfaction in this study solely relies on both at-tributes although passengers can make
gener-alization of the product (service) or even the company (airline) as a whole (Oliver, 1980).
Therefore 1A hypothesis is formulated as
fol-lows:
H1A: The existence of diversion at the time of
reservation produces negative satisfac-tion response
The dissatisfaction experienced by pas-sengers as a result of diversion or satisfaction
brought forth by dilution is not the same. Ac
-cording to prospect theory, passengers will feel the effect more when experiencing dissatisfac -tion because of the tendency to avoid risk (risk
averse), when one would be more sensitive to losses than gains (Mittal, Ross & Baldasare, 1998). Therefore 1B hypothesis is formulated as follows:
H1B: The effects of diversion at time of reser
-vation will be more prominent than the
effects of dilutionpronounced
Cross-individual price differences that result
in jealousy or pleasure is assumed to directly
influence the overall passengers’ satisfaction (Oliver & Swan, 1989). The influence departs from the cost and benefit considerations (such as inventory control) and the theory of justice.
Passengers compared the values (the ratio of
costs and benefits) of she/he received to val
-ues received by the other passengers. Unfavor
-able condition occurs when the value gained is
less than the value gained by other passengers,
while favorable condition occurs when the val -ue gained is greater than the val-ue gained by
other passengers. Therefore hypothesis 2A is formulated as follows:
H2A: The cross-individual price differences as a result of seat inventory control will af
-fect customers’ satisfaction.
Based on the prospect theory, the amount of
dissatisfaction experienced by passengers as a result of unfavorable price differences is higher than the satisfaction experienced as a result of
favorable price differences (Oh, 2002). There
-fore hypothesis 2B is formulated as follows: H2B: The effects of unfavorable price differ
-ences will be more prominent than the ef -fects of favorable price differences
Furthermore, the interaction between cross-individual price differences and diversion / di -lution is assumed to occur because price is one
of the attributes that determines passengers’ satisfaction. Although nominally there is no difference between a passenger’s ticket price
to other passengers’ ticket prices, a passenger satisfaction can vary within ticket sub-classes (Lindenmeier & Tscheulin, 2008). Therefore 2C hypothesis is formulated as follows:
H2C: Satisfaction responses in case of equal price difference between individuals is not the same across booking class.
Denied boarding is a decrease in service quality (Zeithaml, Bitner & Gremler, 2009) which is thought to affect passengers’ satisfac
-tion (Maxham & Netemeyer, 2002). The air -lines are required to provide compensation to the passengers, but the service recovery efforts is still not enough to neutralize discontent, so
that passengers are still not satisfied (Rothsein, 1971). Therefore hypothesis 3A is formulated as follows:
H3A: Passengers experiencing denied boarding would experience negative effect on their
satisfaction eventhough service recovery
has been applied.
It is assumed there is no interaction between
denied boarding and inventory control because passengers experiencing denied boarding are suspected to be strongly disappointed
(Linden-meier & Tscheulin, 2008). Therefore hypoth
-esis 3B is formulated as follows:
H3B: Satisfaction responses due to denied board
-ing will not vary across book-ing classes
Research Design and Method
This study used experimental method, in
which a respondent was placed on more than one case (scenario). The scenarios presented
in narration and the respondents responded in
written form (questionnaire). In another word, it is a pure form of a lab experiment.
We carried several pilot tests prior to the main experiment to determine the appropriate
stimuli and instruments. The first pilot test is
aimed to ensure that the targeted respondents
were aware with the brands or the operators of domestic airlines in Indonesia. Then respon
-dents were asked to classify the brands into a full service airline, low-cost carrier or none of both. Respondents were also asked several ques
-tions about: (a) preferences in ordering tickets if they book their own tickets, (b) assessment of
types of trip relevant to the population and their
desire to be involved in arranging the trip. The measuring instruments used are how important the trip for them (value) and how they want to be involved in decision making. They were also asked about (c) city destinations and pref
-erences on airlines chosen for each type of trip. The first pilot test involving 31 undergradu
-ate students as respondents, with age ranged between 19 and 22 years. Respondents were required to have used a domestic flight service and then asked to fill out an online question
-naire. The descriptive statistical results are pre
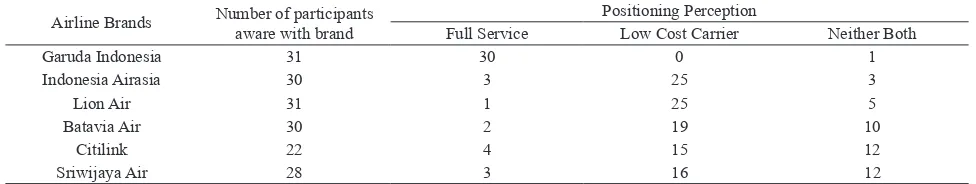
-sented in Table 1.
The data showed that the respondents had been aware of the entire airline brands listed in the questionnaire. In terms of brand awareness, the brand with highest number of awareness was Garuda Indonesia, followed by Lion Air, with Citilink became the brand with lowest frequen
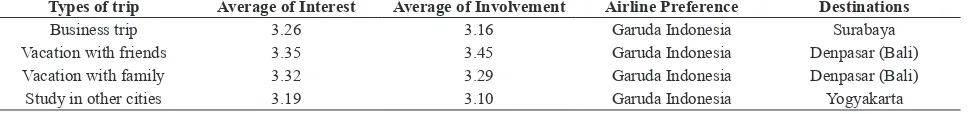
-cy of awareness. The types of trip are offered in the next part of the questionnaire. Those are: business travel, vacation with friends, vacation with family, and trips to continue their studies outside of the city. The descriptive statistical results related to the types of trip are shown in Table 2.
Trip with friends is the type of trip with the highest value of importance (interest) for the life and the kind of trip with the highest value of involvement. These results are relevant to the characteristics of the average students who want to have fun with peers than do other activ
-Table 1. Descriptive Results (Pilot Test 1 - Part 1)
Airline Brands Number of participants aware with brand Full Service Positioning PerceptionLow Cost Carrier Neither Both
Garuda Indonesia 31 30 0 1
Indonesia Airasia 30 3 25 3
Lion Air 31 1 25 5
Batavia Air 30 2 19 10
Citilink 22 4 15 12
Sriwijaya Air 28 3 16 12
ities. The most popular destination for holiday with friends is Denpasar (Bali) with Garuda In
-donesia as the airline preference. The results of the first Pilot Test show that the brand Garuda Indonesia and vacation with friends to Den
-pasar (Bali) as the destination are to be used as stimuli in the field test questionnaire.
The second pilot test aim to check whether
the stimuli for tangible inventory control (in
terms of prices) were in accordance with their definitions. Consumers assessed whether the price was considered expensive (diversion), cheap (dilution) or neither based on the com
-parison between internal reference prices (price to be expected) with the actual price (Oh, 2002). Respondents were asked to write down a rea
-sonable price according to their own perspec
-tives and market prices estimations for one-way flight for the routes and airlines obtained from the first pilot test. The average of the two pric -es is used as an internal reference price on the
main questionnaire (Oh, 2002).
The second pilot test involves 16 student
re-spondents. They were asked to fill out an online questionnaire, consisting of two questions. The respondents were given explanation of the defi
-nition of reasonable price and market price. The results are shown in Table 3.
Internal reference price is the average of the
perceived fair price and the perceived market
price (Oh, 2002). The closest actual price to the internal reference price – ie IDR 850,000 (a sub-class V) – is used as the price on the condition
of neither diversion nor dilution (expected price
equal to the actual price). Dilution price is tak
-en from the price of the lower H sub-class, IDR 550,000 and diversion price is taken from the price of the higher B sub-class, IDR 1,150,000.
Round trip price is obtained by multiplying the
price of one-way trip by two. As a result, the
set of stimuli consisting of prices and features
that would be used in the main questionnaire are presented in Table 4.
Since the pilot test data had been collected,
the stimuli and questionnaires could be
de-veloped. Each questionnaire consisted of two parts: (1) questionnaire to record the diversion / dilution stimuli and cross-individual price dif -ferences to test the 1st and 2nd hypotheses, and
(2) questionnaire to record the diversion / dilu
-tion stimuli and denied boarding to test the 3rd
hypothesis.
The first study applying the 1st part of
ques-tionnaire was conducted through 3x3 within subject designs, with the options of diversion / dilution stimuli: rates obtained are the same / higher / lower than the expectations of pas -sengers; and the options of cross-individual price differences stimuli: prices obtained by
other passengers are equal / higher / lower than the rates obtained by the passengers. Details of treatment for the first part of the questionnaire is presented on table 5.
The study applying the 2nd part of
question-naire was carried out with a 3x2 within subject design, with the options of diversion / dilution stimuli: rates obtained are the same / higher / lower by expectations of passengers, while the
Table 2. Descriptive Results (Pilot Test 1 - Part 2)
Types of trip Average of Interest Average of Involvement Airline Preference Destinations
Business trip 3.26 3.16 Garuda Indonesia Surabaya Vacation with friends 3.35 3.45 Garuda Indonesia Denpasar (Bali) Vacation with family 3.32 3.29 Garuda Indonesia Denpasar (Bali) Study in other cities 3.19 3.10 Garuda Indonesia Yogyakarta
Source: Processed by the Authors
Table 3. Descriptive Results (Pilot Test 2)
Average of Reasonable Price Average of Market Price Internal reference Price Closest Actual Price
Rp659,375 Rp1,043,781.25 Rp851,578.125 Rp850,000 Source: Processed by the Authors
Table 4. Ticket Prices Available to Travel
Conditions Ticket price Re-booking
Diversion (B) 2.3 million IDR Free of charge
Neither of both (V) 1.7 million IDR Charged for 100,000IDR
Dilution (H) 1.1 million IDR Charged for 200,000IDR
options of denied boarding stimuli are the
pres-ence and abspres-ence of denied boarding. The Re
-search design is described in table 6.
At the time of the field test, the respondents were given a verbal explanation of the airline
industry, including the fact that ticket prices paid by diffrent passengers for the same service
can vary. Scenarios in the form of written nar -rative are intended to direct the respondents to
the artificial conditions. An example of narra
-tive stimuli used in the study is provided below:
“On a weekend, you have a chance to take a holiday with friends to Bali and have decid
-ed to go with Garuda Indonesia (a domestic carrier in Indonesia). When you are discuss -ing to buy the airplane tickets, you realized that the departure schedule is still uncertain,
whether all of you have the free schedule to depart on the intended time.
You have IDR 1,7 million budget per per
-son to purchase the airplane ticket. Howev
-er, you may find the lower or higher fares, based on seat availability. The lower or higher fares have it own policy for voluntary
schedule change, to anticipate your need for
rearrangement. The excess or shortage of
air ticket budget may affect the
accommo-dation budget and other allowance.
You should note that on the weekend the flight will always full and there is a possibil -ity that you may be denied for boarding due
to overcapacity. If you are denied, you will be accommodated on the upcoming flight that will arrive on Bali at midnight.”
The designed conditions are made as close-ly as possible to the real conditions including some assumptions to improve the homogeneity
that is not covered by the stimuli as well as an
effort to control the effects of cofounding
vari-able.
Environmental components controlled in the
questionnaire include:
a. The type or purpose of the trip along with
the consequences of delay and possibility of schedule change on return route,
b. Airline brand, type of airline services and
travel routes,
c. Source of trip financing and its consequenc -es for the r-espondents if diversion or dilution
occurs.
d. How to order is assumed via online to re
-duce distraction while assessing respon
-dents’ satisfaction.
e. Features of each sub-class tickets in the form of rebooking flexibility is based on real fea
-tures of the brands in the market.
f. Compensations of any delay or denied boarding (special questionnaire type 2).
Next, the respondents were randomly placed
in 15 different scenarios listed on Table 5 and
Table 6. The respondents were required to as -sess their satisfaction each scenario by
respond-ing to indicators described in the followrespond-ing sec
-tion (Opera-tionaliza-tion of Variables).
Operationalization of Variables
Passengers’s satisfaction towards the airlines were assessed by asking the respondents to re
-spond to the following items developed by Lin
-denmeier dan Tscheulin (2008): • Satisfaction on the price paid • Price paid by other passengers met
• Relations between the price and the service
(cost vs benefit)
Table 5. Research Design 1
Unfavorable difference
(other passengers get lower than 600IDR) No difference (other passengers get higher than 600IDR)Favorable difference Dilution (1,1 million IDR) Scenario 1 Scenario 2 Scenario 3
Neither of both (1,7 million IDR) Scenario 4 Scenario 5 Scenario 6 Diversion (2,3 million IDR) Scenario 7 Scenario 8 Scenario 9 Source: Processed by the Authors
Table 6. Research Design 2
Denied boarding No denied boarding
• Flexibility of travel planning • Rebooking conditions
In addition, referring to Lindenmeier dan Tscheulin (2008) study on denied boarding, the following factors were also added to measure
the construct of satisfaction:
• Compensation of delay • Food and beverage
• Management of passengers’ reservations (re
-sulting in overbooking) • Waiting time onward flight
Respondents were asked to provide ratings on a Likert scale from 1 (very unsatisfactory) to 6 (very satisfactory).
The validity and reliability of this
question-naire were tested through confirmatory factor analysis (CFA). The constructs of passengers’ satisfaction were tested by one scenario that re
-quired 15 times of testing, in accordance with the number of scenarios specified in the study design.
Pre-test was conducted involving 17 par
-ticipants who were all students of the Faculty of Economics, University of Indonesia. All re
-spondents have passed the screening test, which
is a requirement that the respondent had ever used commercial airline services at least once
within the last one year. The results of the va -lidity and reliability testing on the pre-test as a
whole was not good since there were many sce
-narios with Cronbach alpha value ≤ 0.5 which indicated lack of reliability (Malhotra 2010). Thus, some revisions were done before con
-ducting the field test:
• Disposing the item price paid by other pas
-sengers in scenarios 10 to 15 since it was not relevant to the stimuli given. The item was
replaced by the price performance relation –
comparison between the price paid and the services received.
• Clarifying instructions in filling out the ques
-tionnaires since it was found that some re
-spondents made mistakes in filling out the questionnaire, resulting in less valid data. • Giving pause between scenarios to avoid the
effects of history and maturation (Malhotra, 2010)
The aforementioned revision was able to in -crease the results of validity and reliability of
the field-test-questionnaire to meet the mini
-mum requirement of Cronbach’s Alpha and factor loading as suggested in Malhotra (2010).
Sample/Participants
Sample selection was expected to represent
the characteristics of the population – the
air-lines passengers in Indonesia. University stu
-dents were chosen as the subjects through con
-venience sampling. Participants were required
to have traveled by planes and have purchased
airplane ticket on their own. This requirement is necessary to ensure the partipants’ ability to understand the scenarios conveyed as well as
to ensure their ability to respond to the stimuli
given.The use of a sample from only one seg-ment of the population that have similar
char-acteristics (statistical control) is expected to reduce the influence of extraneous variables,
especially variables derived from the charac-teristics of age, education level, income level,
etc. (Malhotra, 2010). In previous studies, it has been proven that none of the respondents’ pro
-file becomes extraneous variable (Lindenmeier & Tscheulin, 2008).
Respondents Profile
Field test was involving 35 student partici
-pants (13 men and 22 women) who passed the
screening test; Average age of the participants
were 19.34 year old. The results of descriptive data analysis on the participants profile were quite similar to the results of the first pilot test; On average, the participants have known Ga
-ruda Indonesia and the majority (70.37%) of the them had used Garuda Indonesia service in the past. Similar to the pilot test result, Den
-pasar (Bali) was also the preferred destination, and 31.43% of all participants have traveled to Denpasar by airplane.
Result and Discussion
Hypothesis Testing
Hypothesis 1A
H1A: The existence of diversion at the time of
reservation produces negative
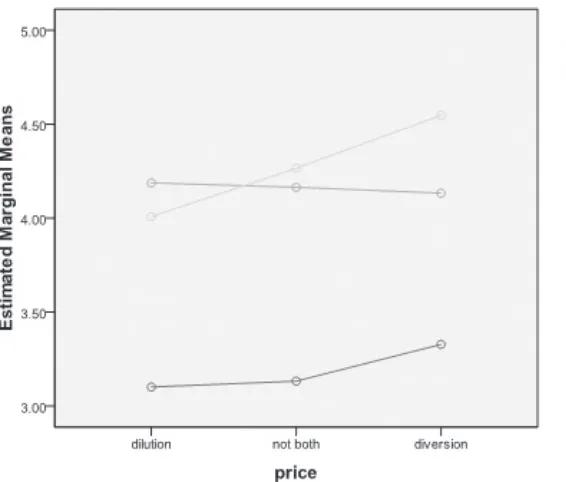
The paired t test is applied to test the
hypoth-esis 1A. The first paired t test showed that the mean of passengers’ satisfaction experiencing dilution (3.77) is smaller than the mean of pas
-sengers’ satisfaction experiencing neither dilu
-tion nor diversion (3.85). The second paired t test showed that the mean of the passengers’
satisfaction that did not experience both
con-ditions (3.85) is smaller than the mean of the passengers’ satisfaction experiencing diversion (4.00). The difference is not significant, which
means the hypothesis that the presence of the
diversion would result in a negative effect on passengers’ satisfaction was not statistically proven.
The unproven hypothesis 1A contradicted
the study by Lindenmeier and Tscheulin (2008).
Participants in this study seemed more critical
in considering the costs and benefits, though in general they were assumed to be price-sensitive consumers. One of the factors that might influ
-ence the result was the negative consequ-ences on their travel flexibility (less flexible travel schedule) that came from getting a cheaper ticket. The scenarios (stimuli) clearly described the features of each sub-class ticket along with
the fact that the possibility of voluntary changes
in flight schedules is quite large. As a result, re -spondents tended to appear risk averse and not
fell into the lure of low prices.
Hypothesis 1B
H1B: The effects of diversion at time of reser
-vation will be more prominent than the
effects of dilution
Post-hoc ANOVA test showed that no signif
-icant mean differences (p value <0.05) between
groups based on the prices paid by passengers
occured among any group. Statistically it is not
proven that the diversion effect on satisfaction
will be more prominent than the dilution effect.
There is not enough evidence to reject the null
hypothesis.
The unproven hypothesis 1A lead to the
un-proven of 1B hyphotesis, because Lindenmeier and Tscheulin (2008) discussed the effects of
diversion in the context of satisfaction decline and the effects of dilution in the context of the
increased satisfaction. Meanwhile this study in -dicates a contradicted result as described on the
analysis of hyphotesis 1A. Mean differences between group that received diversion stimuli
and group that received neither diversion and
dilution was descriptively larger than the mean differences between the group that received di -lution stimuli and group that received neither dilution and diversion; but no statistically
sig-nificant difference was found.
Hypothesis 2A
H2A: The cross-individual price differences as a result of seat inventory control will af
-fect customers’ satisfaction.
The paired t test was applied to test hypoth
-esis 2A. The first paired t test showed that the
mean of passengers’ satisfaction experiencing unfavorable price difference (3.19) was signifi
-cantly (p value> 0.05) smaller than the mean satisfaction of passengers who did not experi
-ence the price differ-ence (3.83). The second paired t-test showed that the mean of passen
-gers’ satisfaction that did not experience the price difference (3.83) was significantly small
-er (p value <0.05) than the mean of passeng-ers’
satisfaction experiencing favorable price
dif-ference (4.27). It is statistically proven that the unfavorable price difference will lead to dis -satisfaction of passengers and also proved that
favorable price difference will result in passen
-gers’ satisfaction.
This finding is in line to some studies con
-ducted by Lindenmeier & Tscheulin (2008 ) and Oh ( 2002) who also compared the effects between the favorable price difference and the unfavorable price difference. When the passen -gers learned that other passen-gers get tickets at a cheaper price than the ticket they got, the
satisfaction will be marred because they feel
the values gained are smaller than the values
received by other passengers. On the other side, when the passengers found out that other pas
-sengers paid more, their satisfaction would in
-crease. The study conducted by Lindenmeier & Tscheulin (2008) found that favorable price dif
-ference did not significantly result in positive satisfaction. They explained that the result was influenced by the cultural factors of the respon
-dents. Lindenmeier & Tscheulin (2008) had re
respondents from Indonesia that tend to love going / doing activities together.
Hypothesis 2B
H2B. The effects of unfavorable price
differ-ences will be more prominent than the ef
-fects of favorable price differences.
Post-hoc ANOVA test showed that signifi
-cant mean differences (p value <0.05) between groups based on price differences with other passengers occurred only between the unfa-vorable group and favorable group (-1.09) and
between unfavorable group and no difference
group (-0.95). The result statistically prove that
effects of unfavorable price differences is more prominent than the effects produced by
favor-able price differences. This finding is in line with the findings of Lindenmeier & Tscheulin (2008) that suggest passengers would feel more
effect on their satisfaction in the condition of unfavorable price difference than in condition of favorable price difference; although
statisti-cally passengers showed the changing of sat -isfaction responses in both conditions as
de-scribed in the analysis of hypothesis 2A.
Hypothesis 2C
H2C. Satisfaction responses in case of price
difference between individuals is not the same across booking class.
Two-way ANOVA test with interaction showed that there was no significant mean dif
-ference (p value> 0.05) between groups based on derived passenger prices; significant mean difference occurred (p value <0.05) between groups based on price differences with other passengers, and no significant interaction (p value> 0.05) between booking class and indi
-vidual price difference. It was not statistically
proven that there is difference in satisfaction re-sponses across booking classes in case of price
difference between individuals. The interaction between booking class price and individual price difference was not found as no mean dif
-ferences of price was found (both hyphothesis 1A and hyphotesis 1B were not proven).
Hyphotesis 3A
H3A. Passengers experiencing denied boarding
would experience negative effect on their
satisfaction eventhough service recovery
has been applied.
Paired t-test was applied to test the hypho
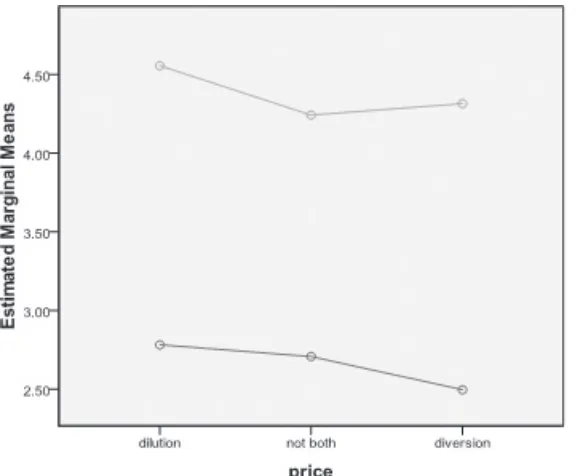
-tesis 3A. The result indicated that the mean of passengers’satisfaction experiencing denied boarding (2.66) was significantly lower (p val-ue < 0.05) than the mean of passengers’ satis
-faction who did not experience denied boarding
(4.37). It is statistically proven that passengers experiencing denied boarding would demon
strate negative satisfaction (dissatisfaction)
though the service recovery has been
imple-mented.. The proven 3A hyphotesis is in line to the findings of Lindenmeier & Tscheulin (2008) and Rohstein (1971). Passengers experiencing
denied boarding will be dissatisfied although
the airline gave compensation of it.
Hypothesis 3B
H3B. Satisfaction responses due to denied
boarding will not vary across booking
classes
Two-way ANOVA test with interaction showed that there was no significant mean dif
-ference (p value> 0.05) between groups based
on factor of derived passenger price (booking
class); while significant mean differences oc
-cured (p value <0.05) between groups based on denied boarding, and no significant interaction (p value> 0.05) between the factors of price (booking class) and denied boarding. Statisti
-cally it is proven that satisfaction responses
due to a denied boarding will not vary between booking classes..
The unproven 3B hypothesis is in accor -dance to the study of Lindenmeier & Tscheulin
(2008). The interaction between price (booking class) and denied boarding was not found since the test of hypothesis 1A was also not proven.
When a passenger experienced denied board-ing, they would not consider other factors but
guaranteed departure. Scenarios (stimuli) have
clearly explained the consequences to be borned
as denied boarding takes place.
The testing results of the entire hypotheses is
summarized in Table 7.
Conclusions And Suggestions
This study found that applying Revenue Management, particularly inventory control
does not affect the passengers’ satisfaction. Specifically, dilution and diversion do not influ
-Figure 3. Mean of satisfaction based on price and denied boarding Table 7. The Summary of hypothesis testing results
Hypothesis Result Conclusion
H1A Unproven Diversion does not produce negative satisfaction responses and the dilution does not result in positive satisfaction
responses
H1B Unproven Diversion effect on satisfaction is no more prominent than the dilution effect
H2A Proven Favorable price difference results in positive satisfaction and unfavorable price difference resulting negative satisfaction
H2B Proven Unfavorable price difference results a more prominent satisfaction response than the favorable price difference
H2C Unproven Satisfaction responses due to the price difference between individuals does not vary between booking classes H3A Proven Passengers experiencing denied boarding show negative satisfaction responses
H3B Proven Satisfaction responses due to denied boarding does not vary between booking classes
ence the passengers’ satisfaction either, while
the indirect effects of cross-individual price differences do influence the passengers’ satis
-faction. Furthermore, applying the overbook-ing allowance which results in denied boarding
affects the passengers’ satisfaction. In terms of interaction between independent variables, this
study found that there is absence of interaction
between inventory control and cross-individual price differences. Meanwhile, there is interac
-tion between inventory control and overbook-ing allowance.
Based on the results obtained from this
study, some points need to be considered by the
airlines in marketing their services to public. Firstly, although the revenue management prac
-tices have close relationship with the customer
satisfaction, it is observed in limited context
(satisfaction towards reservation process). As
the overall satisfaction might also be measured by various aspects, airlines may strenghten the customer satisfaction in other areas such as
in-flight/airport services. Airlines might consider
revenue management purely for revenue
maxi-mization purpose.
Secondly, this study proved that consumers (in this case students) have been aware of the product’s features rather than considering the
price alone, resulting on higher satisfaction on
more flexible ticket with higher price. Airlines
can take this opportunity to create more
com-binations of ticket price and ticket flexibility without sacrificing customer satisfaction. The variation may be based on customer profile, e.g.
creating minimum and maximum stay rule to
compensate lower fares for promotional leisure ticket. The leisure passengers should be fine with this rule as they usually have fixed leisure itinerary. The business passengers should also be fine with higher fares as they need more flex
-ible itinerary.
Thirdly, the airlines have to be careful in
managing inventory (capacity) since the pas
-sengers’ satisfaction shown to decrease signifi
-cantly when denied boarding occured. Devel -oping the latest information technology systems
is needed to be able to analyze the consumers’
behavior more accurately; hence the denied
boarding cases would be minimized without sacrifying the revenue on airlines side. This
study also proved that there is no variation in
satisfaction between different booking classes,
thus any passengers (regardless of their
book-ing class) would be dissatisfied if they were de
-nied. The dissatisfaction could be minimized if the airlines offer rewards to certain passengers for voluntary reschedule.
This study has several limitations. First, this research was focused on Garuda Indonesia Air
-lines which is a full service airline. This is sus -pected to cause consumers to consider further
the cost vs. benefit. Passengers tend to think
that the various classes of ticket price sold by
Garuda Indonesia are worthwhile to the servic
-es rendered. This phenomenon is not nec-essar
-ily found in other airlines.
Another limitation is that this study involved
students in Indonesia as participants. The In -donesian students represent young passengers
with more collective culture than that of Europe and US. In addition, the scenarios (stimuli) only assumed that flights were made to a holiday (leisure) purpose. Nevertheless, this scenario limitation may be justified as leisure travel is is close to the students’ real life.
Final limitation is that this was a lab-ex -periment study so that the value of external
validity was limited. For example, controlling the cultural differences as well as the complex departure process. Scenarios (stimuli) assume the flights were done for domestic destinations.
Though the respondents may not be able to imagine the difference of domestic and
interna-tional travel by plane.
Future studies may explore further about the
customer satisfaction in revenue management
context. Moving back to the literature review,
the customer assessment on this study is
oc-curred on pre-purchase stage which contains a
critical point of decision making to buy or not
buy. Therefore it is also recommended to ex
-plore the revenue management impact towards the customer decision making.
Future studies may deepen research on
broader subjects, such as international airlines
which have more heterogeneous characteristics or by comparing more than two brands of air -lines to obtain a clearer picture of the dynamics
References
Belobaba, P & Botimer T. (1999), Airline Pricing and Fare Product Differentiation: A New Theoreti
-cal Framework, Journal of the Operation Research Society, 50: 1085-1097.
Cooper, Donald & Pamela Schindler. (2011), Business Research Method 11th ed. New York: McGraw
Hill.
Industri Penerbangan Nasional Tumbuh Pesat. (2012, Desember 20), http://www2.tempo.co/read/ news/2012/12/20/090449437/Industri-Penerbangan-Nasional-Tumbuh-Pesat.
Kuntjoro-Jakti, Dorodjatun. (2012, Maret), Memahami Gambaran Ekonomi Indonesia Awal 2012. Lecturing Materials in Indonesian Economics, Faculty of Economics University of Indonesia Lindenmeier, Jorg & Dieter Tscheulin. (2008). The Effects of Inventory Control and Denied Boarding
on Customer Satisfaction: The Case of Capacity-Based Airline Revenue Management, Tourism Management, 29: 32-43.
Lion rules market share despite pilot cases. (2012, 5 Maret) The Jakarta Post, 2 September 2012. http:// www.thejakartapost.com/news/2012/03/05/lion-rules-market-share-despite-pilot-cases.html Lovelock, Christopher & Jochen Wirtz. (2011), Services Marketing 7th ed. New Jersey: Pearson Edu
-cation.
Lupiyoadi, Rambat (2013), Manajemen Pemasaran Jasa 3rd ed. Penerbit Salemba Empat, Jakarta
Malhotra, Naresh. (2010), Marketing Research 6th ed. New Jersey: Pearson Education.
Maxham III, J. G., & Netemeyer, R. G. (2002), A Longitudinal Study of Complaining Customer’s Evaluations of Multiple Service Failures and Recovery Efforts. Journal of Marketing, 66: 57–71. Mittal, V., Ross, W. T. & Baldasare, P. M. (1998), The Asymmetric Impact of Negative and Positive
Attribute-level Performance on Overall Satisfaction and Repurchase Intentions. Journal of Mar
-keting, 62: 33–47.
Oh, H. (2002), Price Fairness and Its Asymmetric Effects on Overall Price, Quality, and Value Judg
-ment: The Case of An Upscale Hotel. Tourism Management, 24: 397–399.
Oliver, R. L. (1980), A Cognitive Model of The Antecedents and Consequences of Satisfaction Deci
-sions. Journal of Marketing Research, 17: 460–469.
Oliver, R. L., & Swan, J. E. (1989) Equity and Disconfirmation Perceptions as Influence on Merchant and Product Satisfaction. Journal of Consumer Research, 16: 372–383.
Perreault Jr, William, Joseph Cannon & Jerome McCarthy. (2010), Basic Marketing 17th ed. New
York: McGraw Hill.
Regulation of the Minister of Transport of the Republic of Indonesia no. 77 in 2011 (Peraturan Men-teri Perhubungan Republik Indonesia no. 77 tahun 2011).
Regulation of the Minister of Transport of the Republic of Indonesia no. 26 in 2010 (Peraturan Men-teri Perhubungan Republik Indonesia no. 26 tahun 2010).
Rothstein, M. (1971), Airline Overbooking—The State of the Art. Journal of Transport Economics and Policy, 5: 96–99.
The Law of the Republic of Indonesia no. 1 of 2009 on Aviation. (Undang-Undang Republik Indone-sia no. 1 tahun 2009 tentang Penerbangan).
Zeithaml, Valarie, Mary Bitner & Dwayne Gremler. (2009), Services Marketing 5th ed. New York:
McGraw Hill.
http://www.garuda-indonesia.com. 10 September 2012. Future studies may involve more heteroge
-neous respondents and use more real stimuli (if
using experimental methods), even with the use
of field experiments so that respondents would
be more representative in representing the