3D web visualization of huge CityGML models
F. Prandi a *, F. Devigili a, M. Soave a, U. Di Staso a, R. De Amicis a
a
Fondazione Graphitech, Via alla Cascata 56/c, 28123 Trento, Italy - (federico.prandi, federico.devigili, marco.soave, raffaele.de.amicis, umberto.di.staso)@graphitech.it
Commission III, WG III/5
KEY WORDS: Rendering, 3D, OGC, CityGML, WebGL, 3D City Model.
ABSTRACT:
Nowadays, rapid technological development into acquiring geo-spatial information; joined to the capabilities to process these data in a relative short period of time, allows the generation of detailed 3D textured city models that will become an essential part of the modern city information infrastructure (Spatial Data Infrastructure) and, can be used to integrate various data from different sources for public accessible visualisation and many other applications. One of the main bottlenecks, which at the moment limit the use of these datasets to few experts, is a lack on efficient visualization systems through the web and interoperable frameworks that allow standardising the access to the city models. The work presented in this paper tries to satisfy these two requirements developing a 3D web-based visualization system based on OGC standards and effective visualization concepts. The architectural framework, based on Services Oriented Architecture (SOA) concepts, provides the 3D city data to a web client designed to support the view process in a very effective way. The first part of the work is to design a framework compliant to the 3D Portrayal Service drafted by the of the Open Geospatial Consortium (OGC) 3D standardization working group. The latter is related to the development of an effective web client able to render in an efficient way the 3D city models.
* Corresponding author
1. INTRODUCTION
The big offer of raw Geospatial Information, the opening of data from the public administration, the Volunteered geographic data communities and the demand from Industry companies like Google, Apple and Nokia, that have integrated 3D city models into their map services, are increasing the availability of semantic and geometric 3D models for several cities across Europe and World. Recently several European city (Berlin, Lyon, Wien and Rotterdam) have realized LOD2/LOD3 textured cityGML models of the whole city and released these information as Open data.
First of all, to transform this huge amount of data into useful information and support future developments and applications, it is needed to structure 3D data into a geometric and semantic data model. CityGML is an open data model and XML-based standard for the representation of 3D urban objects. It is an OGC standard (OGC, 2012) realised for the storage and exchange of virtual 3D city models and covers broad thematic fields of city objects: geometrical and topological aspects can be accurately described and linked with their semantic part. CityGML supports five Levels of Details (LODs) to reflect different data collection processes supporting different application requirements.
This work aims to develop and deploy a platform to storing, analyzing and visualizing the 3D city models via web. The main motivation of our work is to support the easily access and visualization to this huge amount of data through a web service. Two main challenges have to be faced to achieve the goal. Firstly, server architecture that allows storage and fast retrieval of large amount of data. Secondly a web client able to visualize in an effective way the data provided by the server.
The first challenge in our study is to design a suitable system architecture allowing storage and deployment of the city model. Usually, 3D city models are produced as single files and can be stored in object-relational databases. CityGML is designed to represent 3D city models, but not to present or visualise 3D city models directly, to read the geometry information directly on the cityGML file is inefficient especially considering the dimension of a whole city dataset.
The storage on database helps the complex modelling of the semantic part of the cityGML and the capabilities to make specific queries. For databases storage specific extensions for 3D city models are often used on top of the object-relational databases.
Our approach is based on the separation of the geometric and the semantic parts of the model, the first is used for the visualization the second for accessing and retrieving the related information.
The second challenge is the development of a web based client able to visualize the geometric and semantic information of the 3D city model. In this work we present two different client solutions: one, based on Nasa World Wind SDK and is deployed as a java applet currently supporting Chrome, Firefox and Internet Explorer and one based on Cesium virtual globe an Open Source JavaScript package supporting webGL an extension of HTML5 used for developing web applications requiring 3D visualization.
2. RELATED WORKS 2.1 3D City Model visualization
3D city visualization is a research topic largely investigated since the availability of these models became most used. In recent years many frameworks have been proposed for this purpose and listed by Bo (2011). In addition to these, several solutions for porting the frameworks on the web have been investigated. Indeed Web-based 3D visualisations of geospatial data become increasingly important. Internet accessing can enlarge the audience of the 3D model to large audience and professionals that typically are not expert on geospatial information but who can be benefit on their work from the usage of 3D city models.
Rodriguez et al. (2013) describes the implementation of a Web3DGIS based on the conversion of CityGML into X3D models and its visualization through the web. Some simple implementations about the use of webGL frameworks for 3D geospatial application are presented in Kramer and Gutbell (2015). Thick client based on Java Nasa World Wind virtual globe has been extended to support the visualization of 3D city models (Prandi ,et al., 2013).
To support 3D visualization on the web an emerging technology is for sure WebGL. WebGL is derived from OpenGL, and provides, in an HTML context, similar rendering functionality (Marrin, 2013). On top of WebGL a number of OpenSource frameworks that offer high-level application programming interfaces (APIs) are growth quickly on the Internet community.
In this paper, we will compare two different web client system to support the dynamic visualization of 3D city models via web; one based on the Nasa Worl Wind Java applet and the second based on the webGL framework Cesium.
2.2 Storage and service level
Object orient database are nowadays the most used means to storage 3D model building information (Long et al., 2011). In particular since the implantation of the cityGML schema in an SQL table schema (Kundle, 2013) specific dedicated tools has been developed to manage city models within most popular databases such as PostGIS and Oracle. NoSQL database (Mongodb, Hbase) have been investigated on the last years as alternative systems to storage 3D information (Mao et al. 2014, Han and Stroulia, 2012).
On to of this 3D visualization via web needs effective technologies and services to access the information requested by the client. Two main points have been investigated on previous study on this topic. On one hand the access and retrieving information on the storage system based on a client request on the other hand the standardization effort in order to ensure client to access and manage information in standard way.
The most common visualization system based on Service Oriented Architecture (SOA) provides to the client scene graphs geometry and triangle mesh and texture. Following this approach Reitz et al., (2009) and Prieto et al., (2012) developed a visualization system for 3D city models. Other applications such as Apple/C3, GoogleMaps, Microsoft bing proposes impressive visualization based on the generation of reliable meshes that are a decimated version of the original point cloud (Kuschk, 2013).
For the standardization, OGC proposes stateless portrayal services. For 3D portrayal, the Web 3D Service (W3DS) (Schilling and Kolbe, 2010) and the Web View Service (WVS) (Hagedorn, 2010) are proposed as different approaches that are both in the draft stages of the standardization process.
3. METHODOLOGY
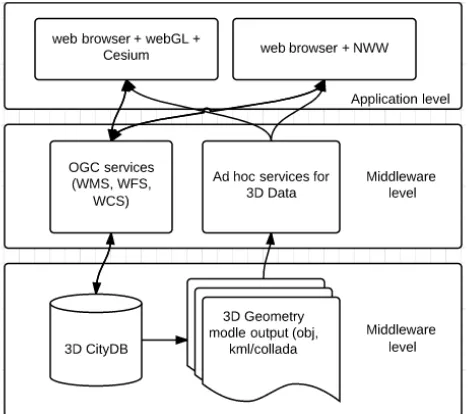
The goal of this work is to provide easily interaction with large and deeply structured semantic 3D city models through web interface. The tested solutions are based on the three levels SOA architecture composed by: information level, middleware and application level (Fig 1)
Figure 1. Three-level architecture for the 3D city model web application.
At the lowest level (Information level) the semantic 3D city models are stored. The city information from different sources can be integrated into CityGML standard common data model and integrated into a 3D CityDB spatial database, which allows efficient management of the large 3D city models.
CityGML is therefore used at the data level to store the information on the Database, however, in spite of it is designed to represent 3D city models, it is not efficient to present or visualise 3D city models directly. For this reason the 3D geometric part of the model will be stored on the information level in the most common 3D format in order to be provided to the application level.
Another middleware component is devoted to provide the 3D geometric data needed for the effective visualization of the 3D model in the web client. It can change accordingly with the different application level considered and is able to retrieve on the information level the portion of 3D City Model requested by the client, sending it in a specific optimized format.
The application level consists on the web graphical interface that allows users to access to spatial, thematic and structural information of the semantic 3D city models. The client is designed: to consume the OGC standard web services, to retrieve and to visualize the 3D city models object geometric in a effective way, to support user specific interaction through customized user interfaces,
3.1 Implementation
The Information level is formed by 3D city database (3DCityDB) that is an open source geodatabase schema containing a set of tools for management large 3D city models and in particular to import the CityGML datasets.
One of the main features of 3DCityDB is the possibility to export the geometric information of the city models in different format such as the KML/COLLADA, which is a format more suitable for visualization purpose if compared to cityGML. Furthermore the 3DCityDB implementation is based on PostGIS database, which is the spatial extension of the open source Postgres database. This allows the capability to manage the access to the database tables or views via web using standard web services developed by the OGC consortium.
The combination of these two 3DcityDB features allows us to implement our system architecture splitting the geometric part of the original 3D cityGML models from the semantic ones. The first one is stored in KML/COLLADA or other optimized graphical formats together with the specific cityGML ID of the feature; the second one is retrieved from the 3DcityDB using the OGC WFS server using the cityGML ID as query attribute.
The application level is composed by virtual globes technology. These technologies have the advantage to provide to the developers consolidated features for the management of spatial data information such as the access to tiled services for terrain and ortophotos, the methods to connect basic OGC web services and to manage openGL calls. The application level is web based and can be accessed using the web browser without having to install any software locally.
The main features of the application level are:
• Data exploration: typically virtual globes don’t allow the loading of large 3D models. In our implementation open source virtual globe clients have been extended to support tiling of large 3D models. The client is able to download and parse the geometry of the 3D models and manage the interaction with the camera loading and unloading the tiles geometry according to their visibility.
• Accessing Information: The client manages the picking of the 3D model geometries, retrieving the information accessing the WFS service deployed on top of the middleware.
• Query and functions: The client can be customized to develop vertical applications in order to satisfy particular requirements (i.e. Energy Atlas, Cadastrial Management etc.).
4. CASE STUDIES
We provide three different case studies using two of the most used, open source, 3D web virtual globe tools:
1. CesiumJS: CesiumJS is a Javascript based spinning globe. It utilizes WebGL to provide hardware acceleration and plugin independence and provides cross-platform and cross-browser functionality. CesiumJS allows the visualization of geographical data through OGC standards for data interoperability. It also allows the rendering of 3D models based on the glTF data format.
2. Nasa Java World Wind (NWW): Nasa Java World Wind is a spinning globe based on Java and JOGL OpenGL wrapper. NWW can be run inside an applet and thus deployed on a web browser. This solution supports most of the OCG standards but does not provide a way to render 3D models natively.
4.1 Nasa World Wind java applet and custom 3D format The first case study uses utilizes a Java applet based on Nasa World Wind with an optimized custom-rendering engine for 3D buildings. The data are exported from 3D CityDB at LOD2 in CityGML format, and are loaded in a custom servlet, which parse and transform the CityGML file into an OBJ compatible format called C3D. This custom format, optimized for size and parsing speed, contains only hierarchical, geometry and reference information which is then used by the client to get an object id to query a WFS service to potentially obtain all the information present in the 3D CityDB.
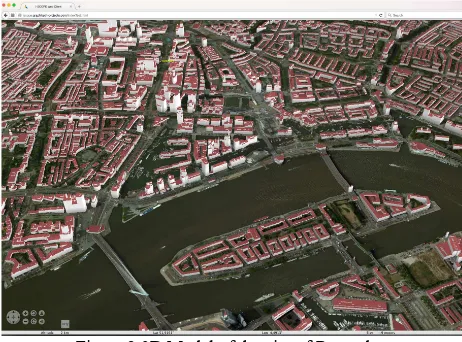
Figure 2 3D Model of the city of Rotterdam
The main features of this approach is the highly optimized rendering engine that batches geometry together in order to speed up GPU rendering process and the lightweight format used to stream geometry data to the client.
Geometry interactivity is implemented through a classical color picking algorithm which does not need to keep geometry data in system memory thus greatly decreasing CPU side memory needs. Cache systems are implemented both at application and middleware level to improve loading times and optimize servlet performances. The system has proven to be capable of handling very big city models (20 million triangles) at very good frame rates (>60fps) even on average PCs. The biggest limitation to handle very large models is GPU memory amount. The number of triangles gives current GPU memory usage; each additional feature needs additional memory.
each (9 floats values: 36bytes per triangle), which yields 30 million triangles per GB of memory. Each feature requires additional vertex attributes increasing memory usage:
Basic illumination needs to store the normal of the triangle, picking require a unique ID per feature, and textures require two-dimensional coordinates per vertex.
4.2 CesiumJS and custom 3D format
This case study utilizes the servlet implemented in the previous case but replaces the client with Cesium. A custom geometry loader is implemented with low level Cesium APIs. Each C3D file is parsed and loaded into a cesium primitive; a data structure that holds geometry information. The primitive is then rendered and handled by Cesium rendering code. Picking is also handled by Cesium routines. This high level approach can still handle large amount of data but fails to achieve the performance of a custom built rendering engine. Javascript engines running from browser’s sandboxes and WebGL current limitations and quirks lead to memory and performance problems that cannot currently be overcomed. On top of this deep knowledge of Cesium low level routines is needed to address performance and memory problems.
4.3 CesiumJS and GLTF format
The last approach is based on the use of CesiumJS and an open source component for 3D model conversion.
COLLADA2GLTF model converter: is a model converter developed by KhronosGroup (Cozzi, 2014). COLLADA2GLFT allows the generation of a glTF 3D model starting from a COLLADA file. It supports textured 3D models.
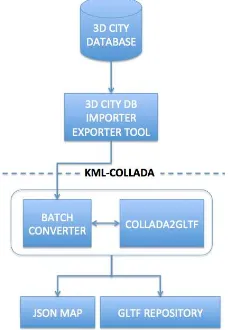
The pipeline figured in the following image shows how 3D models, exported by the 3D City DB importer/Exporter tool, are converted through a batch script that invokes, for each building, the COLLADA2GLTF component previously described.
Figure 3 - 3D City model conversion pipeline
Basically, the outputs of the workflow showed in Errore. L'origine riferimento non è stata trovata. are:
1. A file-system based collection of glTF 3D models, one for each building involved in the conversion process;
2. A JSON map, that will be used by the client in order to ensure the geo-reference of each component stored in the file. The JSON map is obtained by processing the KML
file and, in the following image, portion, for a single building is shown.
Figure 4 - Portion of the JSON map containing the references to the glTF model and coordinates for geo-referencing the object
Figure 5 – 3D textured buildings in Rotterdam
This approach has the advantage to use glTF a file format to enable rapid delivery and loading of 3D content by WebGL, OpenGL, and OpenGL ES APIs. In the future, we will expand 3D building streaming to a tiled approach to speed up the loading time.
5. CONCLUSION
Real 3D city datasets are composed by unique geometry and textures and this prevents the implementation of many optimization techniques usually adopted on modern engines (e.g. geometry instancing and texture sharing). Another problem is GPU memory management: on performance oriented graphical engines scenes (e.g. game engines) 3D models often share both geometry and texture data to save GPU memory.
Because of the nature of the data we wish to render the engine should be optimized for this purpose, we identified three important features that should be implemented to obtain good performances when rendering huge 3D city models:
1. Data streaming: The scene should be streamed to the client and loaded asynchronously, the client should start rendering the data as soon possible while still receiving it.
2. The data format should support LOD levels (both for geometry and textures) to improve memory usage, loading times and performance.
3. The client should dynamically load and unload both geometry and texture data based on visibility.
CesiumJS is a very valid platform to start working with it however it inherit Javascript limitations and performances issues which, greatly varies from browser to browser due to the different Javascript engines implementation. To this reasons current WebGL based geo-browsers fail to meet the requirements to render huge 3D city models and easiness of implementation comes at the price of usability and performance.
ACKNOWLEDGEMENTS
This paper is part of the projects SUNSHINE and Life+ IMAGINE. SUNSHINE has received funding from the EC, and it has been co-funded by the CIP-Pilot actions as part of the Competitiveness and innovation Framework Programme. Life+ IMAGINE has received funding from the EC under the Life+ program LIFE12 ENV/IT/001054.
The author is solely responsible this work which does not represent the opinion of the EC. The EC is not responsible for any use that might be made of information contained in this paper.
6. REFERENCES
Bo, M., 2011. Visualisation and Generalisation of 3D City Models. Doctoral Thesis. Royal Institute of Technology (KTH) Department of Urban Planning and Environment Division of Geodesy and Geoinformatics, SE-100 44 Stockholm Sweden. ISBN 978-91-7501-189-9.
CESIUMJS a WebGL Javascript library for 3D globes and 2D maps: http://cesiumjs.org/
Cozzi P. 2014. "glTF—the Runtime Asset Format for WebGL, OpenGL ES, and OpenGL." America: Fabrice Robinet, 2014. https://github.com/KhronosGroup/glTF
De Amicis, R., Conti, G., Piffer, S., & Prandi, F., 2011. Service oriented computing for Ambient Intelligence to support management of transport infrastructures. Journal of Ambient Intelligence and Humanized Computing, 2(3), 201-211.
Giovannini, L., Pezzi, S., di Staso, U., & Prandi, F., 2014. Large-scale Assessment and Visualization of the Energy Performance of Buildings with Ecomaps. Third International
Conference on Data Management Technologies and
Applications (DATA 2014). Wien, Austria, 2014..
Hagedorn B., 2010. Web View Service Discussion Paper, v0.6.0. Open Geospatial Consortium Inc.
Han, D., Stroulia, E., 2012. A three-dimensional data model in hbase for large time-series dataset analysis, IEEE 6th International Workshop on the Maintenance and Evolution of Service-Oriented and Cloud-Based Systems (MESOCA), pp. 47– 56. Trento, Italy, 24-24 Sept. 2012.
Prieto I., Izkara J. L., Delgado del Hoyo F. J. 2012. Efficient visualization of the geometric information of CityGML: application for the documentation of built heritage. Proceedings of the 12th international conference on Computational Science and Its Applications. Volume Part I (ICCSA'12), Beniamino Murgante, Osvaldo Gervasi, Sanjay Misra, Nadia Nedjah, and Ana C. Rocha (Eds.), Vol. Part I. Springer-Verlag, Berlin, Heidelberg, 529-544.
Krämer M., Gutbell R., 2015. A case study on 3D geospatial applications in the web using state-of-the-art WebGL frameworks. Proceedings of the 20th International Conference on 3D Web Technology (Web3D '15). ACM, New York, NY, USA, 189-197. Heraklion, Greece, 18-21 June 2015.
Kunde, F., 2013. CityGML in PostGIS : portability, usage and performance analysis using the example of the 3D City Database of Berlin. Master Thesis conducted at the Department
of Geography, University of Potsdam, 2013.
Kuschk, G., 2013. Large scale urban reconstruction from remore sensing imagery. In: IAPRS&SIS, Vol.XL-5/W1, 2013.
Long N., Fleming, K. Brackney, L., 2011. An Object-Oriented Database for Managing Building Modelling Components and Metadata. Presented at Building Simulation 2011, Sydney, Australia, November 14-16, 2011,
Marrin, C., 2013. WebGL Specification. Khronos WebGL
Working Group. Available at
https://www.khronos.org/registry/webgl/specs/1.0/ (17 June, 2015)
Mao, B., Harrie, L., Cao, J., Wu, Z., and Shen, J. (2014). NoSQL Based 3D City Model Management System, Int. Arch. Photogramm. Remote Sens. Spatial Inf. Sci., Shozu, China, XL-4, 169-173, ,2014.
OGC, 2012. OGC City Geography Markup Language (CityGML) Encoding Standard, Version 2.0. Available at: http://www.opengeospatial.org/standards/citygml (10 May 2015).
Prandi, F., De Amicis, R., Piffer, S., Soave, M., Cadzow, S., Boix, E. G., & D’Hondt, E., 2013. Using Citygml To Deploy Smart-City Services For Urban Ecosystems. International Archives of the Photogrammetry, Remote Sensing and Spatial Information Sciences, 4, W1.
Reitz T., Kramer M., Thum S., (2009): A processing pipeline for X3D earthbased spatial data view services. Proc. 14th International Conference on 3D Web Technology, Darmstadt, Germany, 16-17 June 2009, pp. 137-145.
Rodrigues J. I., Figueiredo M., Da Costa C., 2013. Web3DGIS for City Models with CityGML and X3D. 17th International Conference on Information Visualisation, University of London, London, UK 15-18 July 2013, pp.384-388,