Estimating tree crown dimensions using digital analysis
of vertical photographs
P.L. Brown
a,b,∗, D. Doley
a,b, R.J. Keenan
a,caCooperative Research Centre for Tropical Rainforest Ecology and Management, Cairns, Queensland 4870, Australia bDepartment of Botany, The University of Queensland, St Lucia, Queensland 4072, Australia
cBureau of Rural Sciences, P.O. Box E11, Kingston, ACT 2604, Australia Received 10 May 1999; received in revised form 30 August 1999; accepted 17 September 1999
Abstract
The aim of this study was to develop a relatively rapid, simple and repeatable method to characterize the crown architecture of Queensland maple (Flindersia brayleyana F. Muell.) by vertical hemispherical photography. Calibration scales were developed to provide horizontal planes of measurement at heights from 15 to 40 m above the camera. Hemispherical images of tree crowns were merged with the specific calibration scale appropriate for the mid-height of the crown in order to adjust for image distortion during measurement. Merged images were analyzed by three procedures to yield measurements of crown diameter and projected area. The most precise measurement of projected crown dimensions was assumed to be provided by a complete analysis of a digital image of the crown, after removal of the trunk image. Crown diameters estimated by tape measurements on the ground were relatively imprecise (R2=0.54). Crowns classified as symmetrical were described much
more precisely (R2=0.72) than those classified as asymmetrical (R2=0.37). The precision of estimates of crown dimensions by tape did not alter significantly over the range of crown sizes sampled (2–10 m diameter in trees 15–40 m tall). This novel image analysis method can yield relatively precise and accurate measurements on the relatively shallow crowns of tall trees, often found in rainforests, regardless of the degree of asymmetry in crown shapes. However, the method is slower to apply than conventional tape techniques and additional equipment is required. The principal advantage of the photographic technique is the opportunity for precise measurements of changes in crown size and foliage projected area over time. ©2000 Published by Elsevier Science B.V. All rights reserved.
Keywords: Tree crowns; Crown asymmetry; Crown diameter; Crown projected area; Hemispherical photography; Radial distortion
1. Introduction
Vertical photographs of forest canopies provide detailed information about radiation regimes within forests, which can be used to predict individual tree and stand growth (Koop, 1989). In tropical rainforests,
∗Corresponding author. Tel.:+61-7-3365-2768; fax:+61-7-3365-1699.
E-mail address: [email protected] (P.L. Brown).
where the availability of light is most limiting to the growth of individual trees below the main canopy, applications of radiation measurements may prove crucial for improving existing tree growth prediction models (Landsberg and Gower, 1997). Vertical pho-tographs currently contain some of the most precise and detailed information on forest radiation regimes but their utility has been restricted largely by the difficulty of making accurate repeatable estimates. Application of radiation-based tree growth models
to individual trees requires improvements in the de-scription of radiation interactions by their crowns in structurally complex forests. These interactions need to be estimated with considerable precision, and im-portant small-scale changes in crown dimensions are difficult to estimate in any tall or complex forests, such as those of the wet tropics.
There is increasing global interest in expanding the range of species used in timber plantations, as a substitute for native forest utilization. This inter-est is particularly strong in the wet tropics, where many broad-leaved species are being proposed for plantation management (Evans, 1982; Rowe et al., 1991; Ferris-Kaan, 1992). The successful adoption of broad-leaved species, many with irregular crown shapes at a relatively early age, depends largely on the definition of their optimum silvicultural requirements. An understanding of a species crown architecture is fundamental to designing silvicultural prescriptions (Dawkins, 1963; Suri, 1975; Samarasinghe, 1995; Dhanesh Kumar et al., 1997), and this understanding is usually built upon accurate measurements of plant dimensions which reflect the photosynthetic potential of individual trees.
Plant dimensions such as crown projected area and diameter are often used as surrogates for crown photosynthetic potential and foliage area (Jahnke and Lawrence, 1965), but they are usually derived from relatively imprecise measurements taken from the ground (Philip, 1994). Consequently, there is a need for better techniques for measuring these attributes.
The measurement of crown dimensions can be par-ticularly difficult in rainforest broad-leaved species, because of irregular crown shapes. Light environments of tropical rainforests are often more heterogeneous than those of temperate forests (Whitmore and Burn-ham, 1984) and the development of asymmetric crown shapes has been postulated as a plastic response to this heterogeneity (Umeki, 1995). Most conventional methods for measuring crown diameter and projected area assume that crown projections are either a solid circle or solid ellipsoid shape (Wilkinson, 1995; Big-ing and Gill, 1997). Therefore, such methods vary in precision according to the degree crowns depart from simple geometric shapes (Biging and Gill, 1997; Zeide, 1998).
Airborne and satellite remote sensing techniques, that measure specific forest attributes, are rapidly
im-proving in their discriminative capacity. For example, surface Lidar remote sensing systems now have the capacity to rapidly obtain information at the stand level on canopy height, total biomass, leaf biomass, basal area and percentage cover (Means et al., 1999). Lidar systems can operate at a nominal footprint diameter of 10 m yet currently lack the capacity to allow measurements of the dimensions of individ-ual tree crowns (Lefsky et al., 1999). Stereo pairs of co-registered aerial photographs have been used effectively to monitor changes in co-dominant and emergent tropical rainforest crown dimensions over the longer term (18 years) (Herwitz et al., 1998a). However, even when using photographs taken at large-scales from low flying aircraft, such techniques currently lack the discrimination needed to accurately monitor smaller changes in tree crown dimensions in complex forest systems, particularly on individuals with irregular crown shapes or those growing in sub-dominant positions (Herwitz et al., 1998b). Vertical photography has also been used to determine tree crown dimensions. Koop (1989) used stereo-pairs of vertical photographs taken a short distance apart to convert small image displacements between the photographs into distance and crown area estimates. Acceptable precision was achieved even on smaller crown sizes, but at considerable cost per tree. Koike (1985) reconstructed two-dimensional canopy pro-files from clusters of vertical photographs processed by computed tomography. This procedure is very de-manding of resources particularly when the distance between the camera and subject varies substantially. Chen et al. (1991) measured plant area index using both the analysis of hemispherical photographs and a Plant Canopy Analyzer (Li-Cor LAI-200) on the same crowns. They found that both methods were in agreement when the hemispherical photographs were underexposed four to five stops below that recom-mended by an upward facing light meter. Although, the study by Chen et al. (1991) refines and validates the use of hemispherical photos to measure plant area index the need remains for a relatively quick, sim-ple and accurate method of estimating small crown diameters on tall trees.
Muell.). This species is highly prized as a cabinet tim-ber and is endemic to the wet tropics region of eastern Australia, where its supply from native forests has all but ceased (Cameron and Jermyn, 1991). Bazzaz and Pickett (1980) suggest maple is a middle-order suc-cession species and evidence is increasing that it can survive in a wide range of light conditions (Thompson
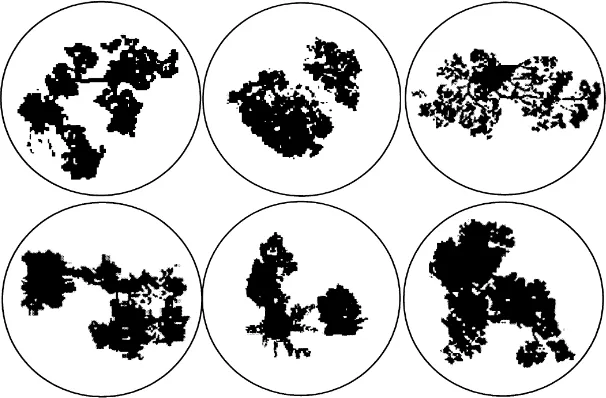
Fig. 1. Images of crown projected areas typifying the asymmetrical group (six above) and symmetrical group (six below). A circle of known dimensions at a known height encompasses each crown however the relative scale of these circles has been altered for individual crowns to a standard diameter for the diagram.
The aim of this study was to develop a simple, re-peatable method for measuring crown diameter and projected area using vertical photographs. This aim evolved out of the need to characterize the crown ar-chitecture of Queensland maple, for we were partic-ularly interested in obtaining accurate measurements on crowns with irregular or asymmetrical shapes.
2. Methodology
The photographic method of crown measurement was developed by calibrating images taken of objects with known dimensions at known distances from the camera. The method was then applied in a 66-year-old plantation of Queensland maple. This plantation is at Gadgarra State Forest, 17◦17′S 145◦43′E, and 640 m above sea level on the Atherton Tablelands in north Queensland. Measurements using the photo-graphic method were compared with a conventional ground-based method using a tape (Philip, 1994). Both methods were applied to the same maple crowns. Crown diameters were measured on 147 maple trees in an unthinned, 66-year-old plantation. The measured stand was then thinned in order to release the best potential crop trees. This thinning operation isolated and facilitated the definition of the crowns used in this study. Also, all the understorey plants were removed in order to obtain a clear view of the canopy structure. Estimation of projected crown dimensions by tape involved two measurements of crown diameter, on North–South and East–West axes as located by com-pass (Philip, 1994). Most crowns were asymmetrical to varying degrees, so measurements were made with-out reference to the position of the stem. Crown ex-tremities were located by looking vertically from the ground and crown diameter was calculated as the mean of the two axis lengths.
The photographic method involved:
1. Calibration of image estimates using standards; 2. Refining methods to capture crown images; 3. Processing images using image analysis software; 4. Calculating crown dimensions from processed im-ages in ‘Hemiphot’ (ter Steege, 1994), a software package designed for hemispherical image analy-sis.
A Canon hemispherical lens (7.5 mm) was used throughout this study. Its use was not driven by an
inherent superiority in its ability to record the visible extent of crowns for all spherical lenses create radial distortions, particularly in the periphery of the field and these limit the accurate estimation of area in im-age components. The best lens for a given task is the longest focal length that can capture the entire dimen-sions of the largest size crown(s) under investigation, as this minimizes radial distortions. Seldom is a sin-gle crown so large that it requires a hemispherical lens for complete capture. However, in studies that require additional information on both a target crown and its spatial relationships with its nearest neighbors, a hemi-spherical lens with its large field of view may have advantages. A hemispherical lens was chosen for this study because hemispherical images were required for stand canopy analysis in the ‘Hemiphot’, image anal-ysis package (ter Steege, 1994).
2.1. Calibration of image estimates using standards
To enable horizontal projected area calculations to be derived from a spherical image, allowance had to be made for the effects of both perspective and radial distortion. Perspective affects all images regardless of the lens focal length, but radial distortion occurs only with a spherical lens. The effects of radial distortion are largest near the lens boundary and least near the lens axis and they increase as the focal length of the lens decreases. Calibrations for radial distortion have been noted for a variety of hemispherical lenses (Her-bert, 1987; Clark and Follin, 1988), and the process should be completed for each lens.
Templates for the measurement of distance on pho-tographic images were made from a set of six calibra-tion images specific for a Canon 7.5 mm lens. To pre-pare these calibration images nine pegs were placed 2 m apart along a straight line in a relatively flat and open field. The centre peg was used as the beginning of a line perpendicular to the first line, along which six positions were marked off at 5 m intervals between 15 and 40 m.
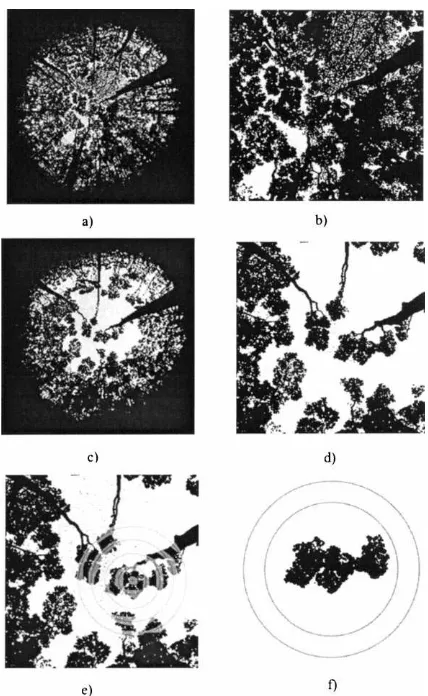
Fig. 2. Image manipulation and the effect of thinning on crown visibility. Image (a): Full hemispherical view taken prior to thin-ning. Image (b): 50×50 pixel subset of the centre of image (a) (note the difficulty in defining the full extent of individual crowns). Image (c): Same location as image (a) taken after thinning. Image (d): 50×50 pixel subset of the centre of image (c). Image (e): Merging the area-defining template on image (d). Image (f): Final merged image, ready for cover calculation in Hemiphot.
into the Adobe Illustrator drawing package (Adobe, 1997). Four concentric rings were drawn around the centre peg giving the appearance of a shooting target or ‘bulls-eye’ (see Fig. 2e).
The limits to calibration dimensions were estab-lished from those encountered in the measured plan-tation, where tree heights ranged from 15 to 40 m and crown diameters up to 10 m. The row of pegs in images represented a horizontal plane in the forest canopy and the photo point the actual lens position near the forest
floor. Due to the effects of radial distortion, the fixed distances between pegs appeared in images to be sym-metrically and progressively reduced away from the centre peg. Due to perspective, the further the line of pegs was from the camera, the smaller the resulting sets of rings in templates.
2.2. Capturing crown images
Throughout this study 400 ASA, Ilford, HP5 film was used in a Canon T60 body with the Canon 7.5 mm fish-eye lens (1 : 5.6). Procedures for tak-ing vertical photographs in forest environments are well documented (Becker et al., 1989; Barrie et al., 1990; Chen et al., 1991; Schaffer et al., 1991) (www.gemlab.ukans.edu/hp/). Photographs of the crowns were taken at a time when the contrast be-tween sky and vegetation components was maximal. This required even illumination in the sky background and no direct sunlight being reflected by target vegeta-tion. These conditions usually occurred at sunrise and sunset or on days with a dense and even cloud cover. Windy periods were avoided because of crown sway. Consistency in the speed of exposure relative to the prevailing light conditions is important. Chen et al. (1991) showed that variation in shutter speed for the same image taken at the same time causes large vari-ation in canopy cover estimates. In this study, prior to each exposure, a light reading was taken with a Minolta Auto Meter IV F. After some testing, it was found the best contrast was achieved by increasing the shutter speed (underexposing) three conventional levels above that recommended by the meter. Shut-ter speeds calculated this way are not independent of the site cover (Chen et al., 1991). However, indepen-dent readings were not available due to an absence of nearby canopy openings of sufficient size.
2.3. Selection of photo-points in the forest
Ground points for photographs were selected using the following three criteria:
1. Photo-points must be vertically below the target crown;
3. The number of photo-points for each crown was a function of its size (horizontal extent). Some large crowns were photographed from four points, while the smallest crowns were photographed from one point.
The lens was orientated as close as possible to ver-tical using a tripod with a geared head and finely cal-ibrated bubble level on the camera body. The recent innovation of a self-leveling mount (Oberbauer et al., 1993; Rich et al., 1993) (marketed by Delta T Devices, Cambridge UK) would make this process faster.
2.4. Image processing and analysis
Exposed negatives were scanned twice using a Kodak Professional RFS 2035 Film Scanner. Critical factors in scanning include resolution, contrast and brightness. The first image was scaled to take in the entire hemisphere at a resolution of 1000 dpi and used to calculate the image centre. The second image, which took in a 50×50 pixel (screen resolution) sub-set of the image centre, focused on the target crown and its nearest neighbors. It contained only those
components in the inner 30◦ solid angle
surround-ing the lens axis and was digitized at a resolution of 2000 dpi (Fig. 2). The same screen scale and resolu-tion was used throughout all scanning procedures and a contrast value of 20, the maximum for the Kodak Film Scanner, was used throughout the study.
Brightness settings varied between 5 and 10, de-pending on the visibility of texture within vegeta-tion components. This variavegeta-tion in brightness settings caused less than 2% variation in cover readings. The texture of vegetation was an unnecessary detail in this study that could confound results. Therefore, gray tones representing vegetation were kept as close to black as possible.
All images (including calibration templates) were
saved in a PCX format and converted to a 400×400
screen pixel scale in ‘Adobe Photoshop’ (Adobe Sys-tems., 1996). This was the only common format and maximum size acceptable in ‘Hemiphot’ (ter Steege, 1994). Using the above settings in a more recent model of scanner, the Nikon Coolscan II LS-20E, images were obtained with a crisper appearance, but with sim-ilar cover readings (<1% variation).
When using a spherical lens, knowledge of the proximity of crown components to the centre of the
image or lens axis is necessary to determine the accu-racy of area measurements. Heavy shade from dense vegetation on the image periphery made it impossible to clearly define the edge of the full hemispherical images of crowns. Inverting the image (sky-black, vegetation-white) improved edge resolution, but it was still not always possible to clearly define the min-imum of three boundary points, necessary to locate the image centre.
The image boundary is constant and set by the lens focal length. A circle at this specific diameter was cre-ated and used as a template to fit as closely as possi-ble on the diffuse boundary of the full hemispherical images of the crown. The inverted crown image was overlain with a circle template in Adobe Photoshop (Adobe Systems., 1996).
2.5. Manipulation of crown images
Digitized crown images were recorded in 256 gray-tones. Converting all sky components to white and all vegetation components to black increased the accuracy of final cover estimates in Hemiphot by sharpening sky-vegetation boundaries. The Adobe Photoshop program (Adobe Systems., 1996) was used to perform black and white conversions at a variable threshold level.
A histogram was created within Adobe Photoshop (Adobe Systems., 1996), representing the pixel dis-tribution of all 256 gray-tones, from light to dark, within the image. Within this histogram the distribu-tion of pixels representing vegetadistribu-tion components and sky could be separated and the accuracy of the photo-graphic methodology in maximizing contrast between sky and vegetation could be determined.
2.6. Isolation of a target crown
overlap, the trunk was erased perpendicular to its axial direction.
2.7. Merging crown images with an calibration templates
The height of the calibration template (distance from photo point to the perpendicular line of pegs) corresponded to the height of the crown mid-point, or the mean of live crown base and top height (Philip, 1994). The accuracy of crown projected area estimates is directly proportional to the total tree height/crown depth ratio. The larger the distance between the mea-surement plane and the actual locations of maximum horizontal extension the greater the error resulting from inadequate calibration for perspective in images. For example, conifer stands with deep narrow crowns are unsuited to its application, due to the high proba-bility that the applied plane of horizontal measurement would be a relatively large vertical distance from the actual locations of maximum horizontal extension.
Acceptable values of the tree height/crown depth ratio exceed 2.5 and all trees in the present study sat-isfied this criterion.
The modified image of a single, isolated and trunk-less crown was merged with the appropriate calibration template in Adobe Photoshop (Adobe Systems., 1996). In these merged images, the crown image formed the bottom layer and the appropriate calibration template the upper layer. Before merg-ing, the calibration template was reduced to a 50% transparency (using the opaque tool) so that both the target crown and the templates concentric circles were visible in the overlaid image (Fig. 2). Circles and sections of the upper layer overlapping the crown were removed using the eraser tool resulting in im-ages where crowns were enclosed by a single circle. These layers were merged and saved in PCX format for analysis in Hemiphot (Fig. 2).
Two methods were tested for positioning the cali-bration template on the modified crown image:
1. Centering the calibration template on the centre of the photographic image (theoretically the most accurate placement);
2. Centering the area template on the approximate centre of the target crown (without reference to the image centre).
Photographic points on the ground were selected to minimize the linear difference between the cen-tre of the target crown and cencen-tre of the image. Centering the calibration template on the crown saved considerable processing time and caused no more than 3% difference from the estimates de-rived from photographic-centered templates. This acceptable reduction in accuracy was attributed to the fact that all target crowns were located within
20◦ of the lens axis, a zone of limited radial
distortion.
2.8. Hemiphot analysis
Each concentric ring of the calibration template rep-resented an increment in radius of 2 m from its cen-tre. Given the limited depth of the tree crowns (usu-ally less than 5 m) and their height above the lens (be-tween 15 and 25 m), the height of each crown mid-point generally corresponded with the height of its lateral extremities. As a result the circular calibration template fitted to each target crown depicted an imag-inary yet plausible horizontal surface corresponding to the height of the target crown’s maximum lateral extension.
Percentage crown cover was calculated with a cir-cular calculation template (annex) in the Hemiphot program (ter Steege, 1994). The user sets both the size and position on the image of this circular calcula-tion template. The merged crown image was imported into Hemiphot and the circular calculation template was overlaid onto the merged image circle (of known diameter), which encompassed the target crown. The percentage cover of the target crown within this merged image circle could then be derived and con-verted into an estimate of crown projected area. Final estimates of crown projected area were made from one to four, but mostly two different images of the target crown. Crown diameter was calculated by the diameter of a circle equivalent of the crown-projected area.
2.9. Linear image estimates
A rapid estimate of crown size on photographic images can be obtained by measuring linear dimen-sions at fixed orientations. All images were orientated with the north point at the top and the crown di-ameters on the cardinal axes were measured using the pixel-locating tool in Adobe Illustrator (Adobe, 1997). Linear pixel measurements were converted into distance by calibration with the pixel diameter of the encompassing circle, which was known for each tree. This technique was applied in the following two ways:
1. A rigid rule where the cut-off point depicting the crown’s extremities in each cardinal direction was at the point of greatest lateral extension, no matter how small or isolated the associated cluster of leaves may be;
2. A flexible rule whereby account was taken of small and isolated lateral extremities and a mean crown extremity was estimated by eye.
It was observed that most crowns were made up of clusters of discrete units (Fig. 1) and as a re-sult it was expected that the rigid approach, that took no account of gaps in cover within the crowns area, would result in overestimates of crown pro-jected area. The second approach was developed as a rapid, subjective method for increasing the accuracy of these linear image estimates. The outcomes of both of these approaches have been compared in the results.
To further analyze the differences between results from the tape and photographic techniques, crowns were divided into two groups according to their degree of asymmetry, viz.:
1. Symmetric crowns were made up of one-two dis-crete units and were often lightly skewed to the cardinal axes (69% of the total sample). A single or two unit crown was determined as symmetric if a superimposed circle that encompassed the entire crown with the minimum diameter, had more than 70% vegetation cover within it. In encompassing circles with less than 70% cover, the cover distri-bution must be even throughout all quadrants. The total amount of cover contained in each quadrant was estimated and if any two of these four values varied more than 50% the crown was deemed as asymmetric;
2. Asymmetric crowns with either three or more, discrete units or one to two heavily skewed or highly irregular crown units according to the above rule. A crown unit was considered discrete when the distance between adjacent clusters was greater than the diameter of clusters. Crowns deemed as asymmetric made up 31% of the total sample.
This description of crown symmetry differs some-what from Umeki (1995) who places more importance on the spatial relationship between crown and trunk.
Tape and linear image estimates were compared with Hemiphot estimates through t-tests that utilized regression coefficients (two sample t-tests) and a relative variable derived from tape or rule method es-timate/Hemiphot estimate (one sample t-tests). T-tests on regression coefficients were calculated with sig-nificance levels adjusted according to Bonferoni’s rule.
3. Results and discussion
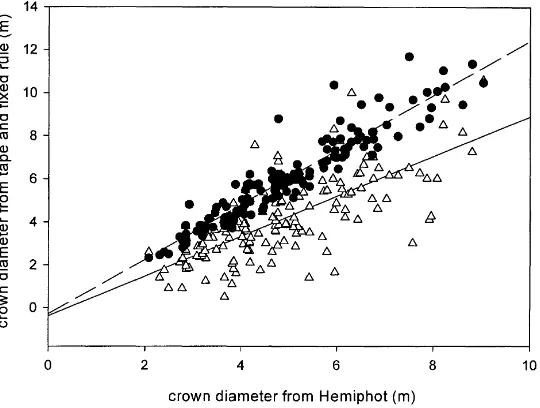
There was a significant but not close relationship between the estimates of crown diameter obtained by tape in the field and image estimates obtained by Hemiphot analysis (R2=0.54) (Fig. 3). Both the fixed and flexible image rule methods had significant and close relationships with Hemiphot, with R2values of 0.9 and 0.88, respectively (see Fig. 4, and Table 1). The tape method gave significantly lower estimates of crown diameter than the Hemiphot method, with 78% of the tape estimates being lower than Hemiphot esti-mates. The fixed rule method gave significantly larger crown diameters than the Hemiphot method (99.3% of fixed rule estimates > Hemiphot estimates). Whereas the flexible rule method resulted in estimates with no significant difference in diameter from the Hemiphot estimates. However, the estimates derived from the flexible rule method may not be consistently repeat-able due to the high degree of subjectivity implicit in this rules application.
A comparison of tape with Hemiphot estimates re-vealed a stronger relationship for symmetric crowns
(R2=0.722) than asymmetric crowns (R2=0.37).
Fig. 3. The relationship between tape, fixed rule and Hemiphot methods using absolute estimates on both axes. Solid circles and the broken lines represent the fixed rule crown estimates and regression. Open triangles and the solid line represent the tape crown estimates and regression. There is a significant difference between these two regression slopes.
crowns and the smallest differences between the two techniques occurred in the most symmetric crowns (Fig. 5 and Table 1). The accentuation of differences between the image and tape techniques, as crowns become more asymmetric, is probably a result of
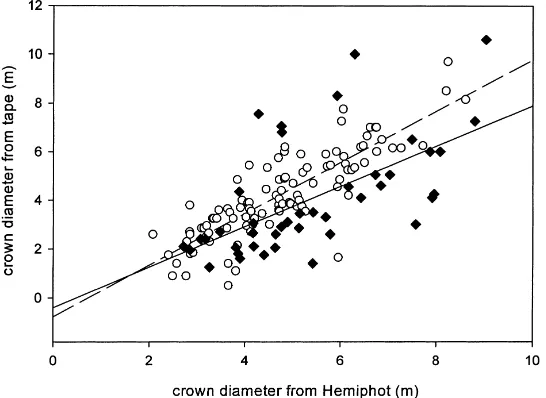
Fig. 4. The relationship between flexible rule, fixed rule and Hemiphot methods using absolute estimate values on both axes. Solid circles and the broken lines represent the fixed rule crown estimates and regression. Open triangles and the solid line represent the flexible rule crown estimates and regression. There is a significant difference between these two regression slopes.
Table 1
Correlation coefficients with slope and error parameters for linear regressions on relationship between all methods investigateda
Independent Dependant A B R2 Similarity
Hemiphot tape −0.386±0.367 0.927±0.071 0.54 a
Hemiphot fixed rule −0.295±0.187 1.270±0.036 0.90 b
Hemiphot flexible rule 0.037±0.146 0.942± 0.028 0.88 a
Fixed rule tape −0.021±0.362 0.705±0.052 0.56 c
Flexible rule tape −0.145±0.350 0.925±0.071 0.54 d
Hemiphot (symmetric)b tape −0.776±0.320 1.054±0.064 0.72 a
Hemiphot (asymmetric)b tape −0.404±0.964 0.8828±0.171 0.37 a
aThe linear relationships between methods which have the same letter in the similarity column are not significantly different (P=0.05). bSymmetric and asymmetric categories were developed by dividing all crowns according to their degree of asymmetry (see text in Section 2).
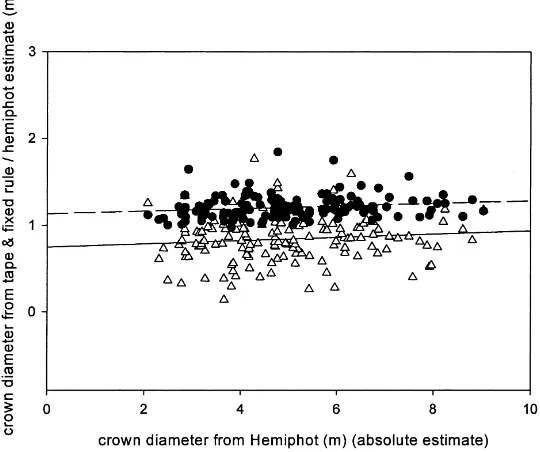
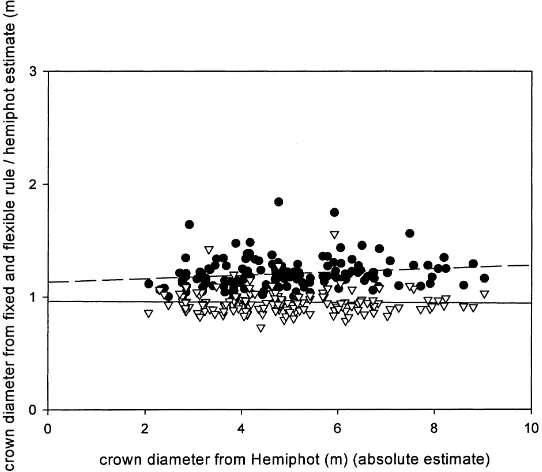
The differences between tape and Hemiphot es-timates for the same crown did not vary signifi-cantly over the range of crown sizes measured (Fig. 6). This consistent pattern of error between the tape and Hemiphot techniques occurred within both the asymmetrical and symmetrical crown groups (Fig. 7). Differences between estimates from fixed rule, flexible rule and Hemiphot techniques did not vary significantly over the range of crown sizes (Fig. 8).
Using the Hemiphot based method as the standard against which to compare other methods, the most accurate and precise technique for measuring crown
Fig. 5. The relationship between tape and Hemiphot methods for crowns in the asymmetrical and symmetrical categories using absolute estimate values on both axes. Open circles and the solid line represent the symmetrical group and regression. Closed diamonds and the broken line represent the asymmetrical category and regression. There is no significant difference between these two regression slopes.
diameters in this trial was found to be the flexible rule method followed by the fixed rule method. The tape method, though more precise when applied to symmetric than asymmetric crowns was overall the least precise and accurate method for measuring crown diameter in this study (Table 1).
Fig. 6. The pattern of differences between the tape, fixed rule and Hemiphot methods. The solid circles and broken line represents a relative measure and regression for the difference between the fixed rule and Hemiphot techniques where Y=fixed rule/Hemiphot estimate. Therefore, Y values of 1 indicate identical measures by both techniques. The open triangles and solid line represents a relative measure and regression on the difference between the tape and Hemiphot techniques where Y=tape/Hemiphot estimate. Both regressions are not significantly different from zero.
Fig. 8. The pattern of differences between the fixed rule, flexible rule and Hemiphot methods. Open triangles and solid line represents a relative measure and regression on the difference between the flexible rule and Hemiphot techniques where Y=flexible rule/Hemiphot estimate. Therefore, Y values of 1 indicate identical measures by both techniques. The solid circles and broken line represents a relative measure and regression for the difference between the fixed rule and Hemiphot techniques, where Y=fixed rule/Hemiphot estimate. Both regressions are not significantly different from zero.
conventional tape methods, when measurements of symmetrical crowns are required once only, partic-ularly where crown diameter exceeds one third of tree height. However, both the flexible rule and in particular the Hemiphot method give the possibility of accurate, repeated measurements that reveal small changes in crown and canopy gap dimensions over time. For example, when using the Hemiphot method, the presence or absence of vegetation within one pixel can be recorded (which may represent a 16 cm2 area at a subject height of 15 m). Most conventional techniques for calculating crown dimensions are less sensitive for quantifying small changes in these di-mensions, including the accurate, non-meteorological approach involving the calculation of species spe-cific allometric relationships to sapwood basal area at breast height (Waring, 1983). The Hemiphot based method could have distinct advantages over conven-tional techniques in a wide range of studies including monitoring:
• Crown response to thinning;
• Crown interactions with competing or coexisting
neighbors;
• Crown condition and forest health;
• The effects of defoliation by insects or storms and recovery following these events;
• Crown thickening or infill as well as crown expan-sion, in response to a range of silvicultural treat-ments.
Acknowledgements
Financial support from the Cooperative Research Centre for Tropical Rainforest Ecology and Manage-ment in Cairns, North Queensland. Support from the Forestry Office in Atherton, part of the Queensland Department of Primary Industries (DPI), in particu-lar help was given from DPI staff: Mark Annandale, Arthur Wright, Mila Bristow and Kerry Hanrahan.
References
Adobe Systems., 1996. Adobe photoshop: photo design and production tool. Adobe Systems Incorporated, San Jose. Adobe, Systems., 1997. Adobe illustrator: illustration tool. Adobe
Systems Incorporated, San Jose.
Barrie, J., Greatorex-Davies, J.N., Parsell, R.J., Marrs, R.H., 1990. A semi-automated method for analysing hemispherical photographs for the assessment of woodland shade. Biol. Conserv. 54, 327–334.
Bazzaz, F.A., Pickett, S.T.A., 1980. Physiological ecology of tropical succession. Ann. Rev. Ecol. Systems 11, 287–310. Becker, P., Erhart, D.W., Smith, A.P., 1989. Analysis of forest
light environments part I. Computerized estimation of solar radiation from hemispherical canopy photographs. J. Agric. For. Meteorol. 44, 217–232.
Biging, G.S., Gill, S.J., 1997. Stochastic models for conifer tree crown profiles. For. Sci. 43 (1), 25–34.
Cameron, D.M., Jermyn, D., 1991. Review of plantation performance of high value rainforest species. CSIRO and Queensland Forestry Service.
Chen, J.M., Black, T.A., Adams, R.S., 1991. Evaluation of hemispherical photography for determining plant area index and geometry of a forest stand. Agric. For. Meteorol. 56, 129–143. Clark, J.A., Follin, G.M., 1988. A simple equal area calibration
for fisheye photography. Agric. For. Meteorol. 44, 19–25. Dawkins, H.C., 1963. Crown diameters: their relation to bole
diameter in tropical forest trees. Commonwealth For. Rev. 42, 318–333.
Dhanesh Kumar, P., Rajesh, N., Santhosh Kumar, K., Vidyasagar, K., Anaz, M.A., 1997. Crown diameter/bole diameter relationship as an aid to thinning in teak (Tectona grandis L.). Ind. J. For. 20 (4), 355–361.
Evans, J., 1982. Plantation Forestry in the Tropics. Claredon Press, Oxford, New York, p. 472.
Ferris-Kaan, R., 1992. Forests and biodiversity — a brief review of the issues. In: Ferris-Kaan, R. (Ed.), Managing Forests for Biodiversity. Forestry Commission, Edinburgh, pp. 1–2. Herbert, T.J., 1987. Area projections of fisheye photographic
lenses. Agric. For. Meteorol. 39, 215–223.
Herwitz, S.R., Slye, R.E., Turton, S.M., 1998a. Co-registered aerial stereopairs from low-flying aircraft for the analysis of long-term tropical rainforest canopy dynamics. Photogram. Eng. Remote Sens. 64 (5), 397–405.
Herwitz, S.R., Slye, R.E., Turton, S.M., 1998b. Redefining the ecological niche of a tropical rainforest canopy tree species using airborne imagery: long-term crown dynamics of Toona
ciliata. J. Trop. Ecol. 14 (5), 683–703.
Jacobs, M.R., 1955. The Growth Habits of Eucalypts. Australian Government Printer, Canberra, p. 198.
Jahnke, L.S., Lawrence, D.B., 1965. Influence of photosynthetic crown structure on potential productivity of vegetation, based primarily on mathematical models. Ecology 46 (3), 319–326. Koike, F., 1985. Reconstruction of two-dimensional tree and forest
canopy profiles using photographs. J. Appl. Ecol. 22, 921–929. Koop, H., 1989. Forest Dynamics. SILVI-STAR: A Comprehensive
Monitoring System. Springer, Berlin, p. 229.
Landsberg, J.J., Gower, S.T., 1997. Applications of Physiological Ecology to Forest Management. Academic Press, San Diego, p. 354.
Lefsky, M.A., Harding, D., Cohen, W.B., Parker, G., Shugart, H.H., 1999. Surface Lidar remote sensing of basal area and biomass in deciduous forests of Eastern Maryland. USA Remote Sens. Environ. 67, 83–98.
Means, J.E., Acker, S.A., Harding, D.J., Blair, J.B., Lefsky, M.A., Cohen, W.B., Harmon, M.E., McKee, W.A., 1999. Use of large-footprint scanning airborne Lidar to estimate forest stand characteristics in the Western Cascades of Oregon. Remote Sens. Environ. 67, 298–308.
Ng, F.S.P., 1976. Shyness in trees. Nat. Malaysiana 2, 153–159. Oberbauer, S.F., Clark, D.B., Clark, D.A., Rich, P.M., Vega, G.,
1993. The light environment, gas exchange and annual growth of saplings of three species of rainforest trees in Costa Rica. J. Trop. Ecol. 9 (4), 511–523.
Philip, M.S., 1994. Measuring Trees and Forests. CAB International, Wallingford, UK, p. 310.
Rich, P.M., Clark, D.B., Clark, D.A., Oberbauer, S.F., 1993. Long-term study of solar radiation regimes in a tropical wet forest using quantum sensors and hemispherical photography. Agric. For. Meteorol. 65 (1–2), 1993.
Rowe, R., Sharma, N., Browder, J., 1991. Deforestation: problems, causes and concerns. In: Sharma, N. (Ed.), Managing the World’s Forests. Kendall/Hunt Publishing Co., Dubuque, pp. 33–45.
Samarasinghe, S.J., 1995. Thinning guidelines for tree species of different successional status. J. Trop. For. Sci. 8 (1), 44–52. Schaffer, B., Ploetz, R.C., Mason, L.J., 1991. A simple method
for quantifying light transmission through hemispherical photographs of plant canopies. Hortscience 26, 208. Suri, S.K., 1975. Quantitative thinning model with particular
reference to Sal forests of Changbhakahar Forest Division (Madhya Pradesh). Ind. For. 101 (1), 80–89.
Swanborough, P.W., Doley, D., Keenan, R.J., Yates, D.J., 1998. Photosynthetic characteristics of Flindersia brayleyana and
Castanospermum australe from tropical lowland and upland
sites. Tree Physiol. 18, 341–347.
ter Steege, H., 1994. HEMIPHOT: a programme to analyze vegetation indices, light and light quality from hemispherical photographs. The Tropenbos Foundation, Wagningen, The Netherlands.
brayleyana F. Muell., a rainforest tree with broad tolerance to
sun and shade. Aust. J. Plant Physiol. 15, 299–315.
Umeki, K., 1995. A comparison of crown asymmetry between
Picea abies and Betula maximowicziana. Can. J. For. Resour.
25, 1876–1880.
Waring, R.H., 1983. Estimating forest growth and efficiency in relation to canopy leaf area. In: Macfadyen, A., Ford, E.D. (Eds.), Advances in Ecological Research. Academic Press, pp. 327–354.
Whitmore, T.C., Burnham, C.P., 1984. Tropical Rainforests of the Far East: With a Chapter on Soils by C.P. Burnham. Clarendon Press, Oxford, Oxfordshire, p. 352.
Wilkinson, D.M., 1995. Modeling tree crowns as geometric solids. Arboric. J. 19, 387–393.