____________________________________
A NEW METHOD FOR GEOMETRIC QUALITY EVALUATION OF REMOTE SENSING
IMAGE BASED ON INFORMATION ENTROPY
Weili Jiao*, Tengfei Long, Guang Yang, and Guojin He
Institute of Remote Sensing and Digital Earth, Chinese Academy of Sciences
No.9 Dengzhuang South Road, Haidian District, Beijing 100094, China – (jiaowl, longtf, yangg, [email protected]) Technical Commission II
KEY WORDS: Image Quality, Information Entropy, Geometric Accuracy, Uncertainty, Image Rectification
ABSTRACT:
Geometric accuracy of the remote sensing rectified image is usually evaluated by the root-mean-square errors (RMSEs) of the ground control points (GCPs) and check points (CPs). These discrete geometric accuracy index data represent only on a local quality of the image with statistical methods. In addition, the traditional methods only evaluate the difference between the rectified image and reference image, ignoring the degree of the original image distortion. A new method of geometric quality evaluation of remote sensing image based on the information entropy is proposed in this paper. The information entropy, the amount of information and the uncertainty interval of the image before and after rectification are deduced according to the information theory. Four kind of rectification model and seven situations of GCP distribution are applied on the remotely sensed imagery in the experiments. The effective factors of the geometrical accuracy are analysed and the geometric qualities of the image are evaluated in various situations. Results show that the proposed method can be used to evaluate the rectification model, the distribution model of GCPs and the uncertainty of the remotely sensed imagery, and is an effective and objective assessment method.
1. INTRODUCTION
Geometric rectification is an important part of remote sensing information processing, directly related to the accuracy and usefulness of the information. It is the basis of remote sensing image processing and applications. A variety of complex factors influence the geometric distortion during the imagery being captured and corrected. The external orientation errors that change for each sensor come from the available ephemeris (usually sensor position, velocity and attitude at fixed intervals) used to generate the approximate parameters of the rigorous sensor model (Okamoto, 1988, Glasbey, et al, 1998, Toutin, 2003, Poli, 2004). The internal orientation errors are due to principal point displacement, focal length variation, radial symmetric and decentering lens distortion, scale variation in CCD line direction and the CCD line rotation in the focal plane (Poli, 2004,Li & Wu, 2013). The other factors could cause more or less effects, such as, the unevenness of atmospheric conditions, the movement of the Earth, the selection of the Earth model, the undulating surface, etc. Most of the capturing distortions are corrected during the system geometric rectification. In addition, the accuracies of the corrected images are different based on different georeferencing control data, specially related to the number, distribution and accuracy of ground control points (GCPs), and DEM in different scale (Cressie, 1991, Jiao et al, 2008, Wang&Ge, 2011). Furthermore, the geometric accuracy is also affected by the method of geometric model optimization and parameter solving (Long, et al, 2014a, Jiao, et al, 2013). Geometric rectification models of remote sensing images, such as the rigorous physical model, rational function model (RFM), polynomial model, etc., normally are very complicated. The factors that affect on the model’s accuracy are not only the selection of mathematical function, but also the optimization of the parameters, which is
related to the accuracies of the observation data and solving method.
Traditional position accuracy assessment is evaluated by the root-mean-square errors (RMSEs) of the ground control points (GCPs) and check points (CPs) (Paul, et al, 1997, Liu et al, 2004). However, these discrete geometric accuracy index data represent only on a local quality of the image with statistical methods. Moreover, the error indicators of the traditional method are related to the confidence level which is selected subjectively, this may result to the different assessment standard. A new method of geometric quality evaluation of remote sensing image based on the information entropy is proposed in this paper. The information entropy, the amount of information and the uncertainty interval of the image before and after rectification are deduced according to the information theory. The method is used for assessment of the rectification model, the distribution model of GCPs, and the uncertainty of the remotely sensed imagery.
2. QUALITY ASSESSMENT OF GEOMETRIC
CORRECTION BASED ON INFORMATION ENTROPY
2.1 Information Entropy and It’s Properties
Thermodynamic entropy is a measure of disorderly, unbalanced, and other disordered state of uncertainty. In information theory, entropy is a measure of the uncertainty in a random variable (Ihara, 1993), and in this context, the term usually refers to the Shannon entropy. The concept of entropy is introduced to describe the spatial data uncertainty recently, particularly in GIS (Fan, et al, 2001, Li, et al, 2002a, Shi, et al, 2005).
According to the Shannon’s theory (Shannon, 1948) for a random variable xi the information entropy, a measure of uncertainty and denoted by H(X), is defined as
1 The corresponding formula for a continuous random variable with probability density function p(x) is defined as
( ) ( )ln ( )dx
with equality if (and only if) x and y are independent. (3)Let p(x) be a one-dimensional distribution whose standard
The maximum entropy is given by ( )ln( 2 )
H X e (4)
Obviously, the entropy for normal distribution is independent of the mathematical expectation, and only related to the standard deviation .
2.2 Measuring Uncertainty with Entropy
Measuring the amount of information
Although there are many uncertainties in measuring the position of a point, one can determine x in a large interval [x1, x2]
Thereby measuring the amount of information is obtained
( ) ( )
n
I H x H x x (5)
where H(x) is the priori entropy of before observation, and
H(x| xn) is the posteriori entropy of after observation.
Before observation x is in the interval [A, B] (A
£
B), then the measurement of n times, the resulting entropy is as following2 2 obtained the smaller the uncertainty radius of the random vector
x is after measurement. Uncertainty Interval
The uncertainty interval can be described as (Sun, 1994)
|
For normal distribution k is calculated from eq. (7) and eq. (9)
1 2 2.066 confidence interval as the measurement of accuracy assessment. 2.3 Quality Assessment of Geometric Correction with Entropy
Remote sensing geometric rectification is to establish the mathematic model between the ground surface and the image, in order to make each pixel in the image correspond to each object in the surface. The rectification model is the most important determinant of the image positional accuracy. It represents the
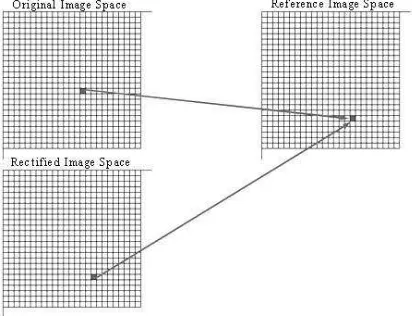
relationship between the three dimensional ground coordinates and the two dimensional image coordinates. Traditional position accuracy assessment is evaluated by the root-mean-square errors (RMSEs) of the ground control points (GCPs) and check points (CPs), which only represents the errors between the rectified image and reference data ignoring the degree of the original image distortion. A method of quality assessment of geometric correction based on the information entropy is proposed in this paper. Figure 1 shows the basic meaning of the quality assessment
Figure 1. Quality assessment of geometric correction The amount of information is described as eq. (13)
( , ) ( , , ) between the rectified image and reference data.
It can be proved that X and Y are independent variables. According to the additive characteristic of entropy, eq. (13) can be rewritten as image and reference data in the same coordinate system. Suppose the difference intervals for x and y coordinates are (A, B) and (C, D) respectively, the priori entropy can be calculated by eq. (15). The probability density of the random error usually are normally distributed, the posteriori entropy can be deduced as eq. (16) from eq. (7) and (8).
The posteriori entropies and uncertainty intervals (eq. (16) and (17)) also can be used in other distribution situations. Since the maximal entropy is obtained in the condition of normal distribution according to the entropy property, the indicators for measuring the uncertainties are conservative but reasonable one (Li, et al, 2002b). Compared to traditional standard deviation elevation range is from 600 m to 4000 m, including some high mountains. Another scene of Landsat-5 TM L4 image (ortho product) in the same place captured in August 2007 was used as the reference image. Total of 393 tie points from the two images were found by the automatic matching module of RSAutoCorrSys software, and 200 well-distributed tie points are selected from the automatically matched tie points.
3.1 Spatial Distribution of GCPs
In order to analyse the effect of spatial distribution of GCPs to the rectification accuracy, seven situations (a-g) of GCP and CP distribution were designed (as shown in Figure 2). For each situation, GCPs and CPs were selected from the 200 tie points according to the rules in Figure 2. Particularly, in situation g, 100 GCPs were selected and the rest 100 tie points were used as CPs. The numbers of the GCP and CP in the seven situations are shown in Table 1.
Figure 2. Seven situations of GCP and CP distribution. For situation a-f, GCPs are in the shadow regions while the CPs are in white regions. For situation g, both GCPs and CPs are in the
shadow region.
Table 1. Numbers of GCP and CP in seven situations
Situations a b c d e f g GCP 104 96 51 149 69 131 100
CP 96 104 149 51 131 69 100
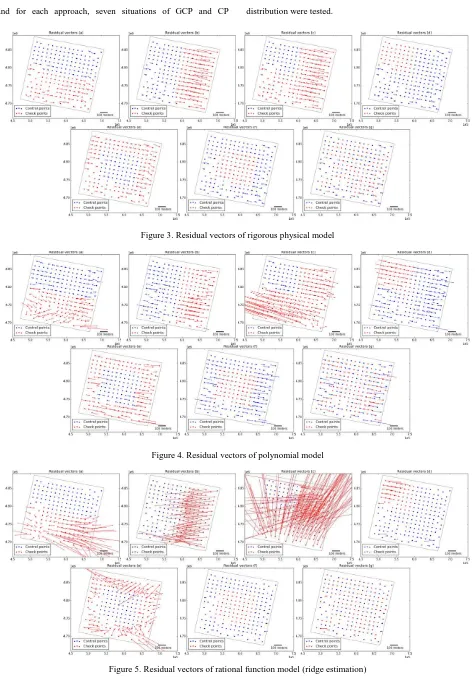
Three different imaging models, including rigorous physical model, polynomial model (degree 2), rational function model (degree 3), are applied to perform the geometric rectification. Additionally, for RFM, two different approaches (ridge estimation and LS1 (Long, et al., 2014b)) are applied to calculate the RPCs. Figure 3~Figure 6 show the residual vectors of GCPs and CPs by using the four approaches, respectively,
and for each approach, seven situations of GCP and CP distribution were tested.
Figure 3. Residual vectors of rigorous physical model
Figure 4. Residual vectors of polynomial model
Figure 5. Residual vectors of rational function model (ridge estimation)
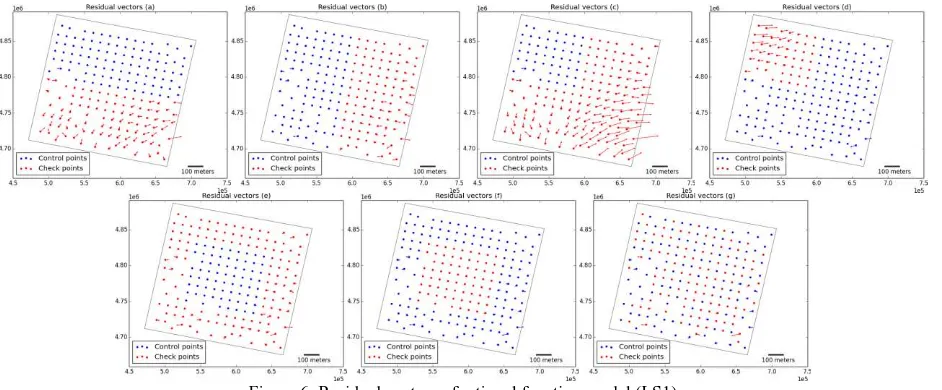
Figure 6. Residual vectors of rational function model (LS1) From Figure 3~6, one can intuitively see that the results are
quite different for different approaches, and the quantitative assessment of the geometric correction will be shown in the large. In contrast, the rational polynomial function model (degree 3) over fits the imaging model when ridge estimation is used to calculate the RPCs, and the residuals of CPs may be extremely great in the situations that GCPs are not well distributed. However, by applying l1-norm regularized least squares, sparse RPCs which are less likely correlated can be obtained, and the residuals of both GCPs and CPs are comparable to those of rigorous sensor model.
Generally, interpolation has better performance than extrapolation. For all of the four approaches, the results in situation f are comparable to those in situation g, thus observation data. When the GCPs are not well distributed,
RFM can fit the GCPs quite well (actually over-fit), but can be oscillatory between exact-fit values (e.g. at CPs). Consequently, only when the GCPs are well distributed, the accuracy of CPs can be guaranteed.
3.2 Quality Assessment of Geometric Correction
Firstly, to evaluate the quality of geometric correction using different approaches in seven situations, the amount of information acquired during the process of geometric correction are calculated according to eq.(14), as shown in Table 2. H(X| Xn) and H(Y| Yn) denote the resulting entropy in X direction and Y direction after geometric correction, and I denotes the total amount of information acquired during the process of geometric correction. Note H(X) and H(Y), the entropies before geometric correction, are calculated by the difference of tie points between the original image and reference data in the same map coordinate system, they are constant for different approaches and situations, and H(X)= 6.62, H(Y)=4.59.
Secondly, to assess the uncertainty of the corrected images using different approaches in different seven situations, the uncertainty intervals are calculated according to eq. (17), as shown in Table 3.
Thirdly, root mean square errors (RMSEs) are also calculated for each case (as shown in Table 4.), and it is a conventional approach to assess the quality of geometric correction.
Table 2. The entropy after geometric correction and the amount of information of four approaches in seven situations (Unit: Hart)
a b c d e f g
I 3.43 4.32 2.34 4 4.42 4.79 4.71
Table 3. The uncertainty intervals before and after geometric correction using four approaches in seven situations (Unit: meter)
a b c d e f g
Table 4. The root mean square errors (RMSE) before and after geometric correction using four approaches in seven situations (Unit: meter)
a b c d e f g
Before rectification X RMSEs 1535.71 1535.71 1535.71 1535.71 1535.71 1535.71 1535.71
Y RMSEs 249.68 249.68 249.68 249.68 249.68 249.68 249.68 and the RMSEs in Table 4 are also consistent with the results in Table 2 and Table 3, but they assess the quality of geometric correction from different aspects:
a) The amount of information shows that how much information is obtained by performing geometric correction, which makes the image less uncertain in geometry;
b) The uncertainty intervals show the geometric uncertainty of the image before and after geometric correction;
c) The RMSEs show the geometric bias of the image before Table 4 also show the coincident results.
For most situations, the acquired amount of information I
should be greater than 0. However, for some situations in polynomial approach and RFM (ridge estimation) approach, the amount of information is negative. This is because the estimated models are instable at CPs when the GCPs are not well distributed, and the geometric information of the image becomes more disordered.
According to Table 3, we can see that the uncertainty intervals of the image in geometry are around 375.42 meters at X and 49.18 meters at Y before geometric correction. Geometric correction generally shrinks the uncertainty intervals except for some situations in polynomial approach and RFM (ridge estimation) approach.
According to Table 4, the geometric bias of the image is around 1535.71 meters at X and 249.68 meters at Y before geometric correction, and the bias can be reduced to less than 10 meters if the geometric correction is well performed.
According to Table 2~4, it can be obviously seen that the geometric quality of the image is better in X direction than that in Y direction.
3.3 Analysis
With the help of the proposed assessment method based on information entropy, it is possible for us to quantitatively evaluate the quality of different approaches of geometric correction as well as different situations of GCP distribution. Quality of different geometric correction models:
By observing the data in Table 2~4 comprehensively, it can be found that RFM (LS1) perform better than the others, following by rigorous sensor model. The polynomial model (degree 2) cannot exactly fit the imaging model but it outperforms RFM (ridge estimation) when the GCPs are poorly distributed.
However, when the GCPs are well distributed, the geometric quality of RFM (ridge estimation) is comparable to that of rigorous sensor model and RFM (LS1). It can be summarized as: RFM (LS1) > rigorous sensor model > polynomial (degree 2) & RFM (ridge estimation).
Quality of different distribution of GCPs:
According to the results of seven situations of GCP distribution in Table 2~4, both situation f and situation g can be considered as well distribution, and their results are comparable, which are better than those of the other situations. Following situation f and g, situation d and situation e yield good and similar results. In situation c, the geometric quality is the worst. It can be during the process of geometric correction, and the uncertainty interval is used to evaluate the geometric uncertainty of the image, and the root mean square error gives discrete and average geometric bias errors. From Table 3~4 we can see that all the methods provide coincident results.
4. CONCLUTIONS
In this paper, a new method for geometric quality evaluation of remote sensing image based on information entropy is proposed. The amount of information is used to evaluate the information obtained during the process of geometric correction, and the uncertainty interval is used to evaluate the geometric uncertainty of the image. Seven different situations of GCPs distribution are designed, and four different approaches of geometric correction, including rigorous sensor model, polynomial model (degree 2), RFM using ridge estimation and RFM using l1-norm regularized least squares, are applied to perform geometric correction. With the help of the proposed method for geometric quality evaluation, it can be seen that the approach of RFM using l1-norm regularized least squares outperforms other approaches, following by rigorous sensor model. The quality of different situations of GCP distribution can also be evaluated by the proposed approach. Moreover, the conventional approach (root mean square errors) also provides coincident results, which verifies the proposed method. However, the RMSEs only show the average geometric errors of the image while the new evaluation method shows the geometric uncertainty, a new aspect of geometric quality of the image.
ACKNOWLEDGEMENTS
The research has been supported by the grants from the National Natural Science Foundation of China (61271013) and 135 Strategy Planning of Institute of Remote Sensing and Digital Earth, Chinese Academy of Sciences.
REFERENCES
Cressie, N. , 1991. Statistics for Spatial Data. John Wiley, New York.
Fan, A., Guo, D., 2001. The uncertainty band model of error entropy. Acta Geodaetica of Cartographica Sinica, 30(1), pp.48-53.
Glasbey, C A, Mardia, K V, 1998. A review of image- warping methods. Journal of Applied Statistics, 25(2), pp. 155-171. Ihara, S., 1993. Information theory for continuous systems. World Scientific. p. 2. ISBN 978-981-02-0985-8.
Jiao, W., Cheng, B., Zhu, W., Liu, W., He, G., Wang, W., Zhang, X., 2008. Accuracy analysis of remote sensing image rectification, In Proceeding of SPIE - Remote Sensing of the
Environment: 16th National Symposium on Remote Sensing of
China, edited by Qingxi Tong, Vol. 7123, 712308.
Jiao, W., Long, T., Chen, L., 2013. Improving the geometric theory in determining indexes of point’s positional uncertainty.
Journal of Institute of Surveying a nd Mapping, 19(4), pp.243-246.
Li, D., Gong J., Zou, S., Du D., 2002b. Entropy uncertainty of unknown distribution error, Surveying and Mapping Bulletin,
vol.12, pp.5-7.
Li, X., Wu Z., 2013. Analysis of linear CCD sensor calibration parameter model. Electronic Design Engineering, 21(20), pp.70-72.
Liu C., Shi W., Zhu S., 2004. Spatial visualization of image rectification accuracy based on spatial interpolation. Journal of Remote Sensing, 8(2), pp.143-149.
Long, T., Jiao, W., He, G., 2014a. Nested regression based optimal selection (NRBOS) of rational polynomial coefficients.
Photogrammetric Engineering & Remote Sensing, Vol. 80, No. 3, March 2014
Long, T., Jiao, W., He, G., 2014b. RPCs Estimation via l1-norm regularized Least Squares (LS1). Manuscript submitted for publication.
Okamoto, A., 1988. Orientation theory of CCD line-scanner images, International Archives of Photogrammetry and Remote Sensing, 27(B3): 609-617.
Paul, W., Ghilani, R., Charles, D., 1997. Adjustment Computations: Statistic and Least Squares in Surveying and GIS. John Wiley & Sons, New York.
Poli, D., 2004. Orientation of satellite and airborne imagery from multi-line pushbroom sensor with a rigorous sensor model. In: International Archives of Photogrammetry and Remote Sensing, 35(B1), pp.130-135.
Shannon, C., 1948. A mathematical theory of communication,
Bell System Technical Journal, Vol. 27, 623–656.
Shi, Y., Shi, W., Jin, F., 2005. Entropy and its state of arts on research of spatial data uncertainty. Computer Engineering,
31(24), pp.36-43.
Sun, H. (1994). Entropy and the uncertainty interval. Jounal of Wuhan Technical University of Surveying and Mapping, 19(1), pp.63-70.
Toutin, T., 2003. Review paper: geometric processing of remote sensing images: models, algorithms and methods. International Journal of Remote Sensing, 25(10), pp.1-20.
Wang, J., Ge, Y., 2011. Simulation analysis of GCP residuals in the remote sensing image registration. Remote Sensing Technology and Application, 26(2), pp.226-232.