SCAN LINE OPTIMIZATION FOR TRI STEREO PLANETARY IMAGES
R.H.Bhalerao∗
, S.S. Gedam and J. Joglekar
Geomatics Lab, Centre of Studies in Resources Engineering, Indian Institute of Technology Bombay Mumbai, India 400076
(raghavendra.bhalerao, jyotij, shirish)@iitb.ac.in
Commission III
KEY WORDS:Tri-stereo, Disparity Space Image,
ABSTRACT:
In this paper, we propose a new scan line optimization method for matching the triplet of images. In the present paper, the triplets are initially matched using an area based local method. The cost is stored in a structure called as the Disparity Space Image (DSI). Using the global minimum of this cost the initial disparity is generated. Next the local minima are considered as potential matches where global minimum gives erroneous results. These local minima are used for optimization of disparity. As the method is a scanned line optimization, it use popularly resampled images. The experiment is performed using Terrain Mapping Camera images from the Chandrayaan-1 mission. In order to validate the result for accuracy, Lunar Orbiter Laser Altimeter dataset from Lunar Reconnaissance Orbiter mission is used. The method is again verified using standard Middlebury stereo dataset with ground truth. From experiments, it has been observed that using optimization technique for triplets, the total number of correct matches has increased by 5-10% in comparison to direct methods. The method particularly gives good results at smooth regions, where dynamic programming and block-matching gives limited accuracy.
1. INTRODUCTION
Stereo image matching is a classical research problem for the computer vision and the phtogrammetry community. These stereo matching methods are broadly classified asspareanddensestereo matching. Sparse matching methods use distinctive features in the image and match them, whereas as in dense matching algo-rithms the disparity is determined at each of the pixel location. Dense matching are again classified asGlobalandLocal meth-ods. Local methods take into consideration of neighboring pixels, and defines a window or pixel based matching approach, whereas global methods minimize a global energy using an initial dispar-ity obtained from Local methods. DEM generation is an impor-tant process from satellite/aerial photogrammetry point of view. To generate DEM one of the steps is stereo matching. Commer-cially available softwares use least square matching. In addition to that, a lot of human effort and RPC parameters are required to correct the generated model. Initially, the software’s were ca-pable to generate DEM from pair of stereo images, but recently some of the software have the capability to handle triplets (SAT-PP, LPS). The exact workflow for DEM generation, which these software uses are are not publicly available for complete under-standing. Neither a brief description is given about removing in-correct matches nor the exact rules to fill the holes is provided. Therefore, at various places, generated DEM from these software requires a lot of human effort for correction and hence these soft-ware are semi automatic. In the case of planetary images, we do not have very good ground control, due to which DEM generation using conventional software is more challenging for planetary im-ages. Therefore in the present work an automatic stereo match-ing approach is used for disparity map generation, usmatch-ing triplets and then automatically reject incorrect matches rigidly and finally mapping it to the ground using control parameters.
∗Corresponding author
2. RELATED WORK
fur-ther use local minima to increase the number of correct disparity points to be used as control points.
3. CONTRIBUTION OF PRESENT WORK The proposed work is inspired by the advantages of scan line stereo matching methods. The basic methods that fall in this category are scan line optimization (SO), dynamic programming (DP) and semi-global-matching (SGM). SO and DP methods are very similar. The basic problem is these methods is that these methods assumes monotonicity or ordering of disparity, based on this, in decision making process there are only three possi-ble moves. If there is a large change in disparity, these methods fails as the best path search chooses an incorrect move. Once an incorrect path is selected it takes several moves to come back to thecorrectpath. And all the disparities generated in between these two moves are incorrect and gives the wrong result. In proposed work based we are also searching for the best path, but this is constrained by some control points. There are hard constraints and soft constraints. The best path has to follow these control points as used in (Torr and Criminisi, 2002) and constraints. But these control points are not corner points. The results are much similar to SGM method but in proposed method the 8 or 16 direc-tion aggregadirec-tion is not required as in SGM. If the slope is varying very rapidly or, there are uniform regions in the image the method gives good results as generally at these locations global minima fails, and we have to consider the local minima.
4. RELATED THEORY 4.1 Cost Function
Cost function is measure of similarity between two images. Here Zero Mean Sum of Squared Difference (ZSSD) is chosen as cost functionC, so as to compensate for changes in illumination (ra-diometric changes). Mathematically the relation is given
as-Clr(x, y) =
As we have triplet of images we have 3 cost functions for three set of images Left-CenterCLC, Center-RightCCRand Left-Right
CLR. In present study we usedCCRandCCL because center
view is common in this case. To consider the third cost function CLR, we need to transform it with respect to central view in order
to compare. This transformation requires accurate estimate of depth (see equation 10), which itself is in error. Therefore this is considered for future work. Now using these cost function DSI is generated.
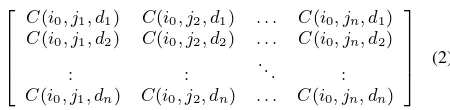
4.2 Disparity Space Image
DSI is a data structure. It is used to store various values of the cost function, for various pixels of a scan line, in a grid format. Figure 2 shows the DSI representation of the cost function the plot is Left scan line Vs right scan line and the disparity in diag-onally. As the disparity is limited to0todmax, not all the pixels
are required to be mapped in this representation. The compressed version of DSI is shown in figure 2, which is plotted as left scan-line Vs disparity. Disparity Space Image (DSI) representation of the cost function is one of the oldest ways to represent the cost function as the data structure. It finds its roots in the work by Marr and Poggio long back in 1976. It is used to store various val-ues of the cost function for a particular scan-line in a grid format and used to determine the disparity, using different approaches.
Figure 1: (A) Cost Function, (B) Color coded cost funciton rep-resentation of (A), (C) Disparity Space Image , (D) Compresed Disparity Space Image (arrow shows location of cost function represented by (B))
(b) Disparity Space Image for matching (a) Scan line disparity
representation
(Heinrichs et al., 2007) used similar representation and solved the stereo matching using theCooperative Algorithmfor random dot stereogram. The same structure has been termed as the Un-compressed Correlation Arrayin approach as in by (Cochran and Medioni, 1992). They used a composite approach of the feature and area based matching using DSI. (Intille and Bobick, 1994a, Intille and Bobick, 1994b) used theDynamic Programming(DP) to determine disparity using DSI. They also explained the forma-tion and mathematical representaforma-tion of DSI in a very lucid man-ner. Later on DSI has been extensively used involving Dynamic Programming approach for the stereo matching. For a stereo pair (Il−Ir) images ; in ideal case the size ofDSIis(n×n), where
In case of DSI the search range is for entire scan line, henced ranges from 1 todn, but not all the values inDSIare used to
de-termine the depth, as the search is limited by maximum disparity dm. Therefore it is expensive to store all of the cost values, from
Figure 2 shows formation ofDSI andcDSI from a scan lines of the stereo image pair (Il−Ir).
5. CONSTRAINTS 5.1 Control Points
In proposed method the best path is constrained by control points, these are global minimum and local minima.
5.1.1 Global minimum Let’s consider cost functionC. As in WTA strategy the global argument of minima of the cost function is defined as the disparity, mathematically which is given as
-D(x, y) = argmin
d
C(x, y, d) (4)
5.1.2 Local Minima It has been observed that due to large variation in disparity and noise, many a time global minimum end with erronous match but local minima gives correct match, hence apart from global minimum local minimum are used as control points.
All the control points are first filterd for consistency check. IF they are consistence in forward and reverse matching and left-centre-right view then only considered further else rejected. These coinsistency check is given as
-5.2 L R consistency in DSI
The argument of the global minima of columns in DSI is consid-ered as disparity. From above relation in terms of DSI it can be expressed as
-Dv(x, y) = argmin
d
DSI(x, y, d) (5)
Due to this representation of the cost function in DSI, we have argument of the global minima of rows also as the disparity, (fig-ure 2). So the next relation for disparity is give
as-Dh(x, y) = argmin
y
DSI(x, y, d) (6)
Physically the minima in vertical direction can be understood as searching LR matching and in horizontal direction its RL match-ing. Hence from above equations the LRC consistency chek gives for the disparity to be accepted.
Dv(x, y) =Dv(x, y) (7)
5.3 CL CR consistency in DSI
Now as we have three views so the equation 7 can be expressed in terms of left-centre and centre-right
as-Dcl(x, y) = argmin
d
DSIcl(x, y, d) (8)
Dcr(x, y) = argmin
d
DSIcr(x, y, d) (9)
Equation 8 and 9 gives two disparity map from two different views. Therefore from two oservation we have two disparity map, the erreo between these two is fiven as−
Dcl(x, y) =Dcr(x, y) (10)
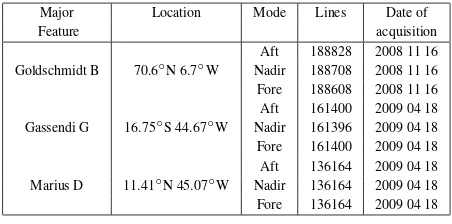
Table 1: TMC Data-set details
Major Location Mode Lines Date of
Feature acquisition
Aft 188828 2008 11 16 Goldschmidt B 70.6◦N 6.7◦W Nadir 188708 2008 11 16 Fore 188608 2008 11 16 Aft 161400 2009 04 18 Gassendi G 16.75◦S 44.67◦W Nadir 161396 2009 04 18 Fore 161400 2009 04 18 Aft 136164 2009 04 18 Marius D 11.41◦N 45.07◦W Nadir 136164 2009 04 18 Fore 136164 2009 04 18
Table 2: LOLA Data set details
Crater Name of file resolution
Marius DLDEM 1024 00N 15N 300 330 (1/1024)◦/pixel Gassendi G LDEM 1024 30S 15S 300 330 (1/1024)◦/pixel Goldschmidt LDEM 1024 60N 75N 330 360 B (1/1024)◦/pixel
6. DATA-SET
To generate 3D model the triplet stereo pairs are used and to ver-ify the results lidar data is used. Tri-stereo data used is from CH-1 missions Terrain Mapping Camera (TMC), which is acquired from ISSDC (http://www.issdc. gov.in/CHBrowse/index.jsp). The details of data acquired are detailed in table 1. The lidar data is acquired from Lunar Orbiter Laser Altimeter (LOLA) sensor of LRO mission (http://ode.rsl.wustl.edu/moon/). The details of LOLA dataset is given in table 3. To verify the results on planer-ary images some more experiments are carried out on Middlebury stereo dataset. te details are given in table 3. The dataset used is shown in figure 3.
7. PROPOSED WORK-FLOW
The images from CH1 TMC data set are used for experimenta-tion, the actual size is very large (1,00,000×4000pixels) there-fore a small portion (2000×2000pixels) near known feature is selected. Taking Nadir as reference view, corresponding images from Fore and Aft are obtained. Fore and Aft are, then resam-pled for quasi-epipolarity. Next, based on the outline of stereo matching (Scharstein and Szeliski, 2002) a cost function is de-fined. Using this cost function for a scan line, two DSI are gener-ated, one for Aft-Nadir view and other for Nadir-Fore view. Sub-sequently using proposed confidence measure incorrect matches are rejected. Finally the LOLA dataset of LOC missoin is used validation of the results thus obtained.
7.1 Quasi-Epipolar Resampling
Table 3: Middleburry Stereo Dataset
Feature Name of file Size Indoor lampshade1 1300×1110
Figure 3: Input A-N-F view triplet images for Marius D crater and DEM, yellow line shows the scan line for which experiment is performed whose results are shown in figure 4
are obtained for epipolar resampling. Using these parameters Aft (and Fore) to are resampled to follow epiploar geometry w.r.t. Nadir.
7.2 DSI Generation
Using the above cost function as in equation DSI is generated.
7.3 Best Path Search
The proposed method is a global matching method that defines an energy function and a penalty term. The initial conditions used are
1. only a single local minima can be the correct disparity for a column or row. (This condition satisfies the unique match property of stereo matching).
2. The translation between two disparities should be less than a threshold. (This condition satisfies the smoothness criterion of stereo matching).
The initial traversing direction of the best path can be any either a row, or a column of the DSI, here path traversed is from the column to column. This optimized path at a column first look for global minima if there is a global minima present at the location; this is the solution. If global minima is absent, it looks for global minima of adjacent columns, one to left and one to rightCmland
Cmror moves several columns if could not find it in immediate
adjacent column. Using all local minima of the current column
(Pm0), and neighbouring global minimaCml,Cmr; an
optimiza-tion rule for considering a local minimum as desired soluoptimiza-tion is formulated. Weightages are given to all local minima inversely proportional to their location from the selected global minimum. The best path is then selected based on highest weight fromCml,
Cmr. The path is then traversed for the next column. The
addi-tional rule for the path is to honour all the(Cm)but may omit a
local minimum from the set(Pm0)of a particular column. The
result is thus a smooth profile.
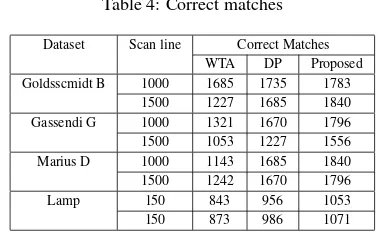
Table 4: Correct matches
Dataset Scan line Correct Matches WTA DP Proposed Goldsscmidt B 1000 1685 1735 1783
1500 1227 1685 1840
Gassendi G 1000 1321 1670 1796
1500 1053 1227 1556
Marius D 1000 1143 1685 1840
1500 1242 1670 1796
Lamp 150 843 956 1053
150 873 986 1071
Total pixels in scan line = 2150 pixels, for CH1 dataset Total pixels in scan line = 1110 pixels, for Middleburry dataset
8. EXPERIMENTAL RESULTS
Using data from CH-1 mission TMC data-set the experiment is performed for three known features as indicated in table 1. Ta-ble 4 gives the result obtained for one of the craters. For accuracy assessment obtained results are compared with the LOLA data set. LOLA is laser altimetry dataset. It provides the location and elevation. The data from CH1 triplets only provides location and disparity which can not be directly compared unless precisely lo-cated for location accuracy. Therefore, first the TMC data is cor-rected with Clementine data for planimetric error. Later based on Clementine data the LOLA data is obtained for the same lo-cation. The resolution of LOLA is 29 meters and resolution of TMC is 5 meters. Therefore, different profiles are compared for accuracy assessment. It has been observed that a large number of incorrect matches are removed using the defined criteria. Figure 4 shows one of the results of the experimentation for Marius D crater and Middlebury image . The obtained result is compared with LOLA after transforming it by scaling and offsetting, it has been observed more that 90% of points obtained are matched cor-rectly. The experiment is also performed on Middlebury dataset. As the proposed method, is based on scan-line hence to com-pare the results from proposed methodology has been comcom-pared with dynamic programming algorithm, along with the basic block matching. It has been observed; dynamic programming fails if the disparity is very large as once it choose an incorrect disparity it’s not easy for the algorithm to come hence to correct the path. The method gives the smoother result as compared to both the basic block matching and dynamic programming. In the case of crater, theDPdoesn’t gives good result at all.
9. CONCLUSION AND FUTURE WORK In this paper we used a method for triplet matching, which is based on standard stereo matching techniques. We proposed a method which uses information from triplet of images using a DSI to define rules to find out incorrect matches. In future work the distribution of the matches will be considered and qualitative analysis will be done using ground truth from other sensor. In present work the complete set DEM for a region is not investi-gated properly, instead profile is only investiinvesti-gated which will be carried in future work.
REFERENCES
Bhalerao, R., Gedam, S. and Almansa, A., 2013. Fast epipolar re-sampling of trinocular linear scanners images using chandrayaan-1 tmc dataset. In: 2nd IEEE International Conference on Image Information Processing, Shimla, India, pp. 56–60.
Cochran, S. and Medioni, G., 1992. 3-d surface description from binocular stereo. IEEE Trans. PAMI 14(10), pp. 981–994.
Dima, C. and Lacroix, S., May 2002. Using multiple disparity hypotheses for improved indoor stereo. In: IEEE International Conference on Robotics and Automation), Vol. 4, IEEE, Wash-ington, DC, USA, pp. 3347–3353.
Fischler, M. A. and Bolles, R. C., 1981. Random sample consen-sus: a paradigm for model fitting with applications to image anal-ysis and automated cartography. Commun. ACM 24(6), pp. 381– 395.
Heinrichs, M., Rodehorst, V. and Hellwich, O., 2007. Efficient Semi-Global Matching for Trinocular Stereo. In: Photogrammet-ric Image Anlysis, Vol. 36, Munich, Germany.
Hirschm¨uller, H., 2005. Accurate and Efficient Stereo Processing by Semi-Global Matching and Mutual Information. In: CVPR, Vol. 2, San Diego,USA, pp. 807–814.
Hirschm¨uller, H., 2008. Stereo processing by semiglobal match-ing and mutual information. PAMI 30(2), pp. 328–41.
Intille, S. and Bobick, A., 1994a. Incorporating intensity edges in the recovery of occlusion regions. In: ICPR, Vol. 1, Jerusalem, Israel, pp. 674–677.
Intille, S. S. and Bobick, A. F., 1994b. Disparity-space images and large occlusion stereo. In: ECCV, LNCS, Vol. 801, Springer Berlin Heidelberg, pp. 179–186.
Kim, J. C., Lee, K. M., Choi, B. T. and Lee, S. U., 2005. A Dense Stereo Matching Using Two-Pass Dynamic Programming with Generalized Ground Control Points. In: CVPR 05, Vol. 2, Ieee, pp. 1075–1082.
Lowe, D. G., 2004. Distinctive image features from scale-invariant keypoints. Int. J. Comput. Vision 60(2), pp. 91–110.
Marr, D. and Poggio, T., 1976. Cooperative computation of stereo disparity. Science 194(4262), pp. 283–287.
Mozerov, M., Gonzlez, J., Roca, F. X. and Villanueva, J. J., 2009. Trinocular stereo matching with copmposite disparity space im-age. In: ICIP, Cairo, Egypt, pp. 2089–2092.
Scharstein, D. and Szeliski, R., 2002. A taxonomy and evalua-tion of dense two-frame stereo correspondence algorithms. Int. J. Comput. Vision 47(1-3), pp. 7–42.