IMAGE TO POINT CLOUD METHOD OF 3D-MODELING
A.G. Chibunichev, V.P. Galakhov.
Moscow State University of Geodesy and Cartography, #4, Gorokhovsky pereulok, 105064,
Moscow, Russia.
[email protected]
,
[email protected]
KEY WORDS: Photogrammetry, Laser scanning, Photography, Three-dimensional, Fusion, Modeling.
ABSTRACT:
This article describes the method of constructing 3D models of objects (buildings, monuments) based on digital images and a point cloud obtained by terrestrial laser scanner. The first step is the automated determination of exterior orientation parameters of digital image. We have to find the corresponding points of the image and point cloud to provide this operation. Before the corresponding points searching quasi image of point cloud is generated. After that SIFT algorithm is applied to quasi image and real image. SIFT algorithm allows to find corresponding points. Exterior orientation parameters of image are calculated from corresponding points. The second step is construction of the vector object model. Vectorization is performed by operator of PC in an interactive mode using single image. Spatial coordinates of the model are calculated automatically by cloud points. In addition, there is automatic edge detection with interactive editing available. Edge detection is performed on point cloud and on image with subsequent identification of correct edges. Experimental studies of the method have demonstrated its efficiency in case of building facade modeling.
1. INTRODUCTION
One of the most frequent tasks for land survey is high detailed survey of building facades, monuments and objects of cultural heritage. The purpose of this survey is to obtain detailed model of object’s interior and exterior. Several different kinds of survey can be used to obtain model satisfying these demands. In this paper we’ll discuss two methods: photogrammetric processing of digital images and terrestrial laser scanning with further modeling. These methods could be compared in application to façade modeling.
The process of image capturing is simple and fast, though needs planning of total image captures and their relative positions. Absolute and relative tie points are needed to create photogrammetric model, therefore additional method of survey is used to achieve coordinates of absolute tie points. Quality and precision of modeling based on photogrammetric processing of photographic images in high degree depends on experience and qualification of PC operator and furthermore on his physiological abilities.
Terrestrial laser scanning needs much more time for capturing spatial data, because a laser scanner needs to be placed on a tripod, prepared for scanning and only after that scanning could be started, which is not as fast as simple image capturing. Absolute tie points are needed for increasing of total model precision or for referencing to external coordinate system, but total quantity of tie points is less then for photogrammetric model. Precision and quality of modeling by the point cloud much less depends on qualification and experience of PC operator. But operator should perform several different kinds of manipulations with parameters of point cloud projection onto 2D surface of screen (rotation, translation, scaling) before operator get concept of object in his imagination.
Practical experience shows advantages and disadvantages of these methods (Fabris, Achilli, Artese 2009).
Cost of good enough digital camera is low comparing to terrestrial laser scanning system and obviously camera can be added into kit. Using combination of these two methods complementing each other allows resulting model quality increasing and reducing time efforts (Jansa J., Studnicka N., Forkert G., Haring A., Kager H., 2004).
These two methods could be combined on several different levels.
The first, easiest, level of combination is coloring of cloud points according to digital image colors. Naturally laser scanner is capturing point coordinates and intensity of returned laser beam (Chunmei Hu, Yanmin Wang, Wentao Yu, 2008). Coloring of cloud points makes easier process of data perception by PC operator.
The next level is creation of the digital surface model from cloud points, orthophototransformation of digital images and surface texturing. Efficiency of this level is higher. Furthermore, operator can vectorize orthophoto in 2D and then project vectors onto 3D, because the surface model can be used as DTM for orthophoto (Ayman Zureiki, Michel Roux, 2009). Lines, extracted automatically from orthophoto, could also be projected onto DTM surface. But the quality of projecting depends on quality of created surface model. In case of terrestrial laser scanning captured point clouds contain many “noise” points due to great number of obstructions in natural environments. Point clouds needed to be filtered and cleaned from “noise” points before surface modeling. Every “noise” point leads to incorrect surface modeling and thus to incorrect orthophototransformation of digital images. But filtering is not enough. Breaklines should be created for accurate surface modeling. All these operations need labor input from operator. New methods of modeling developed to solve these problems. Nex and Rinaudo (2009) proposed new approach of automatic modeling using digital images and point cloud processing. On the first step bundle block adjustment and edge extraction performed for digital images. After that edge extraction performed for point cloud using extracted image edges. New method of vectorization proposed in this article. The method is based on vectorization by single untransformed images. Automatic image and point cloud segmentation is performed. Segments are used for edge extraction. Extracted edges are transposed onto images and onto quasi images generated from point cloud. SIFT operator used for tie point extraction. Tie points are used for calculation of exterior orientation parameters of images. After image referencing edges could be projected onto image plane. Matching edges are left as vectors. Operator of PC manually creates new vectors by single
International Archives of the Photogrammetry, Remote Sensing and Spatial Information Sciences, Volume XXXIX-B3, 2012 XXII ISPRS Congress, 25 August – 01 September 2012, Melbourne, Australia
untransformed image. Created vectors are projected onto point cloud using interpolation.
2. DESCRIPTION OF METHOD
2.1 Digital image
The camera used for capturing of photographic images should be calibrated, i.e. internal orientation parameters and distortion should be known with high enough precision. Only under this condition good result could be achieved.
Transformation of images performed after loading for image distortion correction. Collinearity equations are used for image transformation:
x, - coordinates of the image point;
j
X , , - spatial coordinates of focal center point; Z
p - tangential distortion;
2 2 y
x
r= + - distance to the main point of image;
0
r - distance to the zero distortion point.
After transformation image segmentation is performed. Segmentation is performed using region growing algorithm. Process of segmentation starts from initial pixel searching. A criterion of choosing initial pixel is homogenous radiometric intensity of neighboring pixels. Next all the neighboring pixels are checked for homogenous intensity. If pixel is not homogenous, then it is bounding pixel. Growing of the segment continues until bound is locked.
Bounds of segments are extracted as radiometric edges.
2.2 Point cloud
Point cloud segmentation is performed after point cloud loading. It is also region growing procedure. Segmentation starts from grouping of cloud points. Curvature is calculated for each group. For curvature calculation covariance matrix С is calculated from point coordinatesp and centroidp (3).
( )
3After that considering eigenvalue problem (4) eigenvector v and eigenvalues λ of matrix С are calculated. Curvature σ is
If curvature is below preset threshold (0.01), approximation plane is calculated using least squares method. If deviation of distances from points to approximating plane is lower then
threshold (0.01m), group of points becomes “center of crystallization”. All neighboring groups of points are iteratively checked for planarity.
Point cloud segments are used for geometric edge extraction.
2.3 Image to point cloud referencing
Corresponding part of point cloud should be selected before referencing. Approximating plane is calculated for selected part. This plane is used for quasi image creation. The plane of quasi image is coplanar to approximating plane; its center of projection is far enough from the plane to fit all selected points into one single image; size of image is calculated according to scanning resolution.
Quasi image is similar to photographic, but could not be successfully compared in automatic mode by any existing algorithm. But edge extraction performed on point cloud and photographic image makes possible comparing of these images. Process of geometric and radiometric edge extraction described above, besides of that Canny edge detection could be used for radiometric edge extraction.
SIFT algorithm (Lowe 2004) is used for comparing of images and tie point extraction.
Operator of PC controls mismatches, because most of facades contain a lot of duplicated elements. Duplication of geometric elements leads to point mismatching. Operator also able to create matching points manually if automatic matching fails. After tie points extraction external orientation parameters of digital image are calculated using least squares method.
2.4 Vectorizing
After referencing digital images against point cloud geometric edges could be projected onto plane of digital image. Geometric edges are matched with radiometric edges. Matched edges are saved as vectors. Operator can delete false matched vectors or add new ones.
In practice total number of corrections could be very considerable. It is almost impossible to achieve complete vector model automatically regardless of used method. That is why operator should have possibility to perform manual vectorization and correction.
Operator creates vectors manually by photographic image. For each node point spatial coordinates are calculated. After calculation of two vector nodes, middle point is calculated. If point to line distance is higher then threshold, middle point becomes additional node point. New check of the same kind is performed for two neighboring line segments. Check continues until all nodes are fixed.
Spatial coordinates are calculated using interpolation of point cloud points. Point cloud is projected onto plane of photographic image. Distances from center of projection to point cloud points are also calculated and stored for each point. Two types of interpolation are available.
Dynamic interpolation is performed when operator moves cursor: interpolation starts from searching of the nearest point in the plane of image, then distance from the nearest point to the center of projection is loaded, after that approximate point coordinates are calculated according to loaded distance and cursor 2D plane coordinates.
Another type of interpolation performed only after node point creation, because this process needs much more time for calculation. As the point cloud and the image are segmented, corresponding segments could be identified. Depending on position of the cursor and direction of move before point fixation cursor could be identified as belonging to one or another segment. After segment identification the group of nearest points from segment selected. Selected group approximated by plane. Spatial coordinates of the node point are
International Archives of the Photogrammetry, Remote Sensing and Spatial Information Sciences, Volume XXXIX-B3, 2012 XXII ISPRS Congress, 25 August – 01 September 2012, Melbourne, Australia
calculated as the point of intersection between the plane and the ray running from the center of projection through the image plane.
3. EXPERIMENTAL RESULTS
3.1 Realisation of method
For experimental testing of the proposed method software package was created. This package consists of two parts implemented in C++ and in MATLAB.
Compiled C++ application allows loading of raster images saved in device independent bitmap. If distortion parameters are set, image transformation is performed. Transformed image visualized on the screen for referencing and vectorization. Point cloud loaded from PTS and PTX files – formatted text files. After loading points are saved into special file format and indexed. This operation is made for increasing of total productivity of calculation and visualization. And furthermore maximum number of loaded points in point cloud is limited only by free hard disk space, because only needed part of data is loaded in operative memory.
The point cloud could be visualized in 3D window. User initiates segmentation of the point cloud and photographic image. After that quasi image is created and passed to MATLAB, where SIFT algorithm is implemented. SIFT gives tie points. Tie points are returned back to application where external orientation parameters of the photography image are calculated using Least Squares Method. After calculating of the orientation parameters operator is able to initiate automatic edge extraction. Besides of that operator is able to create vectors manually, edit vectors or delete them. Created data could be visualized in 2D window with photography image and in 3D window with point cloud. The result is saved in vector format.
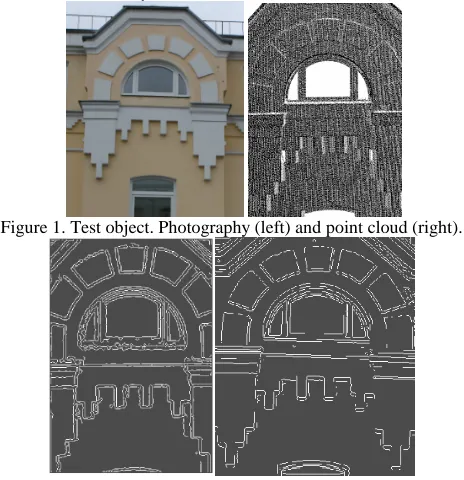
3.2 Test site
Test object is the façade of building with regular and irregular elements. Point cloud captured by the terrestrial laser scanner Topcon GLS–1000. Photographic images are captured by the digital camera CANON EOS. The camera is calibrated in MIIGAiK laboratory.
Figure 1. Test object. Photography (left) and point cloud (right).
Figure 2. Extracted edges. Quasi image (left) and photography (right).
Figure 3. Corresponding points.
9 points out of 18 are matched, 7 of them were automatically excluded after superposition analyses and two of them were excluded during adjustment.
RMS of the tie points is 0.9 pixel (1 pixel is 0.0055mm). Total number of automatically extracted edges is 800, approved is 490. Most of them needed to be corrected.
Control measurements performed by the measuring type had shown mean error of the created vectors below 0.016m.
4. CONCLUSIONS AND FUTURE DEVELOPMENTS
The first experimental result shown advantages and disadvantages of the proposed method. Automatically extracted corresponding points should be corrected manually by operator in case of facades with mostly regular image elements. Process of automatic tie point extraction should be improved. The process of geometric edge extraction should also be improved for increasing of total accuracy.
Three more test objects are prepared for future tests. It is three different facades: simple façade with regular elements (12 images, 2.4 million points); simple with irregular elements (8 images, 1 million points) and complex façade of church (12 images, 10 million points).
REFERENCES
Fabris M., Achilli V., Artese G., Boatto G., Bragagnolo D., Concheri G., Menghello R., Menin A., Trecroci A., 2009. High resolution data from laser scanning and digital photogrammetry terrestrial methodologies. Test site: an architectural surface. Proceedings of IAPRS, Vol. XXXVIII, part 3/W8, September 2009, pp.43-48
Jansa J., Studnicka N., Forkert G., Haring A., Kager H., 2004. Terrestrial laserscanning and photogrammetry – acquisition techniques complementing one another. The International Archives of the Photogrammetry, Remote Sensing and Spatial Information Sciences, Vol. 34, Part XXX
Chunmei Hu, Yanmin Wang, Wentao Yu, 2008. Mapping digital image texture onto 3D model from LIDAR data. The International Archives of the Photogrammetry, Remote Sensing and Spatial Information Sciences. Vol. XXXVII. Part B5. Beijing 2008
Ayman Zureiki, Michel Roux, 2009. Ortho-rectified façade image by fusion of 3D laser data and optical images. Proceedings of IAPRS, Vol. XXXVIII, part 3/W8, September 2009, pp.305-310
Nex, F., Rinaudo, F., 2009. New integration approach of photogrammetric and LIDAR techniques for architectural
International Archives of the Photogrammetry, Remote Sensing and Spatial Information Sciences, Volume XXXIX-B3, 2012 XXII ISPRS Congress, 25 August – 01 September 2012, Melbourne, Australia
surveys. Proceedings of IAPRS, Vol. XXXVIII, part 3/W8, September 2009, pp.12-17
Canny J.F., 1986. A computational approach to Edge Detection. PAMI , vol. 8, No. 6, pp. 679-698
Lowe, David G., 2004. Distinctive Image Features from Scale-Invariant Keypoints. In: International Journal of Computer Vision, 60(2), pp. 91-110.
International Archives of the Photogrammetry, Remote Sensing and Spatial Information Sciences, Volume XXXIX-B3, 2012 XXII ISPRS Congress, 25 August – 01 September 2012, Melbourne, Australia