HAITI EARTHQUAKE DAMAGE ASSESSMENT:
REVIEW OF THE REMOTE SENSING ROLE
P. Boccardob, F. Giulio Tonolo a, *
a ITHACA, 10138 Torino, Italy - fabio.giuliotonolo@ithaca.polito.it
b DIST, Politecnico di Torino, C.so Duca degli Abruzzi 24, 10129 Torino, Italy – piero.boccardo@polito.it
URSI and ISPRS: Disaster Management
KEY WORDS: Earthquake, Damage Assessment, Remote Sensing, Haiti
ABSTRACT:
Haiti was hit by a devastating earthquake on 12 January 2010. The immediate response to the disaster was a real turning point concerning the availability, dissemination and licensing of a huge quantity of geospatial data. Timely triggering of the Earth Observation satellites, and absence of cloud cover, allowed to acquire very high-resolution optical satellite imagery (spatial resolution up to 0.5m) over the main affected areas within a few hours of the disaster, while the whole country coverage was completed in a very short time span. Furthermore in the following days aerial imagery, high resolution SAR radar imagery as well as thermal and LiDAR data were widely acquired.
The paper will show how well established remote sensing techniques allowed to carry out earthquake damage assessment in a very short time, exploiting the synergic capabilities of geospatial tools and instruments such as EO satellites, Web mapping, GIS software and volunteer mapping.
In a few days several map products based on the aforementioned analysis were delivered to end users: a review of the different types and purposes of this products will be provided and discussed. An assessment of the thematic accuracy of remotely sensed based products will be carried out on the basis of a review of the several available studies focused on this issue, including the main outcomes of a validation based on a comparison with in-situ data performed by the authors.
* Corresponding author.
1. 2010 HAITI EARTHQUAKE AND DISASTER RESPONSE
On the 12th of January, 2010, Haiti was hit by a catastrophic earthquake of magnitude 7.0 Mw, with an epicentre near the town of Léogâne, approximately 25 km west of Port-au-Prince, Haiti's capital. The earthquake caused major damage in Port-au-Prince, Jacmel, Léogâne and other settlements in the region. Amongst the widespread devastation and damage throughout Port-au-Prince and elsewhere, vital infrastructures necessary to respond to the disaster were destroyed or severely damaged. Due to the enormous humanitarian impact, the Haiti earthquake represented an exceptional case concerning the availability, dissemination and licensing of a huge quantity of geospatial data and it “will be viewed as one of the most widely recorded events from the perspective of high resolution imagery” (Shan et al, 2011)
International emergency mapping mechanisms such as the International Charter for Space and Major Disasters and the GMES related initiatives have been activated by authorized users immediately after the event. At the same time a large number of international organizations started mapping the impact of the earthquake.
In a few days several impact and damage assessment map products based on the analysis of remotely sensed datasets were delivered to the users, and more generally to the humanitarian community, confirming that rapid impact assessment after a catastrophic event is crucial for initiating effective emergency response actions.
2. EMERGENCY MAPPING ACTIVITIES
As clearly highlighted in the Disaster Risk Management Cycle the Emergency Response stage is generally composed by different initiatives, such as the Search and Rescue (SAR) operations, the re-establishment of main logistic routes, the management, coordination and sharing of information, the provision of humanitarian assistance and the initial damage and need assessment.
The main goal of the map products delivered in the first days after the event and based on satellite/aerial data was to provide initial impact delineation and damage assessment information such as: the location of the main affected areas, the magnitude of the impact, estimated figures on the affected population and accessibility information to support the logistics planning. It has to be highlighted that the typical time constrains of the response stage does not allow to produce a Detailed Damage Assessment, that is generally carried out during the Recovery activities in the framework of the Post Disaster Needs Assessment (PDNA) related tasks.
2.1 Remote sensing data
The acquisition of field data supporting the immediate impact assessment in areas hit by severe earthquakes is indeed a hard task, mainly due to the restricted physical accessibility of the affected areas (i.e. unpredictable road conditions, landslides and soil fractures, lack of means of communications with the affected population, panic, growing of diseases, lack of food and water, hazards due to instable buildings). To cope with the accessibility and time constraints issues, “the use of EO (Earth Observation) data in earthquake contexts, especially for damage International Archives of the Photogrammetry, Remote Sensing and Spatial Information Sciences, Volume XXXIX-B4, 2012
XXII ISPRS Congress, 25 August – 01 September 2012, Melbourne, Australia
assessment purposes, has been widely proposed and a number of results have been presented after every event, mostly based on optical data and manual interpretation” (Polli et al. 2010). As far as the Haiti event is concerned, the first optical high-resolution (0.5 m) imagery over Port-au-Prince was acquired by the GeoEye satellite within a few hours, thanks to both a timely triggering and absence of cloud cover. Specifically on January 13 at 10:27 a.m. EST GeoEye-1 collected almost 3,000 square kilometers of imagery, while few days later collected stereo imagery over Port-au-Prince. Google made the imagery immediately accessible to everyone, allowing an open access to the satellite data, overcoming the usual licensing policies restrictions that may interfere with the needs of rapid disaster response.
On 17 january, 2010 Google has arranged for a collection of aerial imagery over the Port-au-Prince area at approximately 15 cm resolution, making it again available for download to everyone by means of direct download or by making them available as base layers in Google Earth/Map. Furthermore, to avoid time consuming download procedures, several OGC compliant Web Services were later arranged to allow GIS specialists to work in their preferred GIS environment.
The efforts of the satellite/aerial data providers, space agencies and funding agencies enabled rapid coverage of the whole country with both optical and radar data in a few days. Among others, the main data acquisition inititiatives were performed by DigitalGlobe (optical satellite data covering the most affected areas on Jan,14th and the whole country on Jan, 17th) and WorldBank-ImageCat-RIT (aerial imagery, including thermal and lidar acquisitions).
To sum up, more than 2.5 TB of EO data were made available to the mapping community (Voigt, 2011), while USGS provided through the Hazards Data Distribution System (HDDS) about 54 TB of data (public and restricted), including aerial imagery and reference datasets (Duda, 2011).
2.2 Map products and analysis methodologies
Map products derived by means of satellite based emergency mapping can be categorized according to three main products type (the terminology used in the framework of the European GMES Initial Operation Mapping in Rush Mode Service is adopted in this paper, EC-JRC, 2011):
- Reference Maps: the aim is to quickly provide knowledge on the territory and assets prior to the emergency. The content consists in selected topographic features on the area affected by the disaster, in particular exposed assets and other available information that can assist the user in their specific crisis management tasks. The reference map is based on the pre-event image, when available. If a pre-event image is not available, the reference map will be based on the post-event image and ancillary information from other resources.
- Delineation Maps: provide an assessment of the event impact and extent (and eventually of its evolution). Delineation maps are directly derived from satellite images acquired immediately after the emergency event. When relevant, they may be combined with digital modelling and compared with archive information of similar event occurrence.
- Grading maps provide an assessment of the damage grade (and eventually of its evolution). Grading maps are directly derived from satellite images acquired immediately after the emergency event. When relevant, they may be combined with digital modelling and compared with archive information of similar event occurrence. Grading maps
include the extent, type and damage grades specific to the event. They may also provide relevant and up-to-date information that is specific to critical infrastructures, transport systems, aid and reconstruction logistics, government and community buildings, hazard exposure, displaced population, etc.
Most of the products delivered in the first hours after the event were reference maps centered on Haiti (Figure 1) and impact maps showing the location of epicenters (main shock and after shocks, Figure 2) as well as magnitude information such as the shake maps provided by USGS.
Figure 1. Haiti: 1:1.000.000 reference map
Figure 2. Haiti: Potentially-Affected areas outside Port-au-Prince (Source: UN WFP)
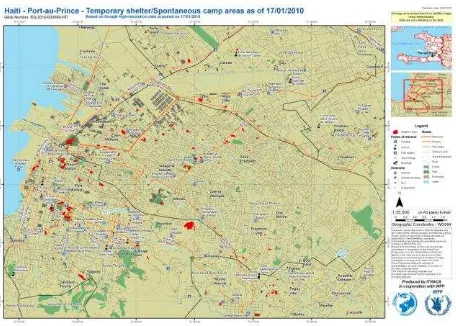
Immediately after the first high resolution optical data were available, the mapping community started focusing on the grading maps. Generally the focus was on the following features of interest: collapsed or damaged buildings (Figure 3), road network accessibility (Figure 4) and spontaneous camps (Figure 5).
Concerning the adopted methodologies, both active and passive sensors can be considered for damage identification purposes. Generally, SAR phase imagery is processed to map the surface displacements and precisely identify the location and direction of fault lines as well as vertical displacements. On the other hand, SAR intensity images may be used to capture damaged areas by means of multi temporal SAR data processing: specifically, amplitude coherence analysis can be carried out in order to detect low coherence areas related to high damages on the ground (Matsuoka et al. 2004).
International Archives of the Photogrammetry, Remote Sensing and Spatial Information Sciences, Volume XXXIX-B4, 2012 XXII ISPRS Congress, 25 August – 01 September 2012, Melbourne, Australia
Figure 3. Haiti – Port-au-Prince: damage assessment map as of 13 Jan 2010 (based on GeoEye satellite image)
Figure 4. Haiti – Port-au-Prince: road damage assessment map as of 17 Jan 2010 (based on 0.15 m imagery)
Figure 5. Haiti – Port-au-Prince: temporary shelter/spontaneous camp as of 17 Jan 2010 (based on 0.15 m imagery)
During the Haiti earthquake response phase, just few products were based on SAR data, e.g. a 2D Ground Motion based on TerraSAR-X data produced by DLR/ZKI and a multi-temporal coherence analysis based on COSMO-SkyMED data produced by e-geos in the framework of the G-Mosaic project (most of the statistics related to the number and type of map products are based on ad-hoc queries in the catalogue service provided by ReliefWeb, setting as temporal extent 1 month after the event)
As far as the approaches based on optical EO data are concerned, generally high resolution optical imagery are usedto assess the building damage grade, the damages to infrastructures or the road network accessibility. Although several automatic or semi-automatic techniques exist to identify collapsed building or debris after an earthquake, a visual interpretation approach was generally adopted in the operational context of the Haiti response.
In both cases (optical and SAR data) the analysis is generally based on a multi-temporal analysis between the satellite data acquired before and after the event, but in case no suitable pre-event data is available the analysis can be carried out on just the post event image.
The selected minimal mapping unit was often the single building, especially on the maps based on the high resolution aerial datasets, adopting as damage grades the ones proposed in the European Macroseismic Scale (EMS-98). However in the first hours the analysis were mainly aggregated at grid cell level or at building block level.
When a large amount of data characterized by a high spatial resolution is available, and having the emergency response phase tight time constraint, a coordinated participatory approach, that assigns small grid cells covering the affected areas to several image analysts, is the most effective to assess the impact of the event. Effective coordination is especially required to allow a joint effort among different entities, like the joint remote sensing damage assessment carried out by Unitar/Unosat, World Bank and EC Joint Research Centre. Earthquake damage assessment obviously needs large or very large maps scale datasets (especially concerning built-up areas and road network) to act as backdrop of the damage assessment maps and/or to perform tailored analyses. The availability of this kind of reference dataset is generally critical in developing countries such as Haiti, which demonstrates the importance of participatory mapping through media as OpenStreetMap or Google Map Maker that allowed mapping large parts of Haiti within a few days.
3. SATELLITE/AERIAL BASED DAMAGE ASSESSMENT ACCURACY
As far as satellite based impact assessment is concerned, the main issue that requires an in-depth investigation is the reliability of the provided information, i.e., the expected accuracy of the damage assessment according to the technical features of the available satellite/aerial imagery (e.g., sensor type, ground sample distance, off-nadir angle, and spectral resolution). Validation activities related to information derived by means of remote sensing are therefore crucial in order to get the end users aware of the accuracy they can expect from a specific satellite/aerial based analysis, consequently interpreting the outputs for a more effective response activity.
Recent studies (Saito et al. 2010, Booth et al 2011) highlighted that vertical imagery (and in certain conditions also oblique ones) may be limiting in discriminating the level of damage of some buildings. In the summary of the “2nd International Workshop on Validation of geo-information products for crisis management” (JRC, Ipsra – Italy, 12-13 October 2010), it is explicitly reported that a validation of a joint damage assessment (using airborne images) performed with around 6,000 geo-tagged photos collected in the field gave an overall accuracy of only 60%. According to (Corbane et al, 2011) the estimated overall accuracy of the best available spatial resolution dataset (0.15 m) is about 65% in comparison to GPS geo-tagged pictures acquired during ad-hoc field surveys. A International Archives of the Photogrammetry, Remote Sensing and Spatial Information Sciences, Volume XXXIX-B4, 2012
XXII ISPRS Congress, 25 August – 01 September 2012, Melbourne, Australia
similar overall accuracy value (70%) is achieved by (Ajmar et al, 2011).
The confusion matrixes obtained by several authors (Booth et al, Corbane et al , Ajmar et al, 2011) show that the main issue when analyzing vertical images is the identification of intermediate damage grades, with a common trend to underestimate the overall impact of the earthquake when using vertical images.
The spatial resolution (GSD, Ground Sample Distance) of the raster images used as input data for assessing the damage grades is strictly related to the completeness of the analysis, since the number of damage locations identified on 0.15 m aerial data can increase up to an order of magnitude in comparison to 0.5m satellite data (Corbane et al, 2011).
4. CONCLUSIONS AND CONSIDERATIONS
Satellite remote sensing data are the only available data source during the first hours/days after the event. Aerial images, if acquired, are available starting from a few days after the event, while field information (the ground truth data used for validation purposes) are generally acquired several weeks later, often during the Post Disaster Needs Assessment phase. Therefore satellite remote sensing play a crucial role in supporting the emergency response activities, especially in depicting the overall spatial pattern of building damage when aggregated at building block level (Corbane et al, 2011b) The methodology largely adopted in an operational context in order to cope with the time constraints and the accuracy requirements of emergency response activities is based on visual interpretation of building damage through comparison of pre and post event very high resolution optical remote sensing data. Several methodologies have been proposed for the analysis of SAR intensity and/or phase data, that should be further investigated in order to fully exploit this data source (crucial especially in case of persistent cloud cover in the first hours after the event) in an operational framework.
Considering the large amount of data to be analyzed, a cooperative approach allow to distribute the work load among several image analyst, potentially coming from different institutions working on a joint effort.
The overall accuracy of (near) vertical images acquired by satellite and aerial platform is mainly limited by the impossibility to assess visible damages to the building facades or because the soft storey collapses are not detectable when the roof is completely or largely intact (Booth, 2011). Oblique highlighting the difficulties in identifying intermediate building damage grades (light to medium damages) as well as in distinguishing among heavily damaged and completely destroyed buildings.
In order to reduce commission errors occurring during the visual interpretation of the pre and post event data, it is remarked the importance to agree on an international set of damage definitions, including a set of templates coming from satellite/aerial vertical and oblique images as weel as pictures and notes taken in the field (Booth, 2011). Furthermore common interpretation guidelines to be shared among the main entities involved in satellite based emergency mapping should be agreed in order to have outputs as homogeneous as possible, with the paramount goal to avoid the delivery of any potential
misleading or contradictory information to the end users. A more structured and coordinatated collaboration among the aforementioned entities is therefore recommended (as proposed by Voigt et al, 2011), also with the purpose to allow a more effective involvement of the crowd-sourcing community and the volunteer mappers in the image analysis activities.
REFERENCES
Andrea Ajmar, Simone Balbo, Piero Boccardo, Fabio Giulio Tonolo, Marco Piras, Jan Princic, 2011. A Low-Cost Mobile Mapping System (LCMMS) for field data acquisition: a potential use to validate aerial/satellite building damage assessment, International Journal of Digital Earth, iFirst
Booth E., Saito, K., Spence, R., Madabhushi, G., Eguchi, R., 2011. Validating Assessments of Seismic Damage Made from Remote Sensing, Earthquake Spectra, Volume 27, No. S1, pages S157–S177, October 2011; VC 2011, Earthquake Engineering Research Institute
Corbane, C., Carrion, D., Lemoine, G., Broglia, M., 2011. Comparison of Damage Assessment Maps Derived from Very High Spatial Resolution Satellite and Aerial Imagery Produced for the Haiti 2010 Earthquake, Earthquake Spectra, 27, pp. S199-S218
Corbane et al., 2011b. A Comprehensive Analysis of Building Damage in the January 12 , 2010 M w 7 Haiti Earthquake using High-Resolution Satellite and Aerial Imagery, Photogrammetric Engineering & Remote Sensing, Vol. 77, No. 10, October 2011
Duda, K.A., Jones, B. K., 2011. USGS Remote Sensing Coordination for the 2010 Haiti Earthquake, Photogrammetric Engineering & Remote Sensing, Vol. 77, No. 9, September 2011, pp. 899-907, 0099-1112/11/7709-0899
EC-JRC, 2011. Technical Specifications IPSC/2011/ 02/04/OC, Annex A GIO-EMS mapping in rush mode product portfolio specifications.
Matsuoka, M., Yamazaki, F. 2004. Use of Satellite SAR Intensity Imagery for Detecting Building Areas Damaged Due to Earthquakes. Earthquake Spectra Volume 20, No. 3. Pp 975–994. © 2004, Earthquake Engineering Research Institute
Polli, D., Dell’Acqua, F., Gamba, P., Lisini, G., 2010. “Earthquake damage assessment from post-event only radar satellite data”. Proceedings 8th International Workshop on Remote Sensing for Disaster Management.
Saito, K., Spence, R., Booth, E., Madabhushi, G., Eguchi, R., and Stuart, G., 2010. Damage assessment of Port au Prince using Pictometry. Proceedings 8th International Workshop on Remote Sensing for Disaster Management
Sham,J., Eguchi, R., Jones, B., 2011. Special Issue: Haiti 2010 Earthquake, Photogrammetric Engineering & Remote Sensing, Vol. 77, No. 10, October 2011
Voigt, S. et al, 2011. Rapid Damage Assessment and Situation Mapping: Learning from the 2010 Haiti Earthquake, Photogrammetric Engineering & Remote Sensing, Vol. 77, No. 9, September 2011, pp. 923-931, 0099-1112/11/7709-0923 International Archives of the Photogrammetry, Remote Sensing and Spatial Information Sciences, Volume XXXIX-B4, 2012
XXII ISPRS Congress, 25 August – 01 September 2012, Melbourne, Australia