For more information,
A research and education initiative at the MIT Sloan School of Management
Consumer Decision-making at an Internet
Shopbot
Paper 137
Michael D. Smith Erik Brynjolfsson
Consumer Decision-making
at an Internet Shopbot
Michael D. Smith* and Erik Brynjolfsson**
This Version: July 23, 2001
Acknowledgements: We thank David Genesove, Austan Goolsbee, Il-Horn Hann, John D.C. Little, Thomas Malone, Allen Montgomery, Nancy Rose, Catherine Wolfram, Richard Zeckhauser, Robert Zeithammer, two reviewers and seminar participants at Boston University, Carnegie-Mellon University, The University of Chicago, Indiana University, the University of Maryland, MIT, the University of Michigan, the University of Texas at Austin, Stanford University, The Wharton School, the NBER E-Commerce Project, the Brookings conference on “Measuring E-E-Commerce” (Brookings Institution, September 24, 1999), and the Workshop on Information Systems and Economics (December 11, 1999) for valuable comments on this research. We thank Christoph Janz and Christopher Muenchhoff of EvenBetter.com for generously collecting the data necessary to conduct this research and for providing valuable insight into the shopbot market. Thomas Cheng and Frederic Mahoue provided excellent research assistance. The Center for eBusiness@MIT provided generous financial support under a grant from Fleet Bank.
* H. John Heinz III School of Public Policy and Management, Carnegie Mellon University; email:
[email protected]; web: http://www.heinz.cmu.edu/~mds
** Sloan School of Management, Massachusetts Institute of Technology; email: [email protected]; web:
Consumer Decision-making
at an Internet Shopbot
ABSTRACT
Internet shopbots compare prices and service levels at competing retailers, creating a laboratory for analyzing consumer choice. We analyze 20,268 shopbot consumers who select various books from 33 retailers over 69 days for a total of 1,512,856 observed offers. Although each retailer offers a
I. Introduction
Shopbots are Internet-based services that provide “one-click” access to price and product
information from numerous competing retailers. In so doing, they reduce buyer search costs for
product and price information by at least 30-fold compared to telephone-based shopping and
even more compared to physically visiting the retailers (Brynjolfsson and Smith [2000a]).
Shopbots collect and display information on a variety of product characteristics, list summary
information for both well- and lesser-known retailers, and typically rank the retailers based on a
characteristic of interest to the shopper such as price or shipping time. The resulting comparison
tables reveal a great deal of variation across retailers in relative price levels, delivery times, and
product availability.
These shopbots provide researchers with an opportunity to observe customer choice behavior
as consumers evaluate the listed alternatives and click on a particular product offer. Consumer
choice behavior can then be analyzed using econometric models to reveal how consumers
respond to different aspects of the product bundle, such as price, brand and shipping time. For
example, how important is retailer brand in determining customer choice? Is brand more
important for some types of consumers and for some types of decisions than for others? How
do consumers react to the allocation of total price to different components such as tax or
shipping cost?
We address these questions through panel data gathered from an Internet shopbot in the market
for books. We use these data to study how customers responded to the presence of brand both
in aggregate and then by analyzing how consumers respond differently to contractible aspects of
the product bundle versus non-contractible aspects such as promised delivery times.
Our approach to analyzing electronic markets complements recent empirical studies that
examine Internet pricing behavior from the perspective of efficiency (Bailey [1998];
Krishnan, Wolff [2001]), and price discrimination (Clemons, Hann, and Hitt [1998]). While
these studies are able to analyze competitive strategies across retailers and markets, they
provide only second-order evidence of consumer behavior in electronic markets. In contrast,
the current paper and a companion paper (Brynjolfsson and Smith [2000b]), directly analyze
customer behavior by using the shopbot as a laboratory of sorts where consumers respond to
heterogeneous offers from a variety of retailers.
Our data show that shopbot customers, who might be considered among the most price
sensitive consumers on the Internet, respond very strongly to well-known, heavily branded
retailers. While there have been predictions that the Internet would “commodify” many
industries and reduce the role of differentiation, our results show that branding can be important
even for homogeneous goods such as books. Not all consumers value brands equally, however.
We find that that branding is especially important for consumers who care about
non-contractible aspects of the product bundle. In particular, consumers who care about shipping
times are especially likely to prefer well-known brands, potentially because promised shipping
times are difficult to enforce. We also find that customers respond strongly to the ordinal ranking
of offers in the price comparison table (as opposed to the absolute price) and that customers
appear to be more sensitive to changes in sales tax and shipping cost than they are to changes in
item price, even when the total price they must pay is unaffected.
The remainder of this paper is organized in three parts. Section II summarizes the data we
collect and the empirical models we use to analyze our data. Section III presents our main
results. We summarize our findings in Section IV.
II. Data and Methods
Our analysis uses panel data collected from book consumers at EvenBetter, a prominent
Internet shopbot.1 An important advantage of our setting is that consumers using this service first
identify the specific book they are interested in purchasing, which narrows their selection to a
Amazon are indistinguishable from those of a book sent by A1 books, although other aspects of
the overall product bundle, such as shipping times can and do differ.
Once the book is chosen, consumers provides their country and state so that local currency and
local taxes can be calculated correctly. After the consumer initiates a search, EvenBetter queries
prices for this selection in real time from 33 different book retailers, which collectively account
for the vast majority of books sold online. Because this information is queried in real time
directly from the retailers, the information displayed by EvenBetter’s comparison tables are the
same as those obtained by visiting retailers’ sites directly.
Based on the information returned, EvenBetter provides consumers with a list of product offers.
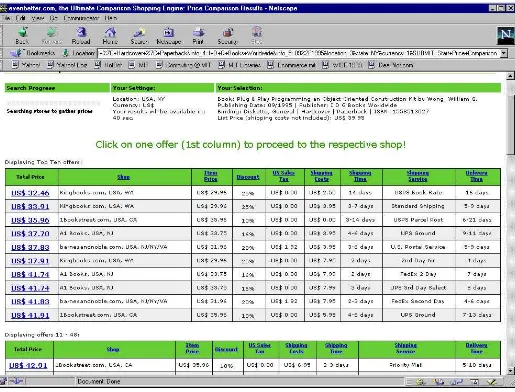
Each offer includes separate fields for the total price, item price, shipping cost, sales tax,
delivery time, shipping time, and shipping service (e.g., Figure 1). By default, the table is sorted
in ascending order on total price but the consumer can sort the table based on any of the other
eight columns if they desire. Consumers view these tables and make an observable choice by
clicking on an offer. By clicking on an offer, the consumer is taken directly to the retailers’ web
site where they can finalize their purchase. Where consumers click on multiple offers in a search
(16% of the time), we use the offer they click on last as an indication of their final choice.
Figure 1: Sample Screen from EvenBetter.com Insert Figure 1 Approximately Here
Our data include the information shown to the consumer in the offer comparison table, the
consumer’s cookie number, and the consumer’s behavior (whether they sort on a column other
than total price and their last click). In addition we derive two other variables of interest to
consumers. First, we derive a variable for the time it takes the retailer to get the book from their
distributor, which we refer to as the acquisition time. The acquisition time is the difference
between the delivery time and the shipping time shown in Figure 1. Second we derive a variable
we call weighted sales tax, which takes into account locality taxes in addition to state sales tax.
While EvenBetter.com customers are only shown state sales tax, many customers will also have
that customers are taking these locality taxes into account when making their purchases, we
multiply the state sales tax shown to the consumers by the relevant locality taxes weighted by
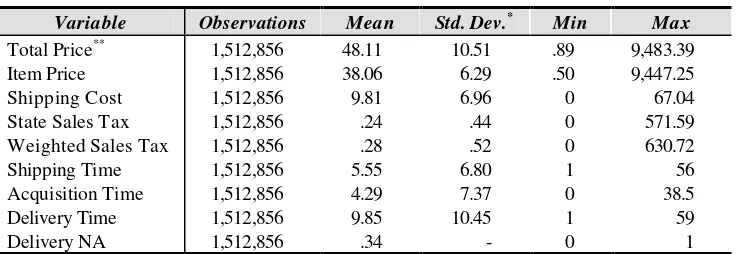
Internet population in 1999.2 The data we gather is described in Table I and summary statistics
are presented in Table II.
Table I: Shopbot Data Collected Insert Table I Approximately Here
We obtained data for the period from August 25 to November 1, 1999. In this paper, we focus
on the subset of the sample that 1) includes U.S.-based consumers (75.4% of sessions), 2) lead
to at least one click-through by the consumers (26.3% of remaining sessions) and 3) return
more than one retailer (99.9% of remaining sessions). The resulting data set reflects searches by
20,268 distinct consumers, including 7,498 repeat visitors. These consumers conducted a total
of 39,635 search sessions returning 1,512,856 distinct retailer offerings including multiple offers
from some retailers.
Table II: Summary Data Statistics Insert Table II Approximately Here
Two important attributes of these data are readily observed. First, there is a high degree of price
dispersion across homogeneous books in the offer sets: on average, the lowest priced offer is
33% ($16.54) less than the mean price in the offer set for a given book title. In a sense, this
statistic overestimates dispersion since it includes both shipping price and item price. However,
considered alone, item price also exhibits a significant amount of dispersion. The difference
between the lowest item price and the mean item price averages 28% ($11.03). While such a
large difference in prices among homogeneous goods may seem surprising, this level of
dispersion is comparable to Brynjolfsson and Smith ([2000a] p. 575) who gathered prices
directly from a collection of Internet and conventional book retailers between 1998-1999.
Second, a majority of the consumers in our sample do not choose the lowest priced offer.
Among consumers who do not choose the lowest priced offer, the average selected offer is
is related to differences in shipping time. Consistent with this, we find that 15% of the consumers
in our sample select an upgraded shipping method within their retailer selection.3 However, we
also find that 27% of the customers in our sample choose an offer that is strictly dominated in
terms of both price and delivery time for a given title. Furthermore, 45% of customers who
choose a strictly dominated offer choose an offer from Amazon, Barnes & Noble, or Borders.
This compares to 27% of consumers who select these retailers in the entire data sample.
Both the high levels of price dispersion and the willingness of consumers to bypass the lowest
cost retailers suggests that customers perceive some differences among retailer branding or
service quality that make at least some of them willing to pay a premium for an otherwise
homogenous product
We use the multinomial logit and nested logit models to systematically analyze this possibility.
These models have gained wide-spread use in a variety of choice settings (e.g., McFadden
[1974], Guadagni and Little [1983], Ben-Akiva and Lerman [1985], Bucklin and Gupta
[1992], Berry [1994], Fader and Hardie [1996], Guadagni and Little [1998], Fershtman and
Gandal [1998]) and make a useful reference model for our analysis given the manner in which
shopbot data is shown to consumers. Both models have consumers choosing the offer with the
largest latent utility index from a choice set of offers. The latent utility index consists of a
systematic (xit′β ) and a stochastic (εit) component:
(1) Uit =x′itβ +εit
The systematic component is linear combination of the product’s attributes (x′it) and the
consumer’s preferences for those attributes (β ) for each offer t in each session i. In our setting,
the stochastic component reflects both unobserved taste variation across consumers and
measurement error in evaluating offers as is common in the literature.
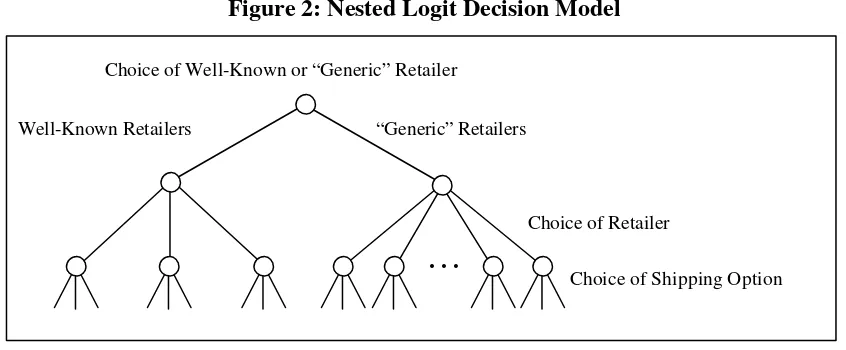
The multinomial logit model assumes that these errors are independent across offers in a choice
groups of offers such that error independence is maintained within these nests, but not
necessarily across different nests. The independence assumption might be violated in our data
when comparing well-known retailers (i.e. Amazon, Barnes & Noble, and Borders) with
lesser-known retailers. It could also be violated when comparing shipping options at different retailers.
Because of this, we use a nested logit model, shown in Figure 2, with a top-level nest of the
choice between well-known and generic retailers, a mid-level nest of the choice between
retailers, and a lower level nest of the choice between shipping options for each retailer (e.g.,
express, priority, and bookrate shipping).
Figure 2: Nested Logit Decision Model Insert Figure 2 Approximately Here
In interpreting our results from these models, it is important to note that we observe
click-throughs and not purchases in our data. Because of this our models reflect those factors that
drive traffic to a site, not necessarily those that drive sales. However, in related research
(Brynjolfsson and Smith [2000b]) we find that the factors that drive traffic are also relatively
unbiased predictors of sales at the retailer level. This finding increases the validity of inferences
in this regard. Nonetheless, a conservative interpretation our approach is as a model of
click-throughs, not of sales per se.
In addition, our analysis is, by necessity, restricted to consumers who choose to use this
particular shopbot. Thus, our logit model predictions are conditioned on a consumer choosing to
use EvenBetter.com. While conditioning in this way does not bias the logit results, they should
be interpreted as applying to a self-selected set of consumers who are likely to differ
systematically from other Internet shoppers. In particular, it seems likely that the customers in
our sample are more price sensitive and less brand sensitive than a broader set of Internet
III. Empirical Results
III(i) Customer Response to Retailer Brand
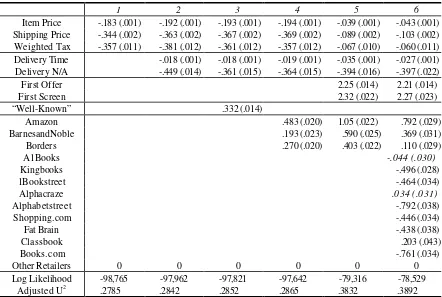
We first analyze how customers respond to brand at this Internet shopbot. Table III shows our
results using a multinomial logit model where customer choice arises from elements of price,
elements of delivery time, the position of the offer in the price comparison table, and retailer
fixed effects. We include retailer fixed effects in two ways. In specification three we include a
single dummy variable (“well-known retailer”) for whether the retailer was Amazon, Barnes &
Noble, or Borders. In specification four we include separate dummy variables for each of these
three retailers. Specification five adds variables for the position of the offer in the table.
Specification six adds dummy variables for all retailers with more than 3% of the last click
throughs in the sample.
Table III: Models of Retailer Brand Choice Insert Table III Approximately Here
These results illustrate several important facts about customer behavior at this Internet shopbot.
First, customers are very sensitive to price. This is reflected in the magnitude and significance of
the price coefficient in the regression.
Second, and similarly, we note that customers respond very strongly to the position of an offer
in a table. This can be seen in specifications five and six. Offers with the first listed price and
those that appear in the first screen of offers are strongly preferred to other offers further down
the comparison table. This is consistent with the very high sensitivity to the price rank of retailers
found by Ellison and Ellison [2001] when they examined the market for commodity memory
modules sold via a price search engine.
Third, our results show that customers also strongly prefer offers from well-known retailers
(Amazon, Barnes & Noble, and Borders) even after controlling for observable product
differences such as price and delivery time. Within these retailers, customers have a strong
specification of the model. Thus, while it has been widely speculated that the Internet, and
comparison-shopping agents in particular, would undermine the role of brands (see e.g. Kuttner
[1998]), we find a strong role for brands in our analysis, even for a homogeneous product like a
certain book being sold by different retailers.
We can quantify the importance of brand since the coefficients are factor weights in a latent
utility index. Thus, using equation (1) one can calculate the decrease in item price that would be
required to offset the presence of retailer brand:
(2)
Using this specification, we find that offers from well-known retailers have a $1.72 price
advantage (.332/.193) over generic retailers. Further looking at the individual well-known
retailers we find that Amazon has a $2.49 price advantage over generic retailers and about a
$1.30 price advantage over its two closest rivals, Barnes and Noble and Borders.
Fourth, using a similar calculation to equation (2), we find that customers are approximately
twice as sensitive to changes in shipping price and sales tax as they are to changes in item price.4
The sensitivity of consumers to how total prices is allocated among components is puzzling –
one might reasonably expect that a penny labeled “tax” or “shipping” would have the same
disutility as a penny allocated to “item price.” However, prospect theory (Kahneman and
Tversky [1979]) suggests a variety of reasons that consumers might attach significance to the
way prices are labeled such as a perception of unfair pricing policies (Kahneman, Knetsch and
Thaler [1986]) or using different reference points to compare shipping and item prices (Thaler
[1985]). In addition, there is a growing marketing literature showing that customers may
respond differently depending on how prices are allocated among the different elements of a
“partitioned price” (e.g., Morwitz, Greenleaf, and Johnson [1998]). As we wrote up these
results, we had a discussion with Jeff Wilke, Senior Vice President at Amazon, about this
seeming paradox. He told us “It’s no anomaly. We’ve been noticing some of the same things
an experiment in which it offered free shipping, raising the item prices of some books to
compensate. Shortly thereafter, BarnesAndNoble.com also provided a free shipping option and
their President Marie Toulantis was quoted as saying they’d been contemplating the change for
several months (Miles [2001]).
The desire of consumers to select retailers who don’t charge sales tax has some commonality
with Goolsbee [2000] who finds that customers are more likely to make purchases over the
Internet if they live in areas with high state and local sales tax rates. However, our result seems
to suggest that customers are much more sensitive to $0.01 of sales tax than they are to $0.01
of item price even though both values have the same effect on the total price.
While there are theories which might explain this behavior, as noted above, it is also possible
that these results are driven by the restrictive elasticity structure imposed by the multinomial logit
model (a.k.a. the Independence of Irrelevant Alternatives assumption). This could impact our
model either on the basis of correlation across similar retailers or correlation across shipping
options within a particular retailer. We use the nested logit to address this possibility by nesting
on the choice of well-known versus “generic” retailers, the choice of a specific retailer within
these nests, and on the choice of shipping options within a particular retailer nest. Our results are
shown in Tables IV-VI.
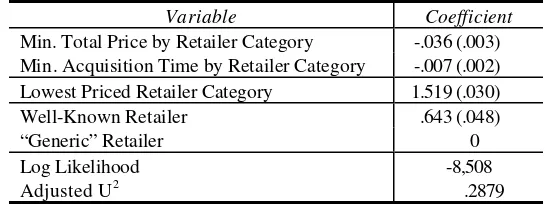
Table IV models a consumer’s choice between well-known and generic retailers. In this
regression we control for which retailer category has the lowest price (“Min. Total Price by
Retailer Category”) and which retailer category is able to get the book from their distributor in
the shortest amount of time (“Min. Acquisition Time by Retailer Category”).6 We also include a
dummy variable for the retailer category with the best price and a dummy variable for the
well-known retailer category.
Table IV: Nested Logit Level 1 – Choice of Well-Known versus “Generic” Retailers Insert Table IV Approximately Here
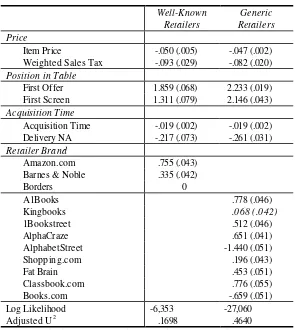
Tables V and Table VI model the choice among retailers and the choice of shipping options
acquisition time, delivery N/A, sales tax, position in table for the best offer from the retailer, and
retailer dummy variables. As above, we include dummy variables for all retailers with more than
a 3% share of choices. Table VI models the choice of shipping options as arising from position
in the comparison table and dummy variables for shipping options.7
Table V: Nested Logit Level 2 – Choice of Retailer Insert Table V Approximately Here
Our results with regard to brand, position in table, and sensitivity to tax are consistent with our
results above. Customers strongly prefer well-known retailers in the top-level nest and, within
the set of well-known retailers, customers prefer offers from Amazon.com to offers from its two
closest rivals. We explore this result in more detail in the next section. In the second and third
level nests, customers respond strongly to position in the comparison tables. Further, in the
second level nests, customers are still approximately twice as sensitive to changes in sales tax as
they are to changes in item price, as observed above.
Table VI: Nested Logit Level 3 – Choice of Retailer Shipping Options Insert Table VI Approximately Here
However, we are unable to simultaneously control for the IIA problem and analyze shipping
price sensitivity. In the lower level nests, it is impossible to include a separate shipping price
variable in addition to shipping option dummy variables because shipping prices do not vary
within retailers over time or across offers in our sample. It also is impossible to simultaneously
include shipping price and shipping time variables in place of the shipping option dummy
variables because of collinearity in these variables within retailer offer sets.8 Lastly, it is
impossible to identify shipping sensitivity from the coefficients on the shipping option dummy
variables since they are defined with respect to other shipping options within a retailer nest and
relative prices for these shipping options tend to co-vary across retailers.
Because of this, our results with regard to shipping price sensitivity should be seen as suggestive
non-nested and non-nested specifications are encouraging for the non-non-nested results, the question of
customer sensitivity to partitioned prices on the Internet warrants further confirmatory study.
III(ii) Contractible and Non-contractible Product Characteristics
Branding is sometimes considered an aid to consumer search, helping customers find a vendor
for a given product. This rationale is largely eliminated in the shopbot setting. Nonetheless, there
are a variety of possible reasons why branding would remain important to consumers choices
even when better prices and deliver times are plainly listed and just a mouse click away at
competing retailers. One candidate possibility is that customers care not only about the product
they are buying, in this case the book, but also about service quality. In the shopbot setting, the
product is, by construction, entirely homogeneous across retailers — books are uniquely
identified by their ISBN, and once delivered, are indistinguishable across retailers. However, the
service quality may differ. For instance, some retailers may ship more rapidly and reliably than
others, or have a simpler ordering process, or be more willing to accept returns. Consumers
might reasonably pay a premium for such services. Furthermore, while retailers may promise
high levels of quality, such promises are not easy to enforce. Branding can serve as a signal, or
bond, that consumers can use to identify retailers with higher service quality. An implication of
this hypothesis is that customers who care more about non-contractible aspects of the product
bundle should also put more weight on the brand of the retailer.
Contractible aspects of the product bundle include aspects where consumers have clear
avenues of recourse if the retailer does not deliver what they had promised such as the
characteristics of the physical product or the product’s price. Other aspects of the product
bundle, such as delivery time, are non-contractible. It is difficult, if not impossible, to force the
retailers to deliver a product within the time frame quoted to the consumer, and if a book arrives
too late for a child’s birthday party or an important presentation, even a full refund of the
purchase price may be little consolation. In the presence of non-contractible product
proxy for credibility in fulfilling promises on non-contractible aspects of the product bundle (e.g.,
Wernerfelt [1988]).
To investigate empirically how consumers respond to non-contractible aspects of the product
bundle we assume that consumers who sort the offer comparison tables based on elements of
shipping time (e.g., shipping service, shipping time, and total delivery time) are more sensitive to
accuracy in delivery time than consumers who accept the default sorting (total price).9 We then
compare the responses of these two sets of consumers to relevant aspects of the product
bundle (Table VII).
Table VII: Sorting Based on Shipping versus Price Insert Table VII Approximately Here
The selected comparison variables include the differential response of consumers who sort on
shipping columns to the product’s item price, shipping price, average delivery time, and a
dummy variable identifying whether the product is sold by a well-known retailer. These
variables were chosen using a likelihood ratio test to compare the restricted model (in Table
VII) to an unrestricted model where all variables are allowed to vary between consumers who
sort on shipping and consumers who sort on price. The likelihood ratio test failed to reject
(p<.05) the null hypothesis that there is (jointly) no difference in the response of the two groups
of consumers to the tax variable and delivery N/A.
Our results show that consumers who care about accuracy in delivery time are, not surprisingly,
less sensitive to item price and shipping price and more sensitive to average delivery time.
Strikingly, these consumers are also more than four times more sensitive to the presence of
brand in an offer than consumers who sort in price. These results confirm the economic intuition
above. Consumers who care about non-contractible aspects of the product bundle appear to
use retailer brand as a proxy for credibility.
We can also compare additional subsamples of the data to address related questions about the
role of brands. Is reliance on brand lower for consumers who use the shopbot heavily? These
are most knowledgeable of how to find retailers on the Internet. It is also possible that frequent
book purchasers are more likely to be sensitive to quality service as a function of their
motivation for making the frequent purchases. To analyze this we classify cookie numbers that
appear only once in our 69-day sample as representing “infrequent visitors” and cookie
numbers that appear multiple times in our sample as representing “frequent visitors.” We present
multinomial logit model results for these two groups of consumers in Table VIII.
Table VIII: Comparison of Frequent and Infrequent Visitors Insert Table VIII Approximately Here
Because each model has a unique and unidentified scale parameter we are unable to directly
compare coefficients across model specifications (Swait and Louviere [1993]). However, it is
possible to compare coefficients across model runs after normalizing to a common variable
within each specification. Normalizing in this manner cancels the scale parameter and provides a
common basis for comparison. In our case, we normalize each coefficient in Table IX as follows
(3)
where j is item price and s={frequent visitors, infrequent visitors}. Thus, as in equation (1)
we express each coefficient in terms of its dollar value impact on a consumer’s evaluation of the
product bundle. Our results from this normalization are shown in Table IX and the resulting
standard errors (sf / nf ) are listed in parentheses.
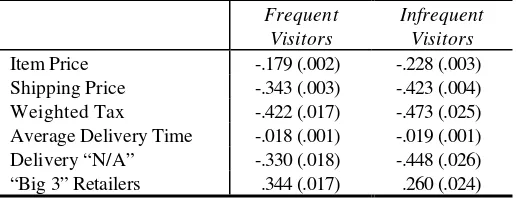
Table IX: Comparison of Frequent and Infrequent Visitors, Normalized by Item Price Insert Table IX Approximately Here
In each case, we test the null hypothesis that the normalized coefficients are equal using the
standard t-test for µ =a µb with σa and σb unknown and σ ≠a σb. Under this test, we
reject the null hypothesis for average delivery time and the presence of brand at p=0.05, finding
instead that frequent visitors are more sensitive to average delivery time and the presence of
and delivery “N/A.”Consumer response to these coefficients is statistically the same for
frequent and infrequent visitors. One possible explanation for this finding is that frequent
purchasers are more sensitive to elements of service quality and this is reflected in using brand
as a proxy for this non-contractible element of the product. We also note that this finding does
not support the conventional wisdom that regular users of shopbots will, over time, rely on
brand less in their purchase behavior.
IV. Conclusions
Internet shopbots provide a setting for consumer choice that closely resembles the idealized
setting commonly assumed in common choice models. By evaluating data from such a setting we
are able to assess the importance of pricing and branding strategies in the Internet bookselling
market.
We find that shopbot customers in our data care a great deal about the brand of the retailer
selling the books and in particular, they strongly prefer offers from well-known retailers —
Amazon, Barnes & Noble, and Borders — even though they are fully informed of product
prices and characteristics from other competing retailers. Further, customers prefer offers from
Amazon to offers from Amazon’s two closest rivals, Barnes & Noble and Borders. These
results are all the more striking when one considers that shopbot customers are likely to be
among the most price sensitive customers on the Internet.
One possible explanation for this result, supported by our data, is that consumers use brand
name as a signal of reliability in service quality for non-contractible aspects of the product
bundle such as shipping. These results may derive from service quality differentiation,
asymmetric market information regarding quality, or cognitive lock-in among consumers. While
books are a relatively well-specified, homogeneous commodity, the fact that branding is
important even here suggests that the branding will be even more important in Internet markets
for less homogeneous goods and services, especially when they have important non-contractible
Our results also suggest that customers are more sensitive to price changes in sales tax and
shipping price than they are to changes in item price. That customers may respond differently to
a marginal increase in the total price of a book depending on how that increase is allocated
among the elements of total price is consistent with recent pricing experiments conducted by
major online booksellers.
Finally, for academic researchers, our results demonstrate the feasibility of using Internet
shopping data to better understand consumer behavior in electronic markets. While earlier work
(Brynjolfsson and Smith [2000a]) revealed a surprisingly large amount of price dispersion
across Internet retailers of homogeneous goods, the current paper shows how shopbot data
enables us to specifically identify the drivers of this dispersion: differentiated branding and
service quality. Even as we are able to better understand the high levels of price dispersion,
other research questions emerge. Future research in this regard may be able to extend these
results to better understand how web site direct and shopbot consumers respond to partitioned
prices including shipping, tax and other costs, to evaluate the cognitive processing costs of
shopbot consumers, and to empirically analyze the application of personalized pricing strategies
References
Bailey, J. P., 1998, ‘Intermediation and Electronic Markets: Aggregation and Pricing in Internet Commerce’, Ph.D. Thesis, Technology, Management and Policy, Massachusetts Institute of Technology, Cambridge, MA.
Ben-Akiva, M. and Lerman, S. R., 1985, Discrete Choice Analysis: Theory and Application to Travel Demand (The MIT Press, Cambridge, MA).
Berry, S.T., 1994, ‘Estimating Discrete-Choice Models of Product Differentiation’, RAND Journal of Economics, 25, pp. 242-262.
Brynjolfsson, E. and Smith, M., 2000a, ‘Frictionless Commerce? A Comparison of Internet and Conventional Retailers’, Management Science, 46, pp. 563-585.
Brynjolfsson, E. and Smith, M., 2000b, ‘The Great Equalizer? Consumer Behavior at Internet Shopbots’, MIT Working Paper.
Bucklin, R. E. and Gupta, S., 1992, ‘Brand choice, purchase incidence, and segmentation: An integrated modeling approach’, Journal of Marketing Research, 29, pp. 201-215.
Clay, K., Krishnan, R. and Wolff, E., 2001, ‘Price strategies on the web: Evidence from the online book industry’, Journal of Industrial Economics, Forthcoming, This Volume.
Clemons, E. K., Hann, I. and Hitt, L. M., 1998, ‘The Nature of Competition in Electronic Markets: An Empirical Investigation of Online Travel Agent Offerings’, Working Paper, The Wharton School of the University of Pennsylvania, Philadelphia, PA.
Ellison, G. and Ellison, S.F. “Search, Obfuscation and Price Elasticities on the Internet”, Working Paper, MIT, January, 2001.
Fader, P. S. and Hardie, B. G. S., 1996, ‘Modeling Consumer Choice Among SKUs’,
Journal of Marketing Research, 33, pp. 442-452.
Fershtman, C. and Gandal, N., 1998, ‘The Effect of the Arab Boycott on Israel: The Automobile Market’, RAND Journal of Economics, 29, pp. 193-214.
Goolsbee, A., 2000, ‘In a world without borders: The impact of taxes on Internet commerce’,
Quarterly Journal of Economics, 115, pp. 561-576.
Guadagni, P. M. and Little, J. D. C., 1998, ‘When and What to Buy: A Nested Logit Model of Coffee Purchase’, Journal of Forecasting, 17, pp. 303-324.
Kahneman, D., Knetsch, J. L., Thaler, R., 1986, ‘Fairness as a Constraint on Profit Seeking: Entitlements in the Market’, The American Economic Review, 76, pp. 728-741.
Kahneman, D., Tversky, A., 1979, ‘Prospect theory: An analysis of decision under risk’,
Econometrica, 47, pp. 263-292.
Kuttner, R., 1998, ‘The Net: A Market Too Perfect for Profits?’ Business Week, May 11, p. 20.
McFadden, D., 1974, ‘Conditional logit analysis of qualitative choice behavior’, in Zarembka, (ed.) Frontiers in Econometrics (Academic Press, New York).
Miles, S., 2001, ‘Retailer Barnes & Noble.com Unveils Free-Shipping Program’, Wall Street Journal OnLine July 3, 2001.
Morwitz, V., Greenleaf, E. A., and Johnson, E. J., 1998, ‘Divide and Prosper: Consumers’ Reactions to Partitioned Prices’, Journal of Marketing Research, 35, pp. 453-463.
Swait, J. and Louviere, J., 1993, ‘The role of the scale parameter in the estimation and comparison of multinomial logit models’, Journal of Marketing Research, 30, pp. 305-314.
Thaler, R., 1985, ‘Mental accounting and consumer choice’, Marketing Science, 4, pp. 199-214.
Figure 2: Nested Logit Decision Model
Choice of Well-Known or “Generic” Retailer
“Generic” Retailers Well-Known Retailers
Choice of Retailer
Table I: Shopbot Data Collected
Offer Data
Total Price Item Price plus Shipping Cost plus Sales Tax Item Price The price for the item
Shipping Price The price for shipping State Sales Tax Sales tax (if applicable)
Weighted Sales Tax State sales tax plus city/county taxes weighted by Internet population (1998) Retailer Retailer Name (used to create dummy variables for each retailer)
Shipping Time Average of the minimum and maximum shipping range quoted by retailer Acquisition Time Average of the minimum and maximum acquisition range quoted by retailer Delivery Time Shipping Time plus Acquisition Time
Shipping Method Dummy variables for shipping alternatives offered by retailer
Delivery NA =1 if retailer can’t quote an acquisition time (time to get book from distributor) First Offer Dummy variable for the first offer listed in the price comparison table
First Screen Dummy variable for whether offer appears in the first screen (10 offers) Session Data
Date/Time Date and time search occurred
ISBN ISBN number of book searched for (used to calculate book type) Sort Column Identifies which column the consumer sorted on (default is total price)
Consumer Data
Cookie Number Unique identifier for consumers who leave their cookies on
Cookies On =1 if the consumer leaves cookies on (97.1% of customers leave cookies on) Choice Data
Table II: Summary Data Statistics
Variable Observations Mean Std. Dev.* Min Max
Total Price** 1,512,856 48.11 10.51 .89 9,483.39 Item Price 1,512,856 38.06 6.29 .50 9,447.25 Shipping Cost 1,512,856 9.81 6.96 0 67.04 State Sales Tax 1,512,856 .24 .44 0 571.59 Weighted Sales Tax 1,512,856 .28 .52 0 630.72 Shipping Time 1,512,856 5.55 6.80 1 56 Acquisition Time 1,512,856 4.29 7.37 0 38.5 Delivery Time 1,512,856 9.85 10.45 1 59
Delivery NA 1,512,856 .34 - 0 1
* Standard Deviation in this table is calculated as the average across all sessions of the standard deviation of the variable within each session.
Table IV: Nested Logit Level 1 – Choice of Well-Known versus “Generic” Retailers
Variable Coefficient
Min. Total Price by Retailer Category -.036 (.003) Min. Acquisition Time by Retailer Category -.007 (.002) Lowest Priced Retailer Category 1.519 (.030) Well-Known Retailer .643 (.048)
“Generic” Retailer 0
Log Likelihood -8,508
Adjusted U2 .2879
Table V: Nested Logit Level 2 – Choice of Retailer
Acquisition Time -.019 (.002) -.019 (.002) Delivery NA -.217 (.073) -.261 (.031)
Log Likelihood -6,353 -27,060 Adjusted U2 .1698 .4640
Table VI: Nested Logit Level 3 – Choice of Retailer Shipping Options
Amazon Barnes & Noble
Borders
Position in Table
First Offer .946 (.205) 1.129 (.158) .897 (.103) First Screen .827 (.121) .982 (.143) .981 (.120)
Shipping Option
Next Day Delivery -2.848 (.116) -2.616 (.119) -2.187 (.109) 2 Day Delivery -2.145 (.082) -1.979 (.086) -1.774 (.082) Priority (3-7 day) Delivery 0 0 0 Log Likelihood -1,280 -1,144 -1,849
Adjusted U2 .6312 .5982 .5427
Table VII: Sorting Based on Shipping versus Price
Coefficients
Item Price -.194 (.001)
Shipping Price -.370 (.002) Weighted Sales Tax -.361 (.012)
Delivery Time -.018 (.001)
Delivery N/A -.364 (.015)
“Well-Known” Retailers .321 (.014)
Differential Coefficients for consumers who sort on shipping
Table VIII: Comparison of Frequent and Infrequent Visitors
Frequent Visitors
Infrequent Visitors
Table IX: Comparison of Frequent and Infrequent Visitors, Normalized by Item Price
Frequent Visitors
Infrequent Visitors
Endnotes:
1 On May 19, 2000 EvenBetter.com was acquired by DealTime.com and now operates under
their domain name.
2 We thank Austan Goolsbee for providing these data.
3 E.g., in our sample, 11% of Amazon.com’s customers choose their 1-2 day delivery service
(at a higher price) instead of their 3-7 day standard mail service.
4 As noted above, EvenBetter customers are shown state sales tax only in the offer comparison
tables. To account for the possibility that customers are including locality taxes in their
comparison of offers, our sales tax data includes applicable city and locality taxes weighted by
the number of Internet users in each city/locality area at the end of 1998. Including state sales
tax alone would strengthen our results.
5 Jeff Wilke, personal communication during interview in San Jose California, June 12, 2001.
6 We use acquisition time instead of delivery time because acquisition time is fixed within
retailers and because not all retailers offer express shipping. Including delivery time instead of
acquisition time has a very small affect on our coefficients and would not change our major
results. As noted in Table 1, acquisition time is the time it will take for the retailer to get the
book from their distributor and shipping time is the time to ship the book to the consumer once
it has been obtained from the distributor. Delivery time is the sum of acquisition time and
shipping time.
7 For simplicity, Table 6 only displays results for the three well-known retailers. Results for
8 Across retailers there is enough variation in shipping times and prices to separately identify
these variables.
9 We note that few customers take the time to sort of shipping variables. It may be that few
customers care about shipping service. It is also possible that some customers who care about
shipping leave the table sorted on total price. If this were the case it would mute differences