DOCUMENTATION AND VISUALIZATION OF AN AS-BUILT TUNNEL BY
COMBINING 3D LASER SCANNING AND WEB MAPPING
Chengyi Zhang a, *, David Arditi b, Zhong Chen c
a Graduate student, Dept. of Civil, Architectural, and Environmental Engineering, Illinois Institute of Technology, Chicago, IL, United States - [email protected]
b Professor, Dept. of Civil, Architectural, and Environmental Engineering, Illinois Institute of Technology, Chicago, IL, United States - [email protected]
c President, uGRIDD Corporation, Chicago, IL, United States - [email protected]
KEY WORDS: Laser scanning, underground construction, mapping
ABSTRACT:
A new way to document and visualize the as-built condition of an urban tunnel project with high accuracy is described in this paper, based on recent developments of laser scanning technology. In traditional surveying, the components of a tunnel are organized on the basis of the location of stations and offsets along the project alignment specified in the drawings. It is difficult for people without an engineering background to understand the information involved in surveying reports, drawings, and engineering data. However, in the interest of transparency, public agencies that commission construction projects have to make project information available to government officials and to the general public. This paper discusses the combined use of laser scanning technology and web mapping services to improve the documentation and visualization of an urban metro tunnel. Laser scanning technology is introduced to perform the surveyor’s task, document the as-built condition, and geo-reference the construction elements. A set of panoramic pictures is generated by laser scanning that allows for taking measurements and extracting 3D coordinates. An XML file that contains geo-reference information is appended to each panoramic picture. Using application programming interface (API), this information is referenced to a web mapping service. A case study of the CTA Red line Tunnel in Chicago, IL demonstrates this method in a real life project.
1. INTRODUCTION
Good as-built documentation has the potential to be very valuable to the owners and operators of infrastructure facilities and to all stakeholders in large infrastructure projects. When as-built documentation is obtained soon after project completion, or is updated during construction, and when it is completed to high standards of accuracy, it has multiple uses during the operations phase of large facilities (Chen, 2012). Laser scanning technology, also called LiDAR (Light Detecting and Ranging) has opened new perspectives for recording the three-dimensional geometrical data and supporting geotechnical analysis and asset inventory. Traditionally, the documentation of complex construction projects such as tunnels, primarily relied on conventional surveying methods and photogrammetric techniques (Su et al., 2006).
Compared with the traditional topographic survey method, such as total station and digital photogrammetric documentation, laser scanning technology has a great advantage. With one single setup of the scanner, the laser scanner can generate millions of measurements called point clouds in only few minutes. Each point of this cloud has three-dimensional coordinates with an accuracy of a few millimeters. Photogrammetric documentation is not possible in some extreme conditions because the main limitation of using photogrammetric technology is that objects’ visuals can be greatly influenced by weather and light conditions. Documentation with a total station could also be an option, but the advantage of laser scanning is that millions of points of the complete object are provided whereas measurements with a
total station focus on a rather limited number of critical points of the object (Lam, 2010). The acquisition of accurate data with a high point density in a short time period and in rough field conditions such as in a tunnel, results in growing applications of laser scanning technology (Vassilis, 2012)
The traditional as-built documentation that uses a total station or a digital photogrammetric method is a project-based workflow. Only the product within the contract will be documented (Chen, 2012). The laser scanning technology, on the other hand, offers a product-based workflow for as-built documentation. The entire scenario is acquired by the scanner at the beginning. The point cloud data can deliver the product the client contracted for, can be used as reference when applying for future work. Also, appealing visualization of a project is a good deliverable for advertising or public meetings.
Laser scanning technology helps to document the location of underground utilities and other “hidden” assets like piping and conduits that run underneath floors or behind walls. If the information is accurate and published effectively, a great deal of time and money will be saved when maintaining, repairing, and/or upgrading the facility. By delivering millions of those accurate point clouds, it is easy to make a geo-referenced 3D model for better visualization. This can be part of a system used onsite for functions like work order issuance or inventory management, or transferred to government agencies for use in their systems. Also, it could serve as an assurance to owners and designers that design fidelity has been achieved, and that the completed project meets owner goals.
International Archives of the Photogrammetry, Remote Sensing and Spatial Information Sciences,
Web mapping services such as Google Map and Bing Map have great potential to improve the construction activities and as-built documentation. This paper discusses the combined use of laser scanning technology and web mapping services to improve the documentation and visualization of an urban metro tunnel. It introduced a new way to map the underground as-bulit environment through online map service. A set of panoramic pictures composed of point cloud data is generated by laser scanning that allows for taking measurements and extracting 3D coordinates. An XML file that contains geo-reference information is appended to each panoramic picture. Using application programming interface (API), this information is referenced to a web mapping service. A case study of the CTA Red line tunnel in Chicago, IL demonstrates this method in a real life project.
2. TYPES OF LASER SCANNING TECHNOLOGY
Many laser scanning measuring systems were developed since the 1960s to capture the 3D shape of an object. Terrestrial laser scanners are typically used in civil engineering activities. There are two types of terrestrial laser scanners.
Time-of-flight scanners are the most common type of laser scanner used in civil engineering projects. They are typically utilized to capture 3D as-built data of infrastructure (Jaselskis et al., 2005; Akinci et al., 2006; Bosche et al., 2009; Tang et al., 2011, Dai et al., 2012). Time-of-flight scanners emit a pulse of light which measures the amount of time it takes to travel from the scanner to the object and back allowing the scanner to calculate the distance. A single scan may last several minutes to a few hours depending on the resolution setting and the mechanical system. Once the scanner has calculated the distance, both the horizontal angle and the vertical angle are measured, the speed of light is known by reading the setting, the travel time of the laser pulse can be converted to a precise range measurement, the distance and coordinates of the reflecting object are determined by the following equation:
Equation 1
d = distance; v = light speed; Δt = time interval; α =horizontal angle; and β = vertical angle.
The key benefit of this type of laser scanning technology is its long range. That is why it is typically used for topographic surveys of roadways and as-built structures. Most terrestrial time-of-flight scanners have ranges of hundreds of meters. Alba et al. (2006) listed some time-of-flight scanners that can reach a range of more than 1 km to capture infrastructure systems, such as dams or bridges. The major limitation of time-of-flight scanning systems is their relatively low data collection rates. Even though the latest time-of-flight scanner on the market today can reach up to 1 million points/second, the majority of the scanners still have low collection rates compared to the phased base scanner.
Phase-based scanners use a different distance-measuring principle to achieve a much higher data collection rate relative to time-of-flight systems. Phase-based scanners utilize a constant beam of laser energy that is emitted from the scanner. The phase difference is measured between the sent and the received signal and the change of phase of the laser light is measured to allow the scanner to calculate distances. Phase-based scanners are typically used in industrial applications or interior architectural spaces to populate detailed building information models of existing facilities. The advantage of this
technology is the significant speed of data capture. It can capture hundreds of thousands to millions of 3D points per second, which is approximately ten times faster than most time-of-flight scanning systems (Tang et al., 2009). The major limitation is a short range. The best working range for most phase-shift scanners is less than 100 meters. Beyond that range, noisy data will increase sharply due to range ambiguity issues, mixed pixels (Tang et al., 2009), and other technical problems. Those noisy data at object boundaries can cause inaccurate measurements of object dimensions and may mislead decisions about construction operations (Tang et al., 2009). In all, phase-based laser scanners have a shorter maximum effective range than time-of-flight scanners, but have much higher data collection rates than time-of-flight scanners.
3. METHODOLOGY OF THE STUDY
This section describes the steps adopted in this study.
Pre-scanning phase.
Before starting laser scanning, the environment of the project should be considered to determine the best time to collect data in order to minimize noise from traffic or other factors. Also, obstructions that may cause data voids or shadows should be identified. The scanner set-up plays an important role in the quality of the resulting point cloud. The ideal set-up is to position the laser scanner in such a way that the laser beam is near perpendicular to the surface of the object. Actually, such an ideal set-up may not be possible in practice.
The location of the scanner should be carefully established before scanning is performed by considering the factors mentioned in the preceding paragraph. Safety should always be taken into consideration when designing the location of the scanner. A tall tripod or high position may be used to help reduce noise and avoid obstructions from traffic and pedestrians. Site conditions, project requirement, and the capabilities of the available scanners should be considered to determine the distance of the scans. Some areas that are difficult to scan need to be identified at the beginning. Multiple scans should be performed to minimize the occlusion effect. A good resolution setting or multiple setups increase scan density, and hence accuracy.
Control network setup.
Geodetic control networks are required both on the ground surface and in the underground environment for subsequent surveying operations. Horizontal geodetic control on ground surface is usually undertaken by means of satellite geodesy (GPS observations), while vertical control points are established using precise leveling techniques (Kabashi and Retscher, 2009). Subsequently, ground surface networks are defined and stretched out to provide geodetic control for underground construction such as tunnel projects. For this purpose, open/closed traverses are established through the access portals using conventional surveying techniques and instrumentation such as total stations.
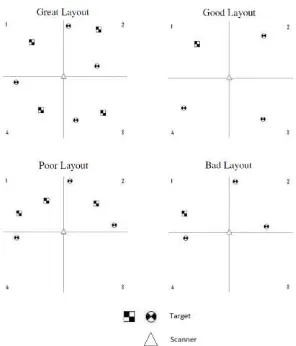
Control points can be the target or the center of the scanner. The setup of the control points is important as it directly influences the accuracy of the registration. The best way to control points is to place targets evenly throughout the scan as shown in Figure 1. It is better to have different elevations for each target. Targets should be placed at the recommended optimal distance from the scanner according to the scanner’s manual. There International Archives of the Photogrammetry, Remote Sensing and Spatial Information Sciences,
should be at least one target in each quadrant. The scanner’s maximum range and accuracy may limit effective scan coverage.
Figure 1. Target setup layout
A flat target can be stuck on a surface as shown in Figure 2a, a spherical target shown in Figure 2b and a tilt-and-turn planar target shown in Figure 2c can be mounted to a tripod. Different laser scanning targets are designed for different specific distances; they should be scanned within the distance in order to get enough density to pinpoint their centers for registration purposes. A good target should have enough point cloud coverage and the center of the target should be clear as shown in Figure 3a. If the distance from the scanner to the target exceeds the manufacturer’s recommended distance, it is hard to pinpoint the center of the target as shown in Figure 3b increasing error.
a. Sticky Figure 2. Different types of targets
Figure 3. Different distanced between scanner and target
Capture of point cloud data
For documenting as-built conditions, the density of point clouds needs to be high enough to produce CAD drawings, a 3D mesh model, and panoramic point cloud pictures. A high resolution scanner is needed in underground construction such as tunnel projects. Also, given the tough and confined environment of a
tunnel project, it is preferable to use a fast-time scanning equipment. A phase-based scanner is recommended for the documentation of a tunnel construction.
The scanning geometry plays an important role in the quality of the resulting point cloud. Depending on the purpose of the project and the type of scanner available, the scanner should be set up to have enough coverage in the given environment to achieve high accuracy in the point cloud data. Due to the conditions in a construction environment, an ideal setup is not always possible. The location of each scan depends on the field situation, but should have as much unobstructed coverage as possible.
Processing of the point cloud data
Registration is the process of integrating several scans into a single coordinate system. The registration process performs optimal alignment transformations to make sure that the targets used as constraints are aligned as closely as possible. After registration, the coordinates of all point cloud data are the same as the control system. A full 3D mesh model is created to offer a better visualization of the as-built tunnel as well as sets of panoramic point cloud pictures.
Mapping the panoramic point cloud pictures on the web-based service.
A panoramic image of the point cloud data is created for web-based sharing and viewing. To be distinguished from the panoramic image, the point clouds have accurate location information that can be measured, marked, and hot linked for sharing with different project participants. The as-built information has great value for the client and can be stored for future use. Each scan generates a set of panoramic point cloud pictures. The location information is stored in an XML file. By extracting the information in the XML files from each scan, the sets of pictures can be mapped to an online map service, such as Google Map. In this case, point clouds can be accessed anytime easily without limitation. The final deliverable is URL containing a single Google map with sets of panoramic point cloud pictures on it. If the data are considered to be sensitive and should not be available to the general public, invitation codes can be created for specific users.
4. CASE STUDY
The Chicago Transit Authority's (CTA) Red Line is Chicago's busiest rail line with an average weekday ridership exceeding 250,000. It's a vital artery of the city, and runs 24 hours a day, 365 days a year—ideally. Chicago's Dynasty Group were the project's lead surveyors, and conducted the project with the most sophisticated corridor survey in the Authority's history, a massive logistical effort that ultimately included traditional, , laser, and ground penetrating radar surveys of the entire route, plus a geo-referenced video. This study is based on the portion of this project that documents and visualizes the tunnel portion of the CTA Red Line.
Pre-scanning phase.
The CTA Red Line tunnel stretches from the south portal (around 18th St. and S Wentworth Ave.) to the north portal (close to the Armitage Station) with a total length about 4 miles as shown in Figure 4.
International Archives of the Photogrammetry, Remote Sensing and Spatial Information Sciences,
Figure 4. CTA Red line tunnel
It contains two tracks going north and south. The tunnel passes through downtown Chicago and under the Chicago River with a variety of geotechnical characteristics. Because the Red Line runs 24 hours a day, as-built documentation presented a big challenge. In order to minimize the noise created in the data by the passing trains, scans were performed during the night when traffic is low. In addition, flaggers helped to stop the train while scanning. To have maximum coverage of the tunnel, 500 scans were performed in a period of two months. Ground surface networks were defined and stretched out to provide control in the tunnel. Only tilt and turn targets were used in the tunnel environment. The targets were set up on tripods (as shown in Figure 5a) or attached to the steel columns on platforms using a magnetic clip (as shown in Figure 5b).
a. Target on tripod b. Target attached to column Figure 5. Location of targets
Capture of point cloud data
The Leica HDS 6200 scanner was selected to perform the scans in the tunnel. This system is a phase based scanner offering the fastest scan rates (up to 1 million points per second) for high-accuracy in built surveys. It is especially suitable for the as-built tunnel documentation because it operates in a very short time window for capturing high density, high definition point cloud data to avoid the occlusions caused by the passing trains. The scanner was typically located at the edge of the tunnel or on a platform, to have maximum coverage of the tunnel as shown in Figure 6.
Figure 6. Location of the scanner
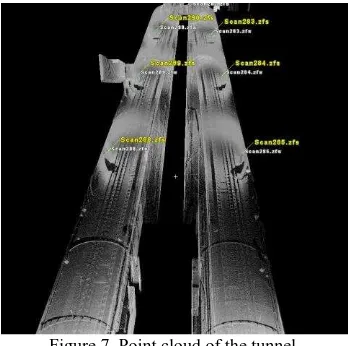
In order to acquire the most accurate results from the scanner, the regular interval in between the two scans was set up to be less than 20 m to have at most 5 mm accuracy. A super high resolution was selected to give roughly 7 minutes per scan. More than 500 scans were performed during the two-month period to cover the entire tunnel as shown in Figure 7.
Figure 7. Point cloud of the tunnel
Processing of the laser scan point cloud
After performing a 3D laser scan, the raw point cloud data need to be processed. Cyclone was selected as the software to process point cloud data because it is a software developed by Leica, the manufacturer of the laser scanner used in the study, hence avoiding compatibility problems in between the software and the equipment, and avoiding the cost of purchasing a new software since Cyclone comes with the Leica laser scanner.
Cyclone supports the use of targets to geo-reference scan data, as well as the ability to align overlapping areas of point clouds. More than five hundreds scans were registered together in the State Plane coordinate system to generate one complete model space to perform survey documentation as shown in Figure 8a, to establish a 3D mesh model as shown in Figure 8b, and to create hundred sets of panoramic point cloud pictures.
a. Survey documentation b. 3D model Figure 8. Documentation of the tunnel International Archives of the Photogrammetry, Remote Sensing and Spatial Information Sciences,
Using uGridd to map Truview to Google Map.
One of the products created by point cloud data is called “Truview”. Truview is a set of panoramic pictures composed of point cloud data. The engineer can extract real 3D coordinates and accurately measure distances from the pictures. Also, hotlink and markups can be created and shared with other people for better communications as shown in Figure 9.
Figure 9. Panoramic point cloud picture
The problems in this project were that (1) sections of the tunnel looked very similar to each other, and (2) there were no references to help to locate an object through the entire five mile length of the tunnel. It was difficult and time consuming to reference the as-built data to the right location. This problem was solved by geo-referencing the as-built data to a web mapping system.
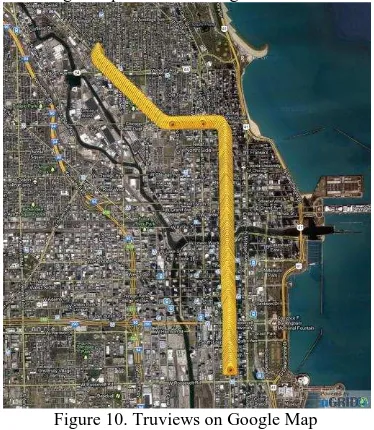
uGRIDD is a web-based service provider that offers geo-referencing of infrastructure data. One of uGRIDD’s functions called “Truview2Map” was used in this research to geo-reference hundreds of truviews to Google map. By extracting the information in the XML file in the truview folder and projecting it to the State Plane coordinate system and to the WGS 84 coordinate system, the location of each truview was located on Google map as shown in Figure 10.
Figure 10. Truviews on Google Map
Each triangle represents a scan setup. When one clicks on a yellow triangle, detailed information, such as scan name,
scanner model, number of point cloud, and scan date show up in a bubble as shown in Figure 11.
Figure 11. Truview’s information
Some data may be sensitive and perhaps should not be available to the public. For security reasons, detailed information about the CTA tunnels should not be published without any restrictions. Invitation codes were created to secure the information. Only authorized persons who have been issued invitation codes could view the information. The final product was a simple URL that could be opened and shared with other authorized project participants.
5. CONCLUSION
This paper presented a new method to improve the documentation and visualization of an urban metro tunnel. The method of using laser scanning technology to collect high definition point cloud data to document an as-built tunnel has been thoroughly described. Sets of panoramic pictures called truviews were generated by laser scanning that allows for taking measurements and extracting 3D coordinates. With uGridd’s help, truviews were geo-referenced to Google Map for better visualization. The combination of laser scanning technology and Google Map to produce a precise and accurate 3D mapping of the as-built tunnel makes the information more transparent, faster, and easier to reach compared to conventional surveying methods.
ACKNOWLEDGEMENT
This research would not have been possible without the guidance, assistance, and funding provided by the Dynasty Group, Inc. and the uGRIDD Corporation, both located in Chicago, IL.
REFERENCE
Akinci, B., et al. (2006). “A formalism for utilization of sensor systems and integrated project models for active construction quality control.” Automation in Construction, 15(2), 124–138.
Alba, M., Fregonese, L., Prandi, F., Scaioni, M., and Valgoi, P. (2006). “Structural monitoring of a large dam by terrestrial laser scanning.” Proc. ISPRS Commission V Symp., ISPRS, Dresden, Germany.
Bosché, F., Haas, C. T., and Akinci, B. (2009). “Performance of a new approach for automated 3D project performance tracking.” Journal of Computing in Civil Engineering, Special Issue on 3D Visualization, 23, 311-318.
International Archives of the Photogrammetry, Remote Sensing and Spatial Information Sciences,
California Department of Transportation (2011). Terrestrial laser scanning specifications.
Chen, Z., 2012 “Who Should Perform As-Built Surveys?”, http://geodatapoint.com/articles/view/who_should_perform_as_ built_surveys
Chen, Z., 2012 “Why It’s Time to Consider Product-Based Surveying”
http://geodatapoint.com/articles/view/why_its_time_to_consider _product_based_surveying
Fei Dai, Abbas Rashidi, Ioannis Brilakis and Patricio Vela (2012). “Comparison of Image- and Time-of-Flight-Based Technologies for 3D Reconstruction of Infrastructure”, Construction Research Congress 2012: Construction Challenges in a Flat World.
Kabashi, I.; Retscher, G. (2009) “Guidance and Steering of Construction Machines in Tunnelling”. In Proceedings of Optical 3-D Measurement Techniques IX, Vienna, Austria, 1–3 July 2009.
Lam, S.Y.W. (2010) “ Recent Advances of Engineering Survey Operations for Tunnel Construction in Hong Kong”. In Proceedings of the FIG Congress 2010, Sydney, Australia, 11– 16, April 2010.
Su, Y. Y., Hashash, Y. M. A., and Liu, L. Y. (2006). “Integration of construction as-built data via laser scanning with geotechnical monitoring of urban excavation.” Journal of Construction Engineering and Management, 132(12), 1234-1242.
Tang, P., Akinci, B., and Huber, D. (2009) “Quantification of Edge Loss of Laser Scanned Data at Spatial Discontinuities.” Automation in Construction, 18(8), 1070-1083
Vassilis Gikas. (2012) “Three-Dimensional laser scanning for geometry documentation and construction management of highway tunnels during excavation”, Sensors 2012, 12, 11249-11270;
International Archives of the Photogrammetry, Remote Sensing and Spatial Information Sciences,