KEY WORDS:3D Reconstruction, UAV Images, Semantic Segmentation, Automated Measuring, Clearance Distance, Inspection
ABSTRACT:
Power line corridor inspection is a time consuming task that is performed mostly manually. As the development of UAVs made huge progress in recent years, and photogrammetric computer vision systems became well established, it is time to further automate inspection tasks. In this paper we present an automated processing pipeline to inspect vegetation undercuts of power line corridors. For this, the area of inspection is reconstructed, geo-referenced, semantically segmented and inter class distance measurements are calculated. The presented pipeline performs an automated selection of the proper 3D reconstruction method for on the one hand wiry (power line), and on the other hand solid objects (surrounding). The automated selection is realized by performing pixel-wise semantic segmentation of the input images using a Fully Convolutional Neural Network. Due to the geo-referenced semantic 3D reconstructions a documentation of areas where maintenance work has to be performed is inherently included in the distance measurements and can be extracted easily. We evaluate the influence of the semantic segmentation according to the 3D reconstruction and show that the automated semantic separation in wiry and dense objects of the 3D reconstruction routine improves the quality of the vegetation undercut inspection. We show the generalization of the semantic segmentation to datasets acquired using different acquisition routines and to varied seasons in time.
1. INTRODUCTION
Power line corridors have to be inspected on a regular basis ac-cording to vegetation growing too close to the power line. In industry this inspection task is known as vegetation undercut de-tection or clearance distance inspection. Up to now these inspec-tions are done manually. On the one hand a person is walking by the power line corridor and estimates the distances between vege-tation and power line. This leads to coarse results and most of the time hardly traceable documentation. On the other hand these in-spections can be done using aerial images acquired using manned systems. Acquisition hardware of aerial images typically has very high resolution. The restrictions on minimum flight height and thus having large distance to the scene, aerial images result in ground sampling distances (GSD), like for the UltraCamEagle Mark21, of 27 mm at a flight height of 1000 m. But the usage of aerial images is quite expensive as there is an enormous de-mand of resources. Compared to aerial images, images taken by an Unmanned Aerial Vehicles (UAV) also provide high GSD be-cause of the close distance UAVs can be operated to the scene. Next to nadir views as delivered by aerial images it is easily pos-sible to add slightly slanted views using UAVs which improves the reconstruct-ability of power lines and the side views of the surroundings (vegetation). Due to the development of UAVs in recent years we are now able to acquire high quality UAV images at low cost. The diversity in design of UAVs provides the ability to hover and perform very precise maneuvers at close distance to an object using multi-rotor UAVs, or survey large areas using fixed-wing UAVs.
Nowadays UAV images are used for different purposes: 3D re-construction, inspection and measuring. There are commercial products available for 3D reconstruction like Pix4D2 or Agisoft
1
http://www.vexcel-imaging.com/products/ultracam-eagle
2
https://pix4d.com/
PhotoScan3. A similar system is the one by (Tscharf et al., 2015). They present a fully automated approach to generate precise, met-ric and geo-accurate 3D reconstructions using UAV images and terrestrial ones. High resolution UAV imagery is also used in (J´o´zk´ow et al., 2015) to model the geometry of transmission lines in 3D. Their experiment showed that having properly acquired images and using a dense matching algorithm provides similar results as using LiDAR acquired point clouds. It is convenient to use UAVs as investigation tool to acquire images for inspection tasks of otherwise hard to reach positions. One example is the inspection of roofs according to the thermal insulation. This was presented by (Zhang et al., 2015) where they propose automatic thermal anomaly detection in 2D, based on thermal images ac-quired using UAVs. A further application UAVs are used for is the inspection of wetlands according to the vegetation growing there. In (Marcaccio et al., 2015) they demonstrate the usability of UAV imagery for classifying the wetland vegetation at differ-ent seasons to be able to map the seasonal changes in habitat.
The previously mentioned publications do either 3D reconstruc-tion or inspecreconstruc-tion or measuring. But we present an approach that does combine these tasks. We want to perform analysis. In addi-tion to pure 3D reconstrucaddi-tion we relate objects present in the 3D reconstruction to each other to measure interpretable distances. Therefore, we first perform semantic segmentation and recon-struct the scene. The quality of reconrecon-struction is enhanced as we interpret the object to be reconstructed according to the seman-tics and automatically select a proper reconstruction routine. By transferring the semantics to the scene we gain the ability to not only perform 3D measurements, but are able to interpret them. Our approach is demonstrated on the task of inspecting power line corridors according to vegetation undercuts.
3
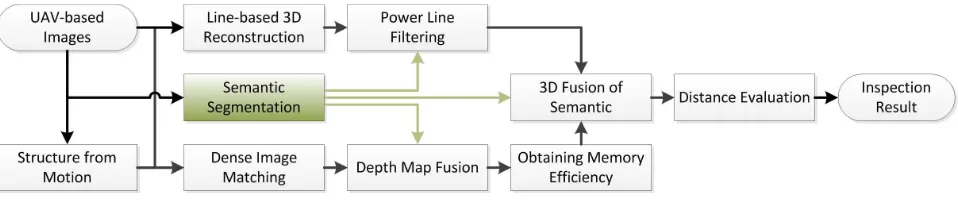
Figure 1. Overview of the automated vegetation undercut inspection pipeline: Based on UAV-based images we automatically reconstruct the area, add semantics to the 3D model and finally measure distances between power lines and trees. The core part of the
framework, the semantic segmentation, enables to interpret the object to be reconstructed according to the semantics and to automatically select the proper reconstruction routine. This means we will reconstruct the surrounding with semantically filtered
power lines using a dense approach and the power lines using the line-based approach.
2. PIPELINE
In this section we describe our highly automated pipeline to get semantically labeled 3D reconstructions containing a dense rep-resentation of the environment and preserving wiry objects like power lines. This semantically labeled 3D reconstruction is fur-ther simplified for the reason of efficiently performing inspection tasks within semantic classes. The pipeline is depicted in Figure 1 and consists of the following main parts:
• Geo-referenced Structure-from-Motion and Line-based Re-construction
• Semantic Segmentation
• Dense Image Matching
• Depth Map Fusion with Semantic Filtering
• Obtaining Memory Efficiency
• 3D Fusion of Semantics
• Distance Evaluation
2.1 Geo-referenced Structure-from-Motion and Line-based Reconstruction
The task of a Structure-from-Motion (SfM) pipeline is to recon-struct 3D points and simultaneously calculate the camera poses according to the reconstructed sparse point cloud. The presented approach is highly automated and is capable to deal with un-ordered, non-sequential image sets. In our pipeline we follow (Irschara et al., 2012) to get the sparse point cloud with ori-ented cameras. We assume pre-calibrated input images and we achieve this by exploiting the method of (Daftry et al., 2013). The first step of the SfM pipeline is the extraction of features. As features, Scale-invariant Feature Transform (SIFT) presented by Lowe (Lowe, 2004) is used, as they are robust against illu-mination, rotation and view point changes. Next the extracted features are matched to create inter image correspondences. This process is speeded up by using a vocabulary tree matching (Nis-ter and Stewenius, 2006). Using the corresponding features be-tween image pairs the relative motion bebe-tween these two cameras is estimated and geometrically verified using a robust version to the five-point algorithm (Nist´er, 2004). Based on an initial im-age pair, further imim-ages are added using the three-point algorithm (Haralick et al., 1991). The SfM is finalized by simultaneously
refining the 3D points (also called sparse point cloud) and the camera poses by a bundle adjustment step (Triggs et al., 2000).
As we aim to use the reconstruction for inspection tasks, it is im-portant to know the reconstruction’s absolute position and orien-tation in a specific geographic context. This can be done by geo-referencing. We apply the approach of (Rumpler et al., 2014). There, the metric scale and the pose of the reconstruction are de-termined robustly by exploiting the GPS coordinates acquired to-gether with the images.
According to the task of power line corridor inspection, the sparse point cloud does not provide enough information about the power line itself. Therefore, we add line features to the sparse point cloud. We follow (Hofer et al., 2016) and based on pre-aligned cameras we detect 2D line segments and match them in 3D using geometric constraints. The matching hypotheses are then verified using a multi-view approach and result in an accurate 3D recon-struction of wiry and line-based structures.
2.2 Semantic Segmentation
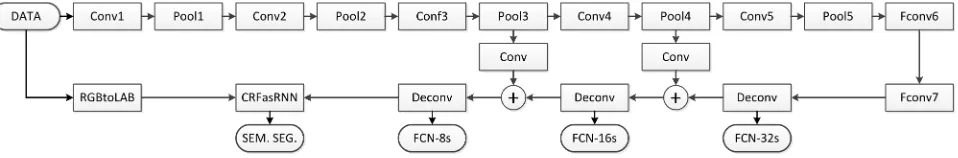
The semantic segmentation is a core element of our reconstruc-tion approach as it influences the individual parts of the 3D re-construction and adds the ability to analyze the final reconstruc-tion automatically (see Figure 1). Therefore, we require pixel-wise semantically labeled images. We follow the approach of (Long et al., 2014) and use a Fully Convolutional Neural Network (FCN) to get pixel-wise segmentations. The network presented in (Long et al., 2014) is adjusted to represent the number of out-puts required for our task. As we are dealing with wiry objects in our input images, and thus the receptive field of the FCN of 32 px is too big, we extend the network by adding a Conditional Random Field represented as Recurrent Neural Network (CRFas-RNN) as presented in (Zheng et al., 2015). The Conditional Ran-dom Field exploits the probabilities of the FCN and refines them by taking binary constraints into account. This enhances label changes being aligned with intensity changes (edges) in the im-age. To further improve the results of the CRFasRNN we added an RGBtoLAB conversion to the input images of the CRFasRNN part of the network. The final network structure is depicted in Figure 2.
2.3 Dense Image Matching
Figure 2. Schematic overview of the Neural Network: The network consists of (fully) convolutional, pooling and deconvolutional layers. Further, the option of early exit exists, which results in coarse semantic segmentations (FCN-XXs). The pixel accurate segmentation (SEM. SEG.) is attained by adding an RGB to LAB color space conversion (RGBtoLAB) and a conditional random field
represented as recurrent neural network (CRFasRNN).
First a discrete optimization problem is solved to get rough depth measurements. As this discrete optimization problem is con-strained to a maximum of 128 depth steps and we are dealing with rectified stereo pairs of different baselines, we added an au-tomatic adjustment of the step size to maximally exploit the depth range of the scene. This is done, by taking the SfM reconstruction into account. The step size is adjusted to represent the distance between the minimum and maximum depth of the sparse point cloud visible in the corresponding stereo pair within 100 depth steps. Finally, the coarse result of the discrete optimization is re-fined solving a continuous optimization problem exploiting the same cost function as in the discrete optimization problem.
2.4 Depth Map Fusion with Semantic Filtering
Based on the individual depth maps, we want to generate a dense 3D reconstruction. As it is known that wiry objects are not well represented in depth maps according to the regularization con-straint of preserving smooth surfaces, power lines are not suited to be reconstructed using this approach. Thus, the depth maps are filtered according to the semantic segmentation. Before this filtering can be applied, the depth maps have to be transformed from the coordinate system of the rectified camera to the coor-dinate system of the original camera of the SfM. The required transformations have been calculated while rectification.
For the depth map fusion we use the approach presented by (K¨ahler et al., 2015). This approach is highly optimized for real time processing on a GPU. They model the world using a volu-metrically represented signed distance function and perform ray-casting for visualization. We exploit the hashing of (Nießner et al., 2013) to be unconstrained in size of the scene. To be able to use our aligned depth maps, we extended the framework of (K¨ahler et al., 2015) to take camera poses as input for the depth maps positioning and not to perform any tracking.
As a result we get a 3D mesh reconstruction of the surroundings. This means that the model does not contain any power lines.
2.5 Obtaining Memory Efficiency
Due to the high resolution of the dense mesh, the 3D reconstruc-tion requires lots of memory and further processing would be time demanding. Thus, we rasterize the model according to a required resolution into a voxel grid and store the reconstruction in an Octomap (Hornung et al., 2013). To do so, the octree under-lying the Octomap has been extended to store in addition to the occupied voxels the color, the semantic label, its color represen-tation and the distance measurement. The usage of the extended Octomap enables to have a single model representing all visual-ization methods and measurements and thus save the overhead of storing the structure several times.
2.6 3D Fusion of Semantics
The fusion of the semantics to 3D will enrich the 3D reconstruc-tions by semantics. This is required to be able to perform auto-mated inspection or analysis in 3D. To get robust semantics into the 3D reconstruction, as the 2D semantic segmentations may contain classification errors, we perform a histogram based vot-ing. Based on the Octomap resulting from Section 2.5 we deter-mine for each voxel the cameras the voxel is visible in. Then the voxel center is back-projected to these cameras and the resulting image coordinates are used to determine the label of the corre-sponding semantic 2D segmentation. Using histogram based vot-ing the most likely label is determined and added as label to the according voxel in the Octomap.
In addition to semantically labelling the Octomap, the line recon-struction generated in Section 2.1 is filtered according to the la-bel power line, as they have been filtered in the 3D reconstruction previously. The same histogram based voting as for the voxels is applied for each reconstructed line segment.
2.7 Distance Evaluation
The final step in our approach is to add the distance between power lines and trees to the 3D reconstruction of the surround-ings represented as Octomap. As power lines are represented by line segments in our reconstruction, we evaluate the distance in 3D between a point and a line segment. For each voxel centerP labeled as tree we calculate the point to line segment distanced to each line segment labeled as power line and being defined by a starting pointVand an end pointWusing:
f(n) =
The minimum distance is saved in the corresponding voxel in the Octomap.
3. DATA ACQUISITION AND NETWORK INITIALIZATION
3.1 Hardware
When performing power line corridor clearance distance inspec-tion it is likely to use different acquisiinspec-tion platforms constrained by the surrounding area. A multi-rotor will be used in areas where power lines follow steep slopes. The use of a fixed wing UAV would be suited for power line corridors that span over large and flat areas. These constraints to the acquisition platform motivated us to use two different UAVs, a Falcon8 and an eBee to record our test sets.
The Falcon8 has been developed by Ascending Technologies GmbH4. It is an octo-rotor equipped with a Sony NEX-5n com-pact camera and a 24 mm lens. The camera has an image resolu-tion of 16 Mpx. The flight time of the Falcon8 is stated with 15 minutes.
The second UAV, the eBee, has been developed by SenseFly5and is a fixed-wing UAV. It is designed to perform pre-planned reg-ular flight patterns completely autonomous and acquires the im-ages at fixed distance to achieve the required overlap and ground sampling distance. Its flight time is given with 40 minutes and it is able to continue the planned mission after battery swapping. This makes the eBee suitable to survey large areas. The eBee is equipped with a 12 Mpx Canon S110.
Details on the hardware specification of the two UAVs depicted in Figure 3 are summarized in Table 1.
Acquisition Platform Falcon8 eBee
Producer Asctec SenseFly
Type Octo-Rotor Fixed Wing
Flight time [min] 15 40
Camera Sony NEX-5n Canon S110
Table 1. Hardware details of the two UAVs used for data acquisition.
Figure 3. Image acquisition platforms used. The left UAV is the Falcon8 from Ascending Technologies GmbH and the right one
the eBee from SenseFly.
3.2 Dataset Acquisition
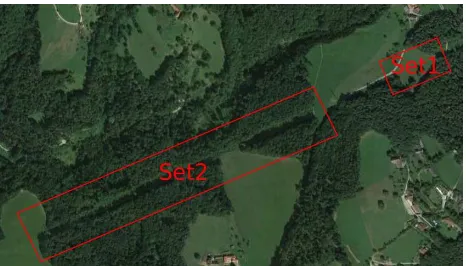
To show the generalization of our presented pipeline we acquired two test sets using the previously described acquisition platforms. In Figure 4 the locations of the two data sets are depicted. The overview image further gives an impression of the dimensions of the areas capable to be acquired using the different UAVs.
Set1 was acquired in summer using the Falcon8. We performed a GPS assisted manual flight along the power line at a flight height of about 40 m above ground which results in a ground sampling distance of 12 mm/px. We recorded 387 images whereas auto-matic triggering of the camera was set to two seconds. A subset of the acquired images is depicted in Figure 5 left.
4
www.asctec.de
5
www.sensefly.com
Figure 4. Overview of the test sets area: Image has been taken from Google Earth.
Set2 was acquired in autumn using the eBee. The eBee was pro-grammed to fly two regular grids above the ground. The first one was set to a distance to ground of 85 m and the second to 100 m. The ground sampling distances are 30 mm/px and 35 mm/px re-spectively. In total 505 images were acquired and a subset is depicted in Figure 5 right.
Details of the acquired test sets are summarized in Table 2.
Figure 5. Comparison of acquired image sets. The differences in resolution (see power pylon) and the changes in season are
visible.
Test Set Name Set1 Set2
Acquisition Platform Falcon8 eBee
Flight Height [m] 40 85-100
Flight Area [m2
] 9,000 44,500
Flight Mode Manual Flight Autonomous Raster
Season Summer Autumn
Number of Images 387 505
Resolution 4912×3264 4000×3000
Table 2. Acquisition details of the test sets
3.3 Training the Semantic Segmentation Network
Tree dark green Street light gray
Grass light green Clutter magenta
Field light brown Power Line cyan
Table 3. Semantic classes and the according color coding.
Network FCN-32s FCN-16s FCN-8s CRF
Learning Rate 1e-10 1e-12 1e-14 1e-14
Policy fixed fixed fixed fixed
Momentum 0.99 0.99 0.99 0.99
Weight Decay 0.0005 0.0005 0.0005 0.0005 Iterations 160,000 160,000 160,000 160,000
Table 4. Summary of the parameters used for the individual training stages.
4. RESULTS
In this section we present the results of our automated power line corridor inspection task according to vegetation undercut detec-tion. First, we give results of the semantic segmentation, followed by intermediate results of the 3D reconstruction pipeline and fi-nally the semantically enriched 3D reconstruction including color coded distance measurements between trees and power line.
4.1 Semantic Segmentation Results
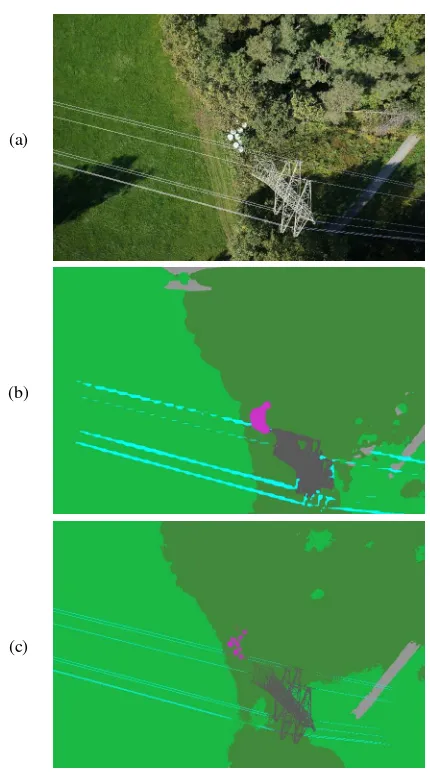
As presented in Section 2.2 we first generate 2D semantic seg-mentations of the input images as semantics is required for the 3D reconstruction routine. An example RGB image (Figure 6a) is visualized next to the final semantic segmented image (Fig-ure 6c). To highlight the benefit of the CRFasRNN we addition-ally show the intermediate result of the FCN 8s (Figure 6b). It is clearly visible that the pairwise potentials of the CRF improve the boundaries of the objects, especially power lines, and the detailed structure of the pylon is segmented accurately.
4.2 Semantic 3D Reconstruction Results
Before we are showing the semantically enriched 3D reconstruc-tion we depict the sparse reconstrucreconstruc-tions (Figure 7 and 8). In addition to the point cloud the reconstructed camera poses are vi-sualized, to give an impression of the acquisition pattern. It is clearly visible, that grass is reconstructed in detail, and power lines, pylon and trees are almost missing. Thus, just a sparse re-construction is not suited for our distance measuring task.
To enrich the reconstruction according to power lines, we use the line-based reconstruction approach of (Hofer et al., 2016) and ex-ploit the previously aligned cameras of the sparse reconstruction. The line-based reconstruction is depicted in top- and side-view in Figure 9. Filtering the reconstructed lines according to their semantics, we are able to reconstruct just power lines.
6
http://dl.caffe.berkeleyvision.org/pascalcontext-fcn32s-heavy.caffemodel
(b)
(c)
Figure 6. Example semantic segmentation result of a test image of Set1: On the top there is the reference RGB image, in the middle the intermediate result of the FCN and on the last row the
final result including the CRFasRNN.
Figure 7. Sparse reconstruction result of Set1 showing the sparse point cloud and the camera poses.
An accurate reconstruction of trees is still missing. Therefore, we exploit our dense reconstruction pipeline described in Section 2.3 and 2.4. As a result we achieve a dense 3D reconstruction of the surrounding without wiry structures (power lines) as depicted in Figure 10.
recon-Figure 8. Sparse reconstruction result of Set2 showing the sparse point cloud and the camera poses.
Figure 9. Reconstructed lines of Set1 depicted from top- and side-view: It can be seen, that the power lines as well as the
pylon are reconstructed accurately.
Figure 10. Dense reconstruction of Set1: It can be seen, that the vegetation is reconstructed accurately and the semantically
filtered power lines are not reconstructed.
struction we get the final representation of the fully automated vegetation undercut detection as depicted in Figure 11 and 12. Due to the rasterization of the reconstruction of Set1 in voxels of 50 cm we gain a memory reduction by a factor of 85.
5. EVALUATION
In this section we will confirm the decisions we made while set-ting up the automated semantic 3D reconstruction pipeline for vegetation undercut detection.
Figure 11. Color coded 3D result of Set2: The objects are color coded by their semantics according to Table 3. The dense reconstruction has been rasterized using a voxel size of 2 m.
Figure 12. Color coded 3D result of Set1: The objects are color coded by their semantics according to Table 3. In addition the distance of trees to power line is color coded from red to dark
green and truncated at a distance of 10 m.
5.1 Reconstruct-ability of Vegetation
Figure 13. Comparison of 3D reconstruction methods. The left image shows a semi dense point cloud created using PMVS. It is
clearly visible that the local region growing approach does not give good results for vegetation. On the right our dense 3D reconstruction pipeline provides detailed reconstruction for vegetation and thus enables further inspection tasks. Note that
the power lines are not reconstructed due to the semantic filtering of the depth maps.
5.2 Influence of Semantic on 3D Reconstruction
In this experiment we are going to investigate the influence of the semantic filtering on depth maps. To be able to measure dis-tances we require an accurate reconstruction. As we are dealing with dense reconstructions, we get a measurement for each pixel and due to the regularization constraint of smooth surfaces big discontinuities in depth are problematic. These discontinuities occur in the area of power lines as they are wiry objects and rep-resented by just a few pixels (4-8 px) in the images. Figure 14 depicts such an erroneous depth map that is not able to represent the big disparity discontinuity in the vicinity of power lines. As we are dealing with a multi view reconstruction approach the area beneath the power line is depicted in different views without the disturbance and thus enables us to mask them out. This is done automatically by taking the semantic segmentation into account and masking the segmented power lines and a close area around them in the depth maps (see Figure 14 right). The fusion of the depth maps will lead to accurate 3D reconstructions whereas the power lines are not included any more. A comparison of a 3D reconstruction with and without filtering of the semantically seg-mented power lines in the depth maps is depicted in Figure 15. It is clearly visible that the filtering of power lines removes recon-struction artefacts like spikes growing toward the power line. If these artefacts are too big they would cause false alarms in the inspection task.
Figure 14. Generated depth maps: The left image shows the reference input image, the middle one the erroneous depth map that contains wrong depth measurements in the vicinity of power
lines and the right one the filtered depth map used for fusion.
5.3 Generalization of Semantic Segmentation
Pixel-wise annotation of training data is a time consuming task, thus it is important that the semantic segmentation approach gen-eralizes to different acquisition methods.
Figure 15. Comparison of 3D reconstruction: The left image shows the reconstruction without filtering the power lines and the right image the reconstruction with filtered power lines. It is
clearly visible that filtering the power lines removes reconstruction artifacts like spikes toward the power line
(marked by red ellipses).
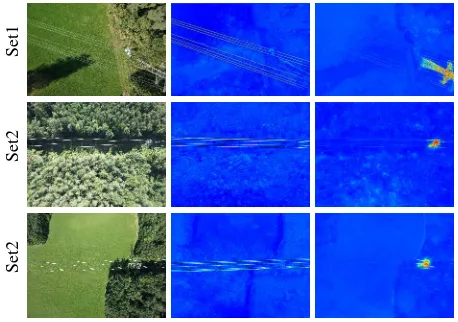
To show the generalization of the semantic segmentation we ac-quired two data sets as presented in Section 3.2. Images taken from Set1 are used to train the semantic segmentation network. The trained network is then deployed on Set2. Compared to Set2, Set1 contains high resolution imagery at close distance to the power line acquired in summer. Whereas Set2 was captured in autumn using a lower resolution camera (see Figure 5 and Ta-ble 2). To demonstrate the generalization we show probability maps of the most challenging classes, power line and pylon and the reference RGB images for easy interpretation of the probabil-ity maps. Figure 16 shows in the first row the probabilprobabil-ity maps for an example taken form Set 1. The following rows give ex-amples of Set2. As the probability maps of Set2 result in similar probability values for the same objects it is shown that the se-mantic segmentation generalizes to similar scenes even acquired using different hardware and time consuming labelling, retraining or fine-tuning of the network is not required.
Set1
Set2
Set2
Figure 16. Generalization of semantic segmentation: The first row shows an example of a test image taken from Set1 where the
network has been trained on. The further rows show test images from Set2. From left to right we start with the reference RGB
image, the probability image for the class power line and the probability image for the class pylon. The warmer the color in the probability images the more likely the pixel belongs to that class. It can be seen that the probability distributions are similar
6. CONCLUSION
In this paper we presented an automated pipeline to inspect veg-etation undercuts of power line corridors which automatically results in a GPS-based documentation of undercut occurrences. The presented pipeline performs an automated selection of the 3D reconstruction method for wiry (power line) and solid objects (surrounding) using semantic segmentation based on Fully Con-volutional Neural Networks. Further, an octree based data sim-plification routine enables to perform the inspection task and any further post-processing efficiently. Exploiting the semantically enriched 3D reconstruction an automated inspection of the vege-tation undercuts of power line corridors is performed. Due to the geo-referenced semantic 3D reconstructions a documentation of areas where maintenance work has to be performed is automati-cally included in the measurements and can be extracted easily. We evaluated the influence of the semantic segmentation accord-ing to the 3D reconstruction and showed that the automated se-mantic separation in wiry and dense objects of the 3D reconstruc-tion routine improved the quality of the vegetareconstruc-tion undercut in-spection. We showed that the semantic segmentation generalizes to datasets acquired using different acquisition routines and to varied seasons in time. As we described a general reconstruction and semantic segmentation approach the presented work-flow can be easily transferred to other inspection or measurement tasks.
ACKNOWLEDGEMENTS
This work has been supported by the Austrian Research Promo-tion Agency (FFG) project FreeLine (Bridge1/843450) and OMI-CRON electronics GmbH.
REFERENCES
Daftry, S., Maurer, M., Wendel, A. and Bischof, H., 2013. Flex-ible and user-centric camera calibration using planar fiducial markers. In: Proceedings of the British Machine Vision Con-ference, BMVA Press.
Furukawa, Y. and Ponce, J., 2010. Accurate, dense, and robust multiview stereopsis.IEEE Transactions on Pattern Analysis and Machine Intelligence32(8), pp. 1362–1376.
Haralick, R. M., Lee, D., Ottenburg, K. and Nolle, M., 1991. Analysis and solutions of the three point perspective pose es-timation problem. In: Proceedings. 1991 IEEE Computer So-ciety Conference on Computer Vision and Pattern Recognition, pp. 592–598.
Hofer, M., Maurer, M. and Bischof, H., 2016. Efficient 3d scene abstraction using line segments.Computer Vision and Image Un-derstanding.
Hornung, A., Wurm, K. M., Bennewitz, M., Stachniss, C. and Burgard, W., 2013. Octomap: an efficient probabilistic 3d map-ping framework based on octrees. Autonomous Robots34(3), pp. 189–206.
Irschara, A., Rumpler, M., Meixner, P., Pock, T. and Bischof, H., 2012. Efficient and Globally Optimal Multi View Dense Match-ing for Aerial Images.ISPRS Annals of Photogrammetry, Remote Sensing and Spatial Information Sciencespp. 227–232.
J´o´zk´ow, G., Vander Jagt, B. and Toth, C., 2015. Experiments with uas for automatic modeling of power line 3d geometry. ISPRS -International Archives of the Photogrammetry, Remote Sensing and Spatial Information SciencesXL-1/W4, pp. 403–409.
K¨ahler, O., Prisacariu, V. A., Ren, C. Y., Sun, X., Torr, P. H. S. and Murray, D. W., 2015. Very High Frame Rate Volumetric In-tegration of Depth Images on Mobile Device.IEEE Transactions on Visualization and Computer Graphics (Proceedings Interna-tional Symposium on Mixed and Augmented Reality 2015.
Long, J., Shelhamer, E. and Darrell, T., 2014. Fully Con-volutional Networks for Semantic Segmentation. arXiv Prepr. arXiv1411.4038.
Lowe, D. G., 2004. Distinctive image features from scale-invariant keypoints.Int. J. Comput. Vision60(2), pp. 91–110.
Marcaccio, J. V., Markle, C. E. and Chow-Fraser, P., 2015. Unmanned aerial vehicles produce high-resolution, seasonally-relevant imagery for classifying wetland vegetation. ISPRS - In-ternational Archives of the Photogrammetry, Remote Sensing and Spatial Information SciencesXL-1/W4, pp. 249–256.
Nießner, M., Zollh¨ofer, M., Izadi, S. and Stamminger, M., 2013. Real-time 3d reconstruction at scale using voxel hashing. ACM Transactions on Graphics (TOG).
Nist´er, D., 2004. An efficient solution to the five-point relative pose problem. IEEE Trans. Pattern Anal. Mach. Intell.26(6), pp. 756–777.
Nister, D. and Stewenius, H., 2006. Scalable recognition with a vocabulary tree. In:Proceedings of the 2006 IEEE Computer Society Conference on Computer Vision and Pattern Recognition -Volume 2, CVPR ’06, IEEE Computer Society, Washington, DC, USA, pp. 2161–2168.
Rumpler, M., Daftry, S., Tscharf, A., Prettenthaler, R., Hoppe, C., Mayer, G. and Bischof, H., 2014. Automated end-to-end work-flow for precise and geo-accurate reconstructions using fiducial markers. ISPRS Annals of the Photogrammetry, Remote Sensing and Spatial Information Sciences2(3), pp. 135.
Shekhovtsov, A., Reinbacher, C., Graber, G. and Pock, T., 2016. Solving Dense Image Matching in Real-Time using Discrete-Continuous Optimization.arXiv Prepr. arXiv1601.06274.
Shelhamer, E., Long, J. and Darrell, T., 2017. Fully convolutional networks for semantic segmentation. IEEE Transactions on Pat-tern Analysis and Machine Intelligence39(4), pp. 640–651.
Triggs, B., McLauchlan, P. F., Hartley, R. I. and Fitzgibbon, A. W., 2000. Bundle adjustment - a modern synthesis. In: Pro-ceedings of the International Workshop on Vision Algorithms: Theory and Practice, ICCV ’99, Springer-Verlag, London, UK, UK, pp. 298–372.
Tscharf, A., Rumpler, M., Fraundorfer, F., Mayer, G. and Bischof, H., 2015. On the use of uavs in mining and archae-ology - geo-accurate 3d reconstructions using various platforms and terrestrial views. In:International Conference on Unmanned Aerial Vehicles in Geomatics, Vol. II-1/number W1, ISPRS An-nals, pp. 15–22.
Zhang, J., Jung, J., Sohn, G. and Cohen, M., 2015. Thermal infrared inspection of roof insulation using unmanned aerial ve-hicles. ISPRS - International Archives of the Photogramme-try, Remote Sensing and Spatial Information SciencesXL-1/W4, pp. 381–386.