FUSION OF OPTICAL DATA AND SAR DATA FOR THE ESTIMATION OF NITROGEN
CONCENTRATION IN PEARL RIVER ESTUARY HONG KONG SEAS, CHINA
Xiangnan Liu*, Meiling Liu, Ling Wu
School of Information Engineering, China University of Geosciences, 100083 Beijing, China [email protected], [email protected], [email protected]
KEY WORDS:
Total inorganic nitrogen, RADARSAT-2, HJ-1 CCD image, backscattering coefficient, optical parameters, polarization parameters
ABSTRACT:
The knowledge of nitrogen concentration in the ocean is fundamental for the study of oceanic biogeochemical processes. The objective of this research is to estimate total inorganic nitrogen (TIN) by integrating optical parameters from HJ-1 CCD image and polarization parameters from RADARSAT-2 quad-polarization image. The situ data and HJ-1 CCD, RADARSAT-2 image were acquired from Pearl River Estuary Hong Kong Seas, China in August, 2010. The four sensitive parameters, reflectance of Band 4, NDSI (Normalized Difference Spectral Index), the backscattering coefficient of HV and VH were derived as input variables to assess the TIN. A multiple regression model was established between four input variables and TIN. The result showed that the fusion of optical data and SAR data was proved to be successful in estimating TIN in sea surface, with the correlation coefficient (R2) between measured TIN and predicated TIN of 0.774, and the root mean square error (RMSE) of 0.063. The optical data in combination with SAR data is promising for detecting biochemical component in sea surface.
1. INTRODUCTION
The knowledge of temporal and spatial variations of nitrate concentrations at global or regional scales in the ocean is needed to quantify the role of nitrates in oceanic biogeochemical processes, and in particular those linked to new primary production (Kamykowski et al., 2003, 2005). Many attempts have been made to estimate nitrate concentrations using satellite data. Some researchers applied satellite data to estimate nitrate concentrations in sea according to temperature–nitrate relationships based on matching vertical profiles of sea surface temperatures (SST) and nitrate concentrations (Traganza et al., 1983; Dugdale et al., 1989). In order to increase the accuracy of estimation nitrate concentrations, other researchers derived inverse relationships between nitrate concentrations and chlorophyll-a concentration, SST by introducing chlorophyll-a concentration as an additional input to empirical algorithms (Goes et al.,1999,2000; Silio-Calzada et al.,2008). However, the empirical algorithms derived from the chlorophyll-a, SST were limited to restricted periods and areas, due to varying hydrodynamics and biogeochemical characteristics condition.
In this paper, we proposed a new approach for the estimation of nitrate concentrations in sea surface, by deriving the sensitive remotely sensed parameters from optical image and SAR image.
2. STUDY AREA AND MATERIAL
2.1 Study Area
The study area (22°18'08″N, 114°03'30″E) is located in the east of the Pearl River Estuary (PRE), China, which is well-developed economical district and has many industrial
operations, which polluted the coastal areas. The site has a warm and humid subtropical climate, the Pearl River flows through large catchment areas into the PRE and finally reaches the South China Sea, which is the largest marginal sea on the western boundary of the Pacific Ocean.
2.2 Image data
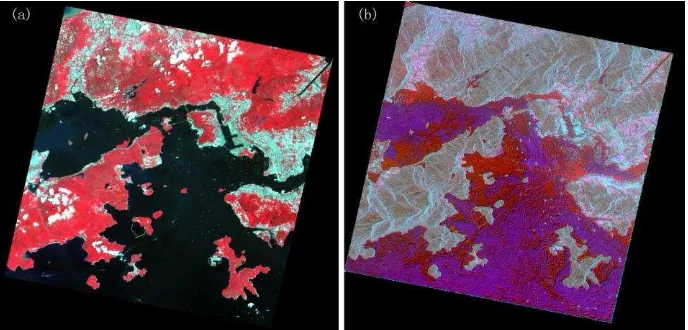
A scene of HJ-1 CCD image was acquired on 4 August 2010 (Figure1(a)).HJ-1 satellite equipped with a CCD camera and hyperspectral imager (HSI) or infrared camera (IRS), which was successfully launched on at 11:25 on September 6, 2008,China to monitor environment and disaster. The HJ-1 CCD image has a four spectral band (Band1: 0.43-0.52μm, Band2:0.52-0.60μm, Band3:0.63-0.69μm, Band4: 0.76-0.90μm) with a 30m×30m spatial resolution. The two identical CCD cameras in the HJ-1-A satellite and HJ-1-B satellite can image the ground swath width of 700 km. Revisit cycle is two days. The preprocessing of HJ-1CCD imagery includes atmospheric correction and geometric correction.
In this study, a scene of fine quad-polarization RADARSAT-2 image covering the study area was acquired over the study area on 22:28, 1 August 2010 from China Remote Sensing Satellite Ground Station (Figure1 (b). Band beam is Q19, spatial resolution is 12m×8 m, incidence angle is about 22° .The image has been preprocessed to product level of SGX and output to GeoTIFF data format. The Next European Space Agency (ESA) SAR Toolbox (NEST) was used for further data processing, including radiance calibration, geocorrection, coregistration, multlooking and speckle reduction. For speckle reduction, the multitemporal speckle filter was adopted, and the filter window size was set 3 × 3.Overview of RADARSAT-2 image and HJ-1 CCD image are displayed in Table1.
Figure 1. HJ-1 CCD and Radarsat-2 image of study area, (a) HJ-1 CCD (RGB normalization false color composition), (b) Radarsat-2(PauliRGB composition)
Data source Acquisition data Spatial data(m) Signal characteristic Other notation HJ-1 CCD 2010-08-04 30×30 spectral reflectance four band number RADARSAT-2 2010-08-01 12×8 backscattering coefficient fine quad-polarization
Table 1. Overview of RADARSAT-2 image and HJ-1 CCD image
2.3 Situ measured data
Coincident with the image, sea surface measurement data, including TIN and ocean surface condition (i.e., wind speed, wind direction, wave height and wave direction) were collected from Environmental Protection Department, the government of the Hong Kong Special Administrative Region (http://sc.epd.gov.hk).
3. METHOD
3.1 Selection of input variables
In order to improve the accuracy of estimating TIN, the input variables which were relative sensitive to TIN were selected. To ascertain the sensitivity of the spectral parameters and polarization parameters to TIN in the study area, a series quadratic fit model were conducted from TIN value with spectral parameters and polarization parameters. In general, for polarization parameters, our results showed that HV has a
strong non-linear relationship with TIN, the correlation coefficient (R2) being 0.54; VH correlate positively to TIN, R2 with 0.36 (Figure 2).
For spectral parameters, Normalized Difference Spectral Index (NDSI) was proposed and computed by
4 1 4 1
(
) / (
)
NDSI
R
R
R
R
(1)Where
R
4 andR
1 are reflectance of 1 stband and reflectance of 4th band for HJ-1 CCD image. Our results indicated that single band, namely, reflectance of Band 4 was positively correlated with TIN, R2 of 0.35; NDSI has correlation with TIN, R2 with 0.32 (Figure 2).
In sum, VH, HV, Band 4 and NDSI were selected as the input variables of model for estimating TIN in sea surface.
Figure 2. Relationship between different optical parameters, polarization parameters and TIN
3.2 Fusion of RADARSAT-2 image and HJ-1 CCD image In order to accurately estimate the TIN in continuous sea surface on a large scale, the fusion of RADARSAT-2 image and HJ-1 CCD image was adopted. In this study, the RADARSAT-2 image in the study area was converted into 30 × 30 m grids by nearest neighbor algorithm to keep consistency with HJ-1 CCD image in the spatial resolution. The operation was conducted using a routine written in MATLAB in combination with ENVI 4.8. Two types of image data sources were corrected to WGS-84 (World Geodetic System 1984) Geographic datum and Geographic Lat/Lon projection system.
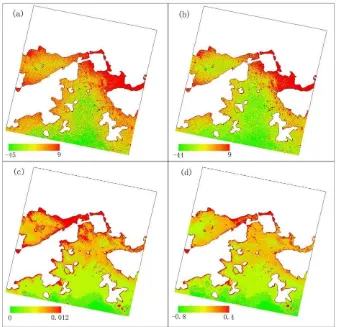
3.3 Spatial distribution of input variables from image Sea surface backscattering coefficients were converted to 30 × 30 m grids for RADARSAT-2 images. Figure 3 shows the distribution VH, HV, Band4 and NDSI input variables in the same spatial resolution. From Figure3, the backscattering coefficient of HV ranged from −45 to 9 dB, whereas VH ranged from −44 to 9 dB. HV and VH had the similar range, and the former had a little higher range than the latter. Band4 reflectance had a low value with ranging from 0 to 0.012, while NDSI ranged from -0.8 to 0.4. Detail statistics of four input variables were calculated in Table 2.
Figure 3. Distribution of four input variables in the same spatial resolution (a) HV, (b) VH, (c) Band4, (d) NDSI
Input variables Min Max Mean Stdev
HV -44.08 7.98 -32.62 4.72
VH -43.86 8.07 -32.53 4.71
Band4 0 0.012 0.0011 0.0008
NDSI -0.79 0.36 -0.66 0.092
Table 2. Statistics of input variables in study area
3.4 Establishment of model
A series of HJ-1 CCD reflectance and SAR backscattering coefficient were chose in the study area, in addition, they kept the same geographical coordinates of situ measured TIN data. The statistical model was created to establish the relationship between the above four input parameters and TIN. Of all statistical models, multiple regression analyses method was
most popular (Singh et al., 2009). Regression analysis is widely used for predicting and forecasting, and it is also used to understand which among the independent variables are related to the dependent variable. Therefore, in this study, multiple regression analysis was used to establish the relationship between four input parameters and TIN.
3.5 Evaluation of model’s performance
Quite a few criteria have been defined in the literature to evaluate the performance of a model (Wang and Elhag, 2007). These criteria include the sum of squared error (SSE), mean square error (MSE), mean absolute error (MAE), root mean squared error (RMSE), absolute percentage error (APE), root mean square percentage error (RMSPE), correlation coefficient (R2), and so on. Among of them, RMSE, APE and R2 are the most widely used performance evaluation criteria and will be used in this study. They are defined as follows:
measured value, average measured value and average predicated value, respectively, n is the sample number.4. RESULTS
4.1 TIN inversion model
According to situ measured TIN data and matched four input parameters, a multiple regression model was established. Namely,
1 2 3 4
y = 0.685 -0.004x +0.018x +1.930x +0.137x
(5)
Where
y
is TIN,x
1,x
2,x
3,x
4are VH,HV,Band4 and NDSI, respectively. The summary statistics for the above models of TIN (at the 95% confidence level) are as following: R2=0.774, F-value=20.48, constant,x
1,x
2,x
3andx
4of T-value are 5.74,1.12,4.37,1.40 and 2.22, respectively. In addition, According to the above three parameters for assessing the performance of model, RMSE=0.063, APE=8.651%, it indicated that the model had relative low RMSE, APE and high R2 value.4.2 Spatial distribution of TIN
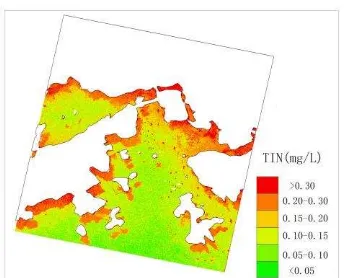
According to the above multiple regression model based on situ measured data, the model established was applied to calculate TIN of area covered by two images in the sea. Figure 4 shows the spatial distribution of TIN in sea surface of study area. As seen in Figure 4, TIN of sea ranged from 0 to 0.30. The majority of study area had a low value of TIN with ranging from 0.05 to 0.10. However, the area adjoining to land had a high value of TIN above 0.20. It inferred that the area was nearly influenced by land matter. It still agrees well with the actual distribution of TIN in sea.
Based on the above analysis, the multiple regression model for predicting TIN in sea surface performed well. It confirmed that the fusion of optical data and SAR data was effective.
Figure 4. Distribution of TIN in sea surface of study area
5. CONCLUSION
RADARSAT-2 quad-polarization image and HJ-1 CCD image have been used to estimate TIN of sea surface. Based on the situ measured data, four parameters were selected as sensitive factors. Moreover, the multiple regression model, which interprets the variation of TIN as a function of sensitive factors. According to the models and correlation analysis, the results can be summarized in three points:
1) Band4 reflectance and NDSI are relative sensitive to TIN of sea surface with R2 above 0.3.
2) Compared with HH and VV, VH and HV has a better correlation with the change of TIN of sea surface, implying the advantages of cross-polarization radar backscatter in sea biochemistry monitoring.
3) Fusion of optical data and SAR data can improve the accuracy for estimating TIN in sea surface. It is because different image data sources can get more subtle information for oceanic biochemistry from different view.
REFERENCES
Dugdale, R. C., Morel, A., Bricaud, A., Wilkerson, F. P., 1989. Modeling new production in upwelling centers - a case-study of modeling new production from remotely sensed temperature and color. Journal of Geophysical Research-Oceans, 94(C12), pp. 18119-18132.
Goes, J. I., Saino, T., Oaku, H., Ishizaka, J., Wong, C. S., Nojiri, Y., 2000. Basin scale estimates of sea surface nitrate and new production from remotely sensed sea surface temperature and chlorophyll. Geophysical Research Letters, 27(9), pp. 1263-1266.
Goes, J. I., Saino, T., Oaku, H., Jiang, D. L., 1999. A method for estimating sea surface nitrate concentrations from remotely sensed SST and chlorophyll a - A case study for the north Pacific Ocean using OCTS ADEOS data. IEEE Transactions on Geoscience and Remote Sensing, 37(3), pp. 1633-1644.
Kamykowski, D., Zentara, S. J., 2003. Can phytoplankton community structure be inferred from satellite-derived sea surface temperature anomalies calculated relative to nitrate depletion temperatures. Remote Sensing of Environment, 86(4), pp. 444-457.
Kamykowski, D., Zentara, S. J., 2006. Changes in world ocean nitrate availability through the 20th century (vol 52, pg 1719, 2005). Deep-Sea Research Part I-Oceanographic Research Papers, 53(9), pp. 1578-1579.
Silio-Calzada, A., Bricaud, A., Gentili, B., 2008. Estimates of sea surface nitrate concentrations from sea surface temperature
and chlorophyll concentration in upwelling areas: A case study for the Benguela system. Remote Sensing of Environment, 112(6), pp. 3173-3180.
Singh, K. P., Basant, A., Malik, A., Jain, G., 2009. Artificial neural network modeling of the river water quality-A case study. Ecological Modelling, 220(6), pp. 888-895.
Traganza, E. D., Silva, V. M., Austin, D. M., Hanson, W. L., Bronsink, S. H., 1983. Nutrient mapping and recurrence of coastal upwelling centers by satellite remote sensing: Its implication to primary production and the sediment record. In: E. Suess and J. Thiede(Eds.), Coastal Upwelling: Its Sediment Record, Plenum Press, New York, USA, Part A, pp.61-83.
Wang, Y.-M., Elhag, T. M. S., 2007. A comparison of neural network, evidential reasoning and multiple regression analysis in modelling bridge risks. Expert Systems with Applications, 32(2), pp. 336-348.
ACKNOWLEDGEMENTS
This research was supported by the National Natural Science Foundation of China (No. U0933005). The authors wish to thank the anonymous reviewers for their constructive comments that helped improve the scholarly quality of the paper.