REPRESENTATION AND RECONCONSTRUCTION OF
KEY WORDS: TIN, Point cloud, reconstruction, 3d data representation
ABSTRACT:
Point clouds obtained by aerial laser scanning are a convenient input source for high resolution 2.5d elevation models, such as the Dutch AHN-2. More challenging is the fully automatic reconstruction of 3d city models. An actual demand for a combined 2.5d terrain and 3d city model for an urban hydrology application led to the design of an extension to the well-known Delaunay triangulated irregular networks (TINs) as to accommodate vertical walls. In addition we introduce methods to generate and refine models adhering to our data structure. These are based on combining two approaches: a representation of the TIN using stars of vertices and triangles, together with segmenting the TIN on the basis of coplanarity of adjacent triangles. The approach is supposed to deliver the complete model including walls at the correct locations, without relying on additional map data, as these often lack completeness, actuality and accuracy, and moreover most of the time do not account for parts facades not going down to street level. However, automatic detection of height discontinuities to obtain the exact location of the walls is currently still under solution, on the other hand, imposes additional requirements on data acquisition and causes additional complexity, and may yet be not optimal for spatial analysis.
One of the most efficient ways of 3d acquisition methods is aerial laser scanning (LIDAR). For full 3d city models additional terrestrial acquisition is needed. Moreover, creating 3d city models from point clouds produced by laser scanning is a complex task, which is still not fully automated, despite extensive research (Oude Elberink 2008). For some applications, however, a full 3d model is not needed.
An example of such an application is the HydroCity project currently undertaken in the Netherlands, which aims at hydrological modelling in urban environments to identify flood risk. The main input sources are 2d large scale topography, 2.5d surface and elevation data from aerial laser scanning, and spatial information concerning the sewage system. Buildings clearly have a large influence on urban hydrology and the relevant features, such as roofs and walls, should be accurately represented. Several aspects of the hydrological model are executed on the basis of raster data at different resolutions.
In the current paper we extend the TIN data structure, capable of representing 2.5d information about terrain elevation and building roofs, with the possibility to include vertical walls. Several data structures with capabilities between 2.5d and 3d have been proposed previously, e.g. already in 1996 by Pilouk at several levels. When looking at the intended functionality, the proposal by Gröger and Plümer (2003) comes close to our needs. They map 3d geometry in a 2d topological structure, about which theoretical argumentation about correctness can be set up. This seems, however, to be the purpose of the paper; more work is required in order to provide a practical method. Tso et. al (2005) present a model based on the Quad-Edge data structure on which they implement Euler Operators. Their purpose, as well as the approach being based on TIN, is quite comparable to ours, and it will be interesting to actually perform the comparison. Our intention, however, is to use somewhat larger subsets of the data at a time: alternatingly we will use stars, consisting of a point and all its neighbours, and segments consisting of multiple adjacent triangles, which may make our method not as strictly data-driven as Tso’s.
TIN segmentation is applied, grouping adjacent triangles into planar segments where appropriate (Gorte, 2002), whereby also the boundaries between segments become available. Refinement operators are introduced to recursively remove redundant points, and to update boundaries at plane intersections (for example between roof planes). Automatic detection of height discontinuities (for example between the roof and the ground) is currently under implementation.
2. TIN WITH VERTICAL WALLS
The model to be used in the HydroCity project was termed HydroTIN. The basis was the requirement to perform run-off modelling over the terrain surface, taking surface attributes into account that have an influence on hydrodynamic roughness and on infiltration capacity, which is not elaborated further in this paper. The run-off model itself runs on a raster data set, but in order to be able to support different modelling scales easily, which requires the availability of varying raster resolutions, it was decided to have a detailed vector database, from which rasters at different resolutions can be generated on the fly as needed. The vector database will make updating the model easier too.
In addition to the terrain, also buildings and other man-made structures are to be modelled, which is especially important in the urban setting of HydroCity. The option to use (flat-roofed) extrusion models for buildings has been seriously considered, as at most buildings precipitation is directly drained to the sewage system. The roof shape of those buildings does not influence hydrology. On the other hand, small buildings, such as sheds, are often not connected to the sewage system, whereas very large buildings (or blocks of connected houses) may be connected to the sewage at multiple places. In both cases, roof shape may have some influence on the subsequent modelling of both run-off and sewage system.
Furthermore, even with flat-roofed extrusion models we would have had to make a combination with the 2.5 D terrain, which is structured as a TIN. Therefore, we attempted to combine the 2.5d capability of TIN with vertical walls of extrusion, while extending the triangulation to include roof shapes. The approach can, therefore, be considered an extension of TIN in the sense that some points can have multiple heights (conceptually); and as an extension of extrusion models in the sense that 2d polygons are not attributed a single height, but a set of plane parameters a, b and c (as in z = ax + by + c), instead. This is accomplished by subdividing the footprint of a building according to the segments that make up its roof structure: each roof plane is a 2d polygon with 3d roof parameters. A polygon, therefore, usually consists of several triangles.
A boundary between 2d polygons is either a 3d intersection between the two planes or a height discontinuity: a vertical wall. The latter automatically occurs when the two planes do not intersect at the boundary. It is implicitly assumed that a vertex, which is part of a boundary, plays a role in the triangulation at either side of the boundary. In that way it is certain that non-vertical breaklines in walls will never occur.
Note that the height(s) of a vertex, which may participate in one, two or even more roof planes, is/are not stored with the vertex. The vertex only has x,y coordinates; the z coordinate (in each plane) follows from the plane parameters. Therefore, each 2d vertex is stored only once.
Figure 1 shows a building model in the resulting structure. The same building is shown in Figure 2, where also the triangulation is visualized. Note that the non-vertical lines at the walls are added by the rendering software (VRMLVIEW) when switching on the wireframe.
Fig. 1. Simple building as a TIN with vertical walls.
Fig. 2. Roof and terrain triangles are explicit parts of the model, as are vertical lines connecting positions at different heights of a point. Slanted lines at walls are not part of the model, but are
added by the rendering software.
3. RECONSTRUCTION FROM POINT CLOUD DATA
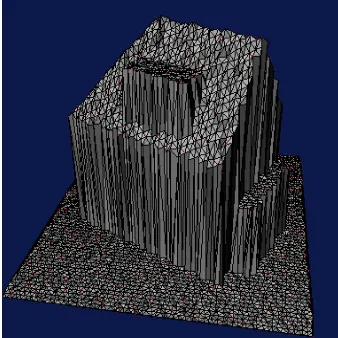
The input for our method is a point cloud, which may be directly obtained by aerial laser scanning, or may originate from a standard product, such as the AHN-2 dataset (Actual Height model of the Netherlands). In the example shown here a simulated dataset is shown, which we use to be able to test sensitivity to noise, point density etc. We will use a density of 40 points/m2. To the simulated (x,y,z) points random noise was added with a standard deviation of 3 cm in x, y and z (Fig. 4). The output of the triangulation is shown in Figure 5.
Fig. 4. Simulated input data.
3.1 TIN simplification
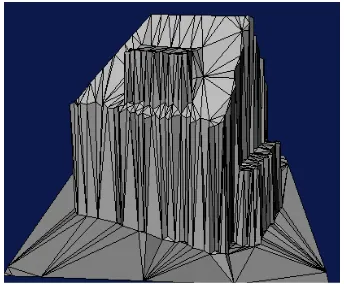
The first step of the proposed method is restructuring the data into stars. For each vertex of the TIN the set of all surrounding (directly connected) vertices is computed, ordered (anti- clockwise) and stored with that vertex. This makes operations on neighbourhoods of vertices highly efficient. Alternatively it is possible to use stars of triangles (all triangles in which the vertex participates). As triangles, in turn, store vertex numbers, it is still possible to obtain surrounding vertices efficiently; moreover we will be able to obtain surrounding segments of each vertex, which we need later.
Fig. 5. TIN of the points of Figure 4.
At the current stage we use the stars to find out which vertices are co-planar (within a tolerance that relates to the expected noise level) with all their neighbours; such a vertex is removed, the “empty star” (a polygon) is re-triangulated internally, and the vertices in the star (the neighbours of the now-removed vertex) are updated accordingly. Each time this happens, the number of vertices is reduced by one, and the number of triangles by two. It is important that this process is done iteratively. When removing all the tolerantly coplanar points at once, we might completely flatten a smoothly undulating landscape. Therefore, during an iteration we remove vertices in the order of decreasing “flatness”, and when removing a vertex, we prevent all its neighbours from being removed in that iteration. Therefore, at most one third of the vertices is removed in one iteration, even in a very flat area (and one third of the remaining two thirds in the next, etc.).
3.2 TIN Segmentation
After this initial TIN simplification, TIN segmentation recursively groups coplanar triangles into segments, and segments into larger segments. To test two adjacent segments a and b for coplanarity we consider a distance d(a,b), which is the maximum of d(ab) and d(ba), where d(ab) is the maximum of all vertical distances between points of a and the plane fitted to the points of b (Gorte, 2002, Geibel and Stilla 2000).
During segmentation the triangles are assigned a segment identifier. A list of segments is created where the plane parameters are stored, together with some statistics, such as the number of vertices and triangles per segment. Also boundaries between segments are stored, from which polygons surrounding segments can be derived. If the triangles in which a vertex participates do not all belong to one segment, the vertex may have different heights in each of these segments (according to the plane parameters). However, for the time being the height differences “within” a 2d vertex are small, as segment pairs with large height jumps between them are still separated by “steep” triangles (see Fig. 6). These should later be collapsed into the vertical walls of the TIN.
3.3 Segment intersections
After segmentation we use the stars together with segmentation results to remove vertices that are entirely surrounded by triangles belonging to the same segment.
More importantly we can now use the stars containing segmented triangles to identify vertices that are on the boundary between exactly two non-wall (i.e. not steep) segments. We compute the perpendicular projection of the vertex onto the 3d intersection line of the two planes. If the x,y coordinates of the projected point are inside the polygon of the star, we shift the vertex to that point.
Figure 7 shows the result of both simplification (no more vertices within the roof planes) and roof plane intersection (they became straight, including the intersection above the dormer). Furthermore, sequences of vertices that got projected on a single intersection line can now be removed: The star is split along the intersection line, the two halves are internally re-triangulated separately (Fig. 8). During the operation the neighbouring vertices are updated while taking the segment numbers into account. The result is shown in Figure 9, whereas Figure 10 shows the result after filtering out the steep (wall) segments.
Fig. 7. Further simplification based on segmentation.
Fig. 8. Removal of vertices from intersection lines.
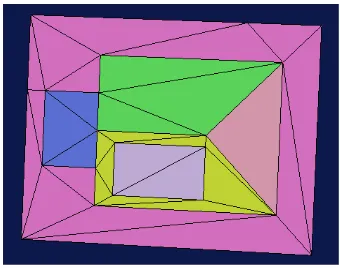
Fig. 9. Updated segmentation after removal of vertices at intersection.
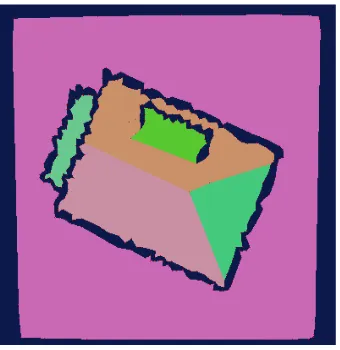
Fig. 10. Selection of roof and terrain.
4. CONCLUSION
Fig 11. Orthoganal view on current result, indicating height jump locations.
We could escape from these last efforts by using walls from building footprints, as found in 2d maps. This is a common approach (Vosselman and Dijkman 2001, Oude Elberink 2008). Yet, we are postponing the decision to do so, because such maps are (sometimes) not available, often not complete (e.g. sheds and other small buildings, buildings not visible from the public road), sometimes not of the right date (older or newer than the point cloud), and not usually not as precise as the sub-decimetre precision of nowadays aerial laser scanners.
Moreover, also the best map will not contain all required “wall” elements. An example is the dormer in Fig. 11, but there are also more prominent ones found, such as facades of high-rise building above lower building extensions. Any method able to reconstruct these should also be able to find building outlines that happen to be present in a map, although it is acknowleged that hints concerning the locations may be obtained from footprints by segmenting them (Suveg and Vosselman, 2004).
References
Geibel, R. and U. Stilla, Segmentation of laser altimetry data for building reconstruction: different procedures and comparison, IAPRS 33, B3, 2003, pp. 326-334.
Gorte, B.G.H., Segmentation of tin-structured surface models, Joint Conference on Geo-spatial theory, Processing and Applications, Ottawa, Canada, 8 - 12 July 2002
Gröger, G., & Plümer, L. (2003). Exploiting 2D Concepts to Achieve Consistency in 3D GIS Applications. In E. Hoel & P. Rigaux (Eds.), Proc. of the 11th International Symposium on Advances in Geographic In-formation Systems (ACM-GIS’03) (pp. 78–85). New Orleans, Louisiana: ACM Press
Oude Elberink, S., Acquisition of 3d Topography: Automated 3d Road and Building reconstruction Using Airborne Laser Scanner Data and Topographic maps. PhD
thesis, ITC, The Netherlands 2008.
Pilouk, M., Integrated modelling for 3D GIS. PhD thesis, ITC, The Netherlands, 1996.
Shewchuk, J. R., Delaunay Renement Mesh Generation. PhD thesis, School of Computer Science, Carnegie Mellon University, Pittsburg, USA, 1997.
Tse, R.O.C., M. Dakowicz, C. M. Gold, and D. Kidner. Building reconstruction using LIDAR data. In Proceedings 4th ISPRS Workshop on Dynamic and Multi-dimensional GIS, pages 156-161, Pontypridd,Wales, UK, 2005.
Suveg, I. and Vosselman, G., 2004. Reconstruction of 3D building models from aerial images and maps. ISPRS Journal of Photogrammetry & Remote Sensing, 58(3–4):pp. 202–224. Vosselman, G. and S. Dijkman, 2001. 3D building model reconstruction from point clouds and ground plans. In