PUBLIC ATTITUDES TOWARD
THE POLICE
Paul Jesilow
University of California IrvineJ’ona Meyer
New Mexico State UniversityNazi Namazzi
The 1992 urban uprising in Los Angeles following the acquittals of officers who had beaten a suspect underscored the fact that the police maintain order only with the consent of the public. When citizens no longer view as legitimate the law and its agents, control can only be achieved by an armed military presence, and by then it is too late to prevent extensive personal, property, and social damage. These facts are not wasted on leaders, both those within the immediately effected communities and those who will eventually feel the sting of the political and economic aftermath. Efforts by the criminal justice system to maintain its publicly granted legitimacy are, therefore, imperative.
Most of the attention with respect to public attitudes about system agents has focused on the police, for the most part because major U.S. riots during the last 30 years have all been sparked by police action. But, public attitudes toward the police are also studied because patrol officers are citizens’ most constant contact with the legal system and its most visible representatives. Moreover, police are the system’s primary agents to detect and solve crimes, and people antagonistic to the police are unlikely to aid officers in curbing crime, even when they themselves are the victims (The President’s Commission on Law Enforcement and Administration of Justice, 1967; Decker, 1981; Hahn, 1971).
Administration of Justice, 1967). Generally, these studies reported results indicating widespread satisfaction with the police (The President’s Commission on Law Enforcement and Administration of Justice, 1967). But, non-whites were notably less enthusiastic about law enforcement than were the majority populous. In a national survey:
non-whites [gave] a rating of “very good” only half as often as whites and [gave] a “not so good” rating twice as often. These differences [were] not merely a function of greater poverty among non-whites; They [existed] at all income levels and for both men and women (The President’s Commission on Law Enforcement and Administration of Justice, 1967).
More recent studies have reached similar conclusions (Bayley and Mendelsohn, 1969:40; Campbell and Schuman, 1972; Furstenberg and Wellford, 1973; Hadar and Snortum, 1974; Albrecht and Green, 1977:75; Peak, Bradshaw and Glensor, 1992:35).
Usually researchers have asked subjects to respond to statements such as “the police do a good job.” Possible responses range from “strongly agree” to “strongly disagree.” We were not satisfied with the results obtained from such methods. They provide little information about the bases for such attitudes, and worse, no information as to what actions police departments should take to improve their images.
We decided to take a more direct route to learn the citizens’ attitudes. Our interviews with a stratified random sample of 538 Santa Ana residents were open ended. We wanted them to tell us what they thought was important. We did collect some demographic information on our respondents: age, sex, education, ethnicity, occupation, type of residence, economic status of the neighborhood, years at address, number of encounters with the police in the last year, and the type of police encounter. But, we specifically wanted to know what they liked best and least about their neighborhoods; if they had been active in trying to improve their neighborhoods (and if yes, how); and what they liked best and least about the police.
HISTORY OF THE PROJECT
In 1990, the Santa Ana Police Department (SAPD) requested that faculty in Criminology, Law and Society at the University of California, Irvine develop an instrument to obtain baseline information from Santa Ana residents with respect to their opinions about their neighborhoods and their attitudes toward police. Following discussions between the research team and SAPD district commanders, an interview schedule was devised to be administered to Santa Ana residents.
Site
Santa Ana is a 27.2 square mile metropolitan area consisting of over 315,000 people. Within the state, only San Francisco has a greater population density. Santa Ana is the seat of Orange County, California. It has public libraries, numerous churches and schools, major shopping centers, and a downtown section. Santa Ana is located nine miles from the ocean, 33 miles south of Los Angeles, and 93 miles north of San Diego. In 1990, the median price of housing was $160,000 (U.S. Bureau of Census, 1990). The city consists of 55 percent owners and 45 percent renters. The median years of education is 12.4 and the percentage of college graduates is 16.7 percent. Per capita income is $12,535 and the household income is $35,713. According to the 1990 census, the city’s population grew more than 40 percent in 10 years. Its population contains about 65 percent Hispanic, 23 percent anglo, nine percent Asian and two percent black.
METHODOLOGY
Subjects
The 538 household sample was obtained using a list of grids covering streets that the Santa Ana Police Department patrols on a regular basis. Streets were randomly selected from each grid, then one to three dwellings (depending on the number of dwellings on the block) were systematically selected from each street.
without telephone numbers. Many citizens have unlisted phone numbers and some individuals cannot afford phones. Phone calls were made during work hours, while the face to face interviews were conducted during evening hours and on weekends. This schedule was followed to achieve a more balanced sample of the residents.
The Haines Directory, which lists phone numbers (unless they are unlisted) by address, was used to obtain a phone number for each selected dwelling. If no one answered at the selected dwelling, the next listed dwelling was chosen. For the face to face interviews, each selected area was systematically sampled. Only dwellings without listed phone numbers were approached for the face to face interviews. Only one person per household was interviewed.
The telephone interviews were conducted by Santa Ana Police Department Community Service employees trained for the activity and supervised by a member of the UCI research team. They identified themselves to the subjects as researchers associated with the University of California Irvine, in order to help eliminate the possibility that the subjects might give biased answers if interviewed by known police staff members. Interviews were conducted in the spring and summer of 1990. The face to face interviews were conducted by paid UCI student interviewers trained for the activity. Both sets of interviewers included a large number who spoke Spanish and English and several of the face to face interviewers spoke Vietnamese. Subjects were asked to participate in a brief interview about their attitudes toward their neighborhoods and the police. They were advised that their answers would help influence city and police activities.
The subjects tended to be female; the sample (those who were willing to tell us) consisted of 358 women and 173 men. The predominance of women may be related to the fact that the interviews were conducted primarily during daytime hours when women may have been more likely to be at home. Indeed, 116 of the women told us they were homemakers. Additionally, when a man and a woman were both home, the man was likely to defer to the woman to give the answers.
The predominance of women in our sample held for all ethnic groups except Asians in which men outnumbered women. This may well have been due to a cultural difference. Many of the Asians in our sample were immigrants from countries in which male domination is considered severe. Unlike the other ethnic groups, when an Asian man and woman were both present, the man was more likely to answer our questions.
answered because they were more likely to be at home. Twenty-three percent of our sample, for example, said they were retired.
Exactly half of the subjects in our sample told us they were white (n=269); 211 (39%) said they were Hispanic; 27 (5%) said they were Asian; 18 (3%) told us they were black; and three reported that they were native Americans. Ten individuals chose not to provide this information. Comparing this sample to the 1990 census figures indicates that whites were overrepresented and Hispanics and Asians were underrepresented.
Interview Schedule
In addition to the subject’s age, gender, and ethnicity, data were gathered on education, and the type of neighborhood in which the subject lived (working class or residential).1 Moreover, residents were asked
what they liked best and least about where they lived. Concomitantly, subjects were asked if they were actively involved in trying to improve their neighborhoods and, if yes, how. The purposes for these questions were to learn what efforts the subjects were making to improve their local living conditions, and how these efforts might affect their attitudes about their neighborhoods and the police.
The residents were asked what they liked and disliked about the police. It was thought that it is possible for people to hold both positive and negative views about the police. The public has many feelings about the police. As Bayley and Mendelsohn (1969:45) noted:
Policemen, then, are objects both of fear and awe; we expect them to be at the same time servants and masters. The ambiguity at the heart of the police function suggests two points relevant to the study of the police. First, it is naive to think that people have a single attitude toward the police. Attitudes toward the police are dependent upon contacts. There is no point in posing as a single question what the community thinks about the police.
SAPD pinpoint the kinds of activities that were favored by the public and the areas in which the department needed improvement.
Open-ended questions were used in the interviews. Such questions allowed the subjects to answer more clearly and in their own words. The subjects decided what was important to them and what they wanted to say to the interviewer. The use of unstructured answers limited the imposition of predetermined belief structures upon the subjects. Instead of confining answers to what we thought was important, questions were answered according to what was important to the subjects.
Another benefit to asking open-ended questions was the opportunity for interviewers to probe for answers. When subjects gave incomplete, unhelpful, or vague answers, the interviewers asked the subjects to clarify or provide examples to prevent any misinterpretation.
Open-ended questions also allowed our subjects the opportunity to ask questions of the interviewer and to indicate whether or not they had information on the subject area. Structured answers might have produced answers where none existed, due to the subjects choosing an answer when none were applicable or indicating an answer because they felt we desired it. The interviewers were trained to probe in order to clarify unclear responses or to better ascertain the subject’s meaning, but not to extract more answers from the subject when there were none to give.
The use of open-ended questions was not without drawbacks. The freedom for subjects to answer questions in their own words resulted in a large variety of responses. It was difficult to standardize answers; this created difficulties when coding answers for statistical analyses. Subjects also varied on the length of their responses, and interviewers varied in their degree of probing. If answers were long, interviewers may have recorded only those aspects which they considered relevant. This probably introduced some bias into the study.
RESULTS
In order to determine which characteristics were associated with peoples’ attitudes toward the police, we created a variable entitled POSTOT. POSTOT consisted of the total number of positive items a respondent mentioned when asked “What do you like best about the police?” If a subject mentioned nothing positive, he or she received a score of zero. For one item, he or she received a score of one and for two items, a score of two. No respondent mentioned more than two items. Forty-seven percent of the respondents had nothing positive to tell us about the police, thirty-nine percent mentioned one positive item, and fourteen percent mentioned two positive items. Some of the positive items mentioned we coded as: reliable (N=88), great (N=65), good response time (N=56), friendly (N=51), visible (N=29), and helpful (N=22). In addition, seventeen respondents mentioned that the police make them feel protected.
We also created a variable, NEGTOT, which consisted of the total number of negative items mentioned in response to “What do you like least about the police?” 2 Sixty-six percent of the respondents had
nothing negative to say about the police, twenty-five percent mentioned one negative item, and nine percent mentioned two negative items. Some of the negative items mentioned about the police included: overall lack of police (N=69), slow response time (N=55), negative attitude (N=27), and poor ethics (N=12).
Ethnicity
We compared subjects’ ethnicities to their attitudes toward the police. Gamma was computed on this item to determine if it was related to our items measuring attitudes toward the police (POSTOT and NEGTOT). Gamma indicates the proportionate reduction in error in predicting the dependent variable attributable to knowing the independent variable. In addition, polychoric correlations are reported for each association. Polychoric correlations are appropriate for ordinal data, and are interpreted similar to zero order Pearson product-moment R correlations.
In our sample, whites and minorities did not differ in their likelihood of saying negative things about the police. Two-thirds of each group had nothing negative to say about the police, while one-third mentioned at least one negative item.
Positive attitudes toward the police, however, were related to ethnicity. Blacks and whites said more positive items about the police than did Hispanics and Asians (gamma=.26, p<.001; PC=.22, p<.001). Seventy-two percent of the blacks and fifty-seven percent of the whites said at least one positive item, while only forty-six percent of the Hispanics and forty-four percent of the Asians did so.
Gender
Hindelang, Dunn, Aumick and Sutton (1975) reported that women have more positive attitudes toward the police than men. But, Bayley and Mendelsohn (1969:40-42) noted mixed results: minority men in Denver were more critical of police service, but they found no relationship between police attitudes and gender for their overall sample (p. 113). Boggs and Galliher (1975:404), in a comparison of black respondents, noted that males and females did not differ in their ratings of the police. Davis (1990) reached a similar conclusion for his Hispanic and black New York City population.
Males and females in our sample did not differ significantly in positive nor negative attitudes toward the police. One-half of the males and 54 percent of the females had at least one positive thing to say about the police, while slightly more than one-third of the males and females had at least one negative comment.
Mendelsohn, however, we found no measurable differences between the genders by ethnicity in our sample.
Age
Age is a common variable of interest in studies of public attitudes toward the police. Although some studies have found no relationship between age and attitudes toward the police (McCaghy, Allen and Coffey, 1968; Bayley and Mendelsohn, 1969:113), most have reported that older residents were more supportive of police than younger citizens (Walker et al., 1972; Campbell and Schuman, 1972; Smith and Hawkins, 1973; Hadar and Snortum, 1974; Hindelang et al., 1975), and our results replicate this finding. Older citizens in our sample were more likely to say positive things about the police (gamma=.10, p<.05) and less likely to say negative things (gamma=.12, p<.01). By illustration, 57 percent of the respondents 41 years and older (the median age) mentioned something positive about the police compared to 49 percent of the “youngsters”; less than 30 percent of the elders had anything negative to say about the police; 38 percent of their juniors mentioned something negative.
Education
We wished to learn if there was an association between education and attitudes toward the police. Bayley and Mendelsohn (1969) as well as Davis (1990) found no such relationship, but few studies have included education in their analyses.
Length of Residence
We were interested if length of residence at one location might be related to attitudes toward the police. We hypothesized that one reason people may choose to move is that they are not pleased with their police. In this regard, Zevitz and Rettammel (1990:33) noted that “elderly who have resided in their homes for many years tend to be more satisfied with police performance than those who have not.” Our data, however, failed to show an association between attitudes toward the police and length of residence.
Contact with the Police
We believed that public attitudes toward the police might be the result of experiences citizens had with law enforcement personnel. Others have noted such an association (Jacob, 1971; Winfree and Griffiths, 1971; Campbell and Schuman, 1972; Walker et al., 1972; Smith and Hawkins, 1973; Boggs and Galliher, 1975; Parks, 1976). We asked our sample if they had any contact with the police in the past year, and if yes, how many times. We hoped that limiting our inquiry to the previous 12 months would prevent our subjects from telling us about events from the distant past. In addition, this period is short enough to allow easy recall of events. Most people reported little or no contact with the police. Sixty-seven percent of those who responded to this item told us they had not dealt with the police in the time frame. Sixteen percent said they had but one contact with the police, while the remainder reported multiple contacts. Contact with the police was significantly related to attitudes about the police. Those subjects having at least one police contact during the previous year reported more negative (gamma=.36, p<.001; PC=.29, p<.001) and positive (gamma=.20, p<.01; PC=.19, p<.001) items about the police.
Our finding that contacts with the police were associated with both negative and positive comments makes intuitive sense. Those without police contact probably have no first hand experience on which to base a comment while those who have dealt with police may have found, as Bayley and Mendelsohn (1969) suggested, both good and bad things about the experiences.
attitudes (Jacob, 1971; Walker et al., 1972; Parks, 1976; Winfree and Griffiths, 1977). We were more concerned with the conditions under which the contacts took place. Schack and Frank (1978), for example, reported that elderly citizens who had called the police either to report a crime or to request assistance had significantly fewer positive attitudes toward the police. The more contact, the fewer positive attitudes they had. Similarly, Boggs and Galliher (1975) reported that for the previous year individuals who had called the police for service had more negative evaluations, “whereas police-initiated contacts had little impact on their assessments” (p. 402).
Bayley and Mendelsohn (1969:65) also report a relationship between contact and attitudes toward the police. The attitudes of whites were:
unaffected by having made a demand for service. For Negroes, by contrast, contact in a demand situation tends to be associated with more favorable evaluations of police function than among people without such experience.... Having called upon the police for help was also associated, among Negroes, with a more favorable evaluation of the service received from the police in their neighborhood compared with elsewhere and with a more favorable view of the treatment minorities receive at the hands of the police.
Those in our sample who reported police contact were asked to describe the circumstances. Their answers were then assigned to three categories: (1) own criminal act (traffic tickets, for the most part); (2) reporting crime (for example, burglaries); and, (3) requesting service (for example, for loud neighbors). We combined reporting crime and requests for service into one category. We did this because in each instance the public is asking the police for help and because we were not convinced that the public could adequately determine at the time of their requests whether a crime had been committed. Reiss (1971), for example, found that 58 percent of requests for police service involved criminal activity according to the citizens. But from the police perspective, only 17 percent of the incidents involved criminal acts.
aid: the more education, the more likely one was to request law enforcement help (gamma=.30, p<.01; PC=–.01, p>.05).
Ethnicity also was associated with seeking police assistance (phi=.10, p<.05). Whites sought police help more often than did Hispanics or Asians, and more than twice as often than did blacks. This finding is similar to that of Bayley and Mendelsohn (1969:120-121) who noted that minorities felt that getting involved with the police was “just asking for a lot of trouble” much more often than did whites.
We wanted to determine if a request for service was associated with attitudes toward the police. Individuals in our sample who reported that they had made a request for service in the last year but had also been stopped by the police were dropped from the analysis as we were unsure how to classify these individuals (N=6). In general, those in our sample who requested service and/or reported crimes to the police were more likely to report positive and negative items about the police than were those who had not asked for police assistance within the previous 12 months.
Schack and Frank (1978) argued that elderly citizens who had asked for police aid had fewer positive attitudes toward the police. Arcuri (1981:116-117) compared police handling of elderly problems with their handling of domestic disputes – officers see neither as police business. He argued that the elderly have inflated ideas as to what the police can accomplish, probably fueled by television portrayals of policing. These items, he suggested, might cause the elderly to have increased negative attitudes about the police following a call for assistance.
Our data do not support the idea that the elderly may view police service poorly. A call for assistance was associated with more positive and negative comments by both the young and the old (see Table 1).
This finding persisted when we classified the elderly as more than 65 years of age. Our analysis did reveal less differences with respect to attitudes toward the police between the elderly who had and had not requested aid. The elderly may be more set in their opinions, while contact with police may have more of an effect on youth.
Table 1
PERCENTAGE OFRESPONDENTSPROVIDING ATLEASTONEPOSITIVE COMMENT BYREQUESTEDPOLICESERVICEDURING THEPASTYEAR
(BYRESPONDENT’SAGE)
Requested Did Not
Age Aid Request Aid Difference
18-40 62% 43% 19% gamma=.38, p<.001 41-98 66% 56% 10% gamma=.20, p<.05
PERCENTAGE OFRESPONDENTSPROVIDING ATLEASTONENEGATIVE COMMENT BYREQUESTEDPOLICESERVICEDURING THEPASTYEAR
(BYRESPONDENT’SAGE)
Requested Did Not
Age Aid Request Aid Difference
18-40 58% 28% 30% gamma=.58, p<.001 41-98 40% 23% 17% gamma=.35, p<.05
Table 2
PERCENTAGE OFRESPONDENTS PROVIDING ATLEASTONEPOSITIVE COMMENT BYREQUESTEDPOLICESERVICEDURING THEPASTYEAR
(BYMINORITYSTATUS)
Requested Did Not
Ethnicity Aid Request Aid Difference
White 69% 53% 16% gamma=.30, p<.001 Minority 65% 47% 18% gamma=.20, p<.05
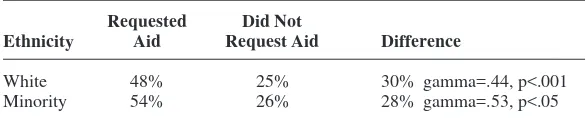
PERCENTAGE OFRESPONDENTS PROVIDING ATLEASTONENEGATIVE COMMENT BYREQUESTEDPOLICESERVICEDURING THEPASTYEAR
(BYMINORITYSTATUS)
Requested Did Not
Ethnicity Aid Request Aid Difference
Minorities and whites in our sample did not differ with respect to their attitudes and calls for assistance. More numerous negative and positive comments were associated with requests for help.We were also interested in the attitudes of people who had been stopped by the police. Decker (1981:83) noted:
that there are several kinds of experiences one can have with police. Perhaps the most important distinction is that between voluntary and involuntary contacts.... Voluntary contacts are hypothesized to lead to positive attitudes because the police are playing a supportive role; involuntary contacts are likely to have an inquisitorial purpose.
Only 26 people in our sample told us they had been ticketed or arrested within the past year. Neither age, ethnicity, nor gender were associated with these police actions.
Johnson, Misner and Brown (1981:185) noted that the police may treat individuals they catch breaking the law differentially. One of the reasons being that the officer and the citizen acknowledge the legitimacy of the arrest ... with a clear-cut violator... when officers do not feel their authority is being challenged, their interactions with citizens [are] more amicable.
But, respondents in our sample who admitted being ticketed or arrested during the previous 12 months provided us, on average, more negative comments about the police than did respondents who had no contact (gamma=.47, p<.05; PC=.32, p<.001). Half had something negative to say compared to 25 percent of individuals who reported no police contact. They did not, however, have fewer positive comments. About half of each group had at least one positive thing to say about the police.
Neighborhood
We believed that having positive things to say about one’s neighborhood was, in part, associated with residence in a residential as opposed to working class area. We used neighborhood type as a proxy for socioeconomic level. Schuman and Gruenberg (1972) report that low-income areas are the most dissatisfied with the police.
Sixty-two percent of our sample living in residential neighborhoods had at least one positive thing to say about the police, compared to 48 percent of those living in other areas. Subjects in residential neighborhoods were more likely to provide positive comments about the police than those living in other neighborhoods (gamma=.29, p<.001; PC=.24, p<.001), and were also less likely to say negative things about the police (gamma=.17, p<.01; PC=-.09, p<.05).
More importantly, we believed that people who live in areas that they perceive of as crime free would have positive things to say about the police, while those who saw their neighborhoods as crime ridden would supply negative comments. Decker (1981:84) in this regard noted:
It is reasonable to assume that citizens who have been victims of crime or live in neighborhoods where the crime rate is high would have less positive perceptions of the police than those in less crime-prone areas.
To measure residents’ positive attitudes about their neighborhoods, we created a variable entitled LIKETOT, which consisted of the total number of police-related items a respondent mentioned when asked “What do you like best about where you live?” Some of the items subjects mentioned about their neighborhoods which were not considered police-related included: quiet (N=206), good neighbors (N=127), convenient (N=100), neighborhood aesthetics (N=67) and home pride (N=35). Positive police-related items included comments which could reasonably be linked with the police, for example, good security (N=12) and low crime (N=10). It was not important to us whether these factors were actually related to police activities. If a subject mentioned no police-related items, he/she received a score of zero, for one police-police-related item, he/she received a score of one. No subject mentioned more than one police-related item. In fact, only 23 subjects reported a positive police related item that they liked about their neighborhoods.
police-related items included those factors which could reasonably be linked with the police, for example, crime (N=79), gangs (N=68), drugs (N=50), and graffiti (N=24). It was not important to us whether the police actually could do something about the problems. If a subject mentioned no negative police-related items, he or she received a score of zero, for one item, he or she received a score of one. If two police-related items were mentioned, he or she received a score of two, and for three police-related items, the subject received a score of three. No respondent mentioned more than three police related items. Some of the items mentioned which were not considered police-related we coded as: lack of neighborhood aesthetics (N=85), too much traffic (N=63), noise (N=39), overcrowded (N=36), and ethnic make-up (N=26).
How people perceived their neighborhoods was strongly associated with negative attitudes toward the police. Those who mentioned negative police-related items about their neighborhoods were more likely to report negative items about the police (gamma=.46, p<.001; PC=.39, p<.001). Positive attitudes toward the police, however, were not associated with LESTOT nor LIKTOT.
Community Associations
Multivariate Analysis
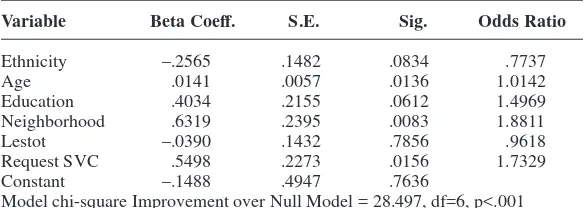
In order to determine which of our variables were most associated with attitudes toward the police we employed logistic regression. Logistic regression allows multiple independent variables to be regressed on a dichotomous dependent variable. Additionally, when the assumption that the dependent variable is normally distributed is violated, logistic regression produces better estimates than would ordinary least squares (OLS) regression. POSTOT and NEGTOT (our measures of public attitudes toward the police) were recoded into dichotomous variables where having said one or more items was recoded as simply having said any items at all (0= no statements, 1= one or more statements). We entered into the equation those independent variables that were associated with attitudes toward the police. These included: ethnicity, age, education, neighborhood type, subjects’ total negative police-related statements about their neighborhoods (LESTOT), and whether or not the subjects had requested police service during the prior year. Because of the few number of subjects involved, we excluded from the analyses our variables indicating participation in a community policing program or a neighborhood association. Results for the equation predicting positive attitudes toward the police are shown in Table 3 and the results for the equation predicting negative attitudes toward the police are reported in Table 4.
Residence in a residential neighborhood was the single best predictor of positive attitudes toward the police; those in residential neighborhoods were almost twice as likely to have mentioned something positive about the police (OR=1.9, p<.01). Age of respondent also was
Table 3
ETHNICITY, AGE, EDUCATION, NEIGHBORHOODTYPE, SUBJECTS’ TOTALNEGATIVEPOLICE-RELATEDSTATEMENTSABOUTTHEIR NEIGHBORHOODS(LESTOT) ANDREQUESTEDPOLICESERVICE
DURING THEPRIORYEAR
Variable Beta Coeff. S.E. Sig. Odds Ratio
Ethnicity –.2565 .1482 .0834 .7737 Age .0141 .0057 .0136 1.0142 Education .4034 .2155 .0612 1.4969 Neighborhood .6319 .2395 .0083 1.8811 Lestot –.0390 .1432 .7856 .9618 Request SVC .5498 .2273 .0156 1.7329 Constant –.1488 .4947 .7636
significantly associated with positive attitudes. Older people were more likely to have said something positive (OR=1.01, p<.05). In addition, having made a request for police assistance was associated with positive attitudes; those who requested service were 1.7 times more likely to provide positive comments (OR=1.7, p<.05). Ethnicity, education, and disliking police-related things about one’s neighborhood were not significantly associated with positive attitudes in this model.
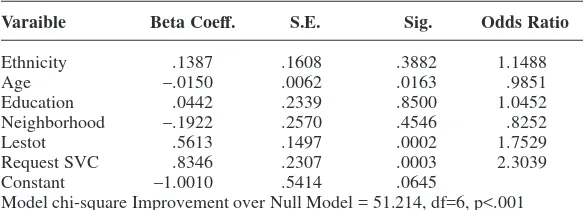
Not liking things about one’s neighborhood that are police related (LESTOT) was the best predictor of negative attitudes toward the police; for each item subjects mentioned, subjects were 80 percent more likely to provide negative statements about the police (OR=1.8, p<.001). Having requested police assistance was also associated with negative attitudes; those who requested aid from the police were more than twice as likely to say negative things (OR=2.3, p<.001). Age, too, was associated with negative attitudes, with older subjects less likely to say negative things (OR=.98, p<.05). Ethnicity, education, and neighborhood were not significantly associated with negative attitudes toward the police in this model.
A comparison of type of neighborhood residence (the best predictor of positive attitudes) with LESTOT (the best predictor of negative attitudes) revealed a strong negative association. People who lived in residential neighborhoods were less likely to mention deleterious police related items (gamma=.45, p<.001).
Table 4
ETHNICITY, AGE, EDUCATION, NEIGHBORHOODTYPE, SUBJECTS’ TOTALNEGATIVEPOLICE-RELATEDSTATEMENTSABOUTTHEIR NEIGHBORHOODS(LESTOT) ANDREQUESTEDPOLICESERVICE
DURING THEPRIORYEAR
Varaible Beta Coeff. S.E. Sig. Odds Ratio
Ethnicity .1387 .1608 .3882 1.1488 Age –.0150 .0062 .0163 .9851 Education .0442 .2339 .8500 1.0452 Neighborhood –.1922 .2570 .4546 .8252 Lestot .5613 .1497 .0002 1.7529 Request SVC .8346 .2307 .0003 2.3039 Constant –1.0010 .5414 .0645
CONCLUSIONS
The primary indicator of attitudes toward the police is how people feel about where they live. If they see problems that the police might do something about, they have negative things to say about the police.
Requests for police service are associated with both positive and negative comments. Future research might attempt to pinpoint the conditions that give rise to these attitudes. Such information may prove useful to police departments which wish to improve service.
The association of age with public attitudes toward the police is of little practical value other than to inform the police of something they probably already knew intuitively. The young may always be more critical of authority than their elders who have much more of a stake in maintaining order.
In addition, we saw that members of our sample who belonged to organizations that allowed them access to input information to the police reported significantly more positive items. Perhaps they have learned how difficult it is to affect change and, as a result, appreciate the difficulty of the police task. It may well be that citizen participation in problem solving helps community members feel better about their neighborhoods and provides their police department and the city with suggestions for improvement that may garner citizen support. In any case, our findings lend support for community policing programs that attempt to involve local citizens in police decision making. This may best be accomplished through neighborhood organizations, probably because they have the political punch necessary to make the police listen, and because groups that have only crime prevention as their focus are unlikely to survive (Whitaker, 1986:49).
Law Enforcement and Administration of Justice, 1967:145-146) may have been the result of their perceptions of crime in their neighborhoods, and not their minority status. The significance of this observation is that integration should be expected to somewhat decrease minority hostility toward the police. As minorities move into residential areas, their attitudes will more likely mirror those of the neighborhood. Indeed, our research findings with respect to blacks suggests such. But integration will not solve the police image problem in areas where the residents perceive problems that the police might do something about. The fact that the 1992 Los Angeles riot was a multi-cultural affair is worth noting in this regard.
The problems of police legitimacy and image are reflections of the difficulties inherent in urban life. Focused concern on police activities is probably undeserved. No matter how skilled officers may be in dealing with the public, they cannot right social ills. In this regard, programs that involve the community in police decision making and improvement of neighborhoods may help lessen our unrealistic expectations for law enforcement and, at least for a time, prove effective in improving public attitudes.
NOTES
The authors thank Jessie Fong for her research assistance. We are also indebted to community service officers of the Santa Ana, California Police Department who provided hundreds of hours of work. We also thank Chief Paul Walters, Lieutenant Bill Tegeler, and Craig Frazer who made this project possible.
dwellers. For example, if most of the individuals were involved in clerical or skilled occupations, the neighborhood was labeled as working class. This item also helped the police pinpoint neighborhoods that needed assistance. (We collected data on occupation, as well as on attitudinal variables that were not used in our analyses. Residents, for example, were asked to list things they felt needed to be improved in their neighborhoods and how they would deal with the problems they identified. Such information was for use by the SAPD.)
2. NEGTOT was scored in the same manner as POSTOT.
REFERENCES
Albrecht, S. and G. Miles (1977). “Attitudes Toward the Police and the Larger Attitude Complex: Implications for Police-community Relationships,”
Criminology, 15:67-86.
Arcuri, A. (1981). “Police and The Elderly.” In D. Lester (ed.), The Elderly Victim of Crime. Springfield, IL: Charles C. Thomas.
Bayley, D. and H. Mendelsohn (1969). Minorities and the Police: Confrontation in America. New York, NY: Free Press.
Boggs, S. and J. Galliher (1975). “Evaluating the Police: a Comparison of Black Street and Household Respondents,” Social Problems, 22:393-406.
Campbell, A. and H. Schuman (1972). “A Comparison of Black and White Attitudes and Experiences in the City.” In C. Haar (ed.), The End of Innocence: A Suburban Reader. Glenview, IL: Scott Foresman.
Davis, J. (1990). “A Comparison of Attitudes Toward the New York City Police,”
Journal of Police Science and Administration, 17:233-243.
Decker, S. (1981). “Citizen Attitudes Toward the Police: A Review of Past Findings and Suggestions For Future Policy,” Journal of Police Science and Administration, 9:80-87.
Furstenberg, F. and C. Wellford (1973). “Calling the Police: The Evaluation of Police Service,” Law and Society Review, 7:393-406.
Hadar, L. and J. Snortum (1974). “The Eye of the Beholder: Differential Perceptions of Police by the Police and the Public,” Criminal Justice and Behavior, 2:37-54;
Hindelang, M.; C. Dunn; A. Aumick; and P. Sutton (1975). Sourcebook of Criminal Justice Statistics 1974. Washington, DC: Government Printing Office. Jacob, H. (1971). “Black and White Perceptions of Justice in the City,” Law and Society Review, 5:69-89.
Johnson, T.; G. Misner; and L. Brown (1981). The Police and Society: An Environment for Collaboration and Confrontation. Englewood Cliffs, NJ: Prentice-Hall.
McCaghy, C.; I. Allen; and D. Coffey (1968). “Public Attitude Toward City Police in a Middle Sized Northern City,” Criminologica, 6:14-29.
Parks, R. (1976). “Police Response to Victimization Effects on Citizen Attitudes and Perceptions.” In W. Skogan (ed.), Sample Surveys of the Victims of Crime.
Cambridge, MA: Ballinger.
Peak, K.; R. Bradshaw; and R. Glensor (1992). “Improving Citizen Perceptions of the Police: ‘Back to the Basics’ With a Community Policing Strategy.” Journal of Criminal Justice, 20:25-40.
The President’s Commission on Law Enforcement and Administration of Justice, Task Force on the Police (1967). Task Force Report: The Police, Washington, DC: Government Printing Office.
Reiss, A. (1971). The Police and the Public. New Haven, CT: Yale University Press.
Schack, S. and R. Frank (1978). “Police Service Delivery to the Elderly,” The Annals of The American Academy of Political and Social Science, 438:84-92. Smith, P. and R. Hawkins (1973). “Victimization, Types of Citizen-Police Contacts and Attitudes Toward the Police,” Law and Society Review, 8:135-152. United States Bureau of the Census (1990). Census of Population and Housing. Washington, DC: Government Printing Office.
Walker, D.; R. Richardson; O. Williams; T. Denyer; and S. McGaugey (1972). “Contact and Support: An Empirical Assessment of Public Attitudes Toward the Police and the Courts,” North Carolina Law Review, 51:43-79.
Whitaker, C. (1986). “Crime Prevention Measures,” Bureau of Justice Statistics Special Report. Washington, DC: Department of Justice.
Winfree, T. and C. Griffiths (1971). “Adolescent Attitudes Toward the Police.” In T. Ferdinand (ed.), Juvenile Delinquency: Little Brother Grows Up. Beverly Hills, CA: Sage.
Zevitz, R. and R. Rettammel (1990). “Elderly Attitudes About Police Service,”