ENHANCEMENT OF STEREO IMAGERY BY ARTIFICIAL TEXTURE PROJECTION
GENERATED USING A LIDAR
Joshua Veitch-Michaelis a, Jan-Peter Muller a
*
, David Walton a, Jonathan Storey b, Michael Foster b, Benjamin Crutchley ba
Imaging Group, Mullard Space Science Laboratory, University College London, Holmbury St Mary, RH5 6NT, UK b
Innovative Small Instruments Limited, Pipers Business Centre, 220, Vale Road, Tonbridge, Sussex, TN9 1SP, UK
Commission V, WG V/3
KEY WORDS: stereo, LIDAR, pattern projection, structured light, texture, Gotcha
ABSTRACT:
Passive stereo imaging is capable of producing dense 3D data, but image matching algorithms generally perform poorly on images with large regions of homogenous texture due to ambiguous match costs. Stereo systems can be augmented with an additional light source that can project some form of unique texture onto surfaces in the scene. Methods include structured light, laser projection through diffractive optical elements, data projectors and laser speckle. Pattern projection using lasers has the advantage of producing images with a high signal to noise ratio. We have investigated the use of a scanning visible-beam LIDAR to simultaneously provide enhanced texture within the scene and to provide additional opportunities for data fusion in unmatched regions. The use of a LIDAR rather than a laser alone allows us to generate highly accurate ground truth data sets by scanning the scene at high resolution. This is necessary for evaluating different pattern projection schemes. Results from LIDAR generated random dots are presented and compared to other texture projection techniques. Finally, we investigate the use of image texture analysis to intelligently project texture where it is required while exploiting the texture available in the ambient light image.
1. INTRODUCTION
Stereo imaging remains a popular technique for dense 3D reconstruction. However, the performance of stereo matching algorithms is strongly dependent on image texture and scene illumination. These algorithms compute a similarity cost for matching pairs of pixels with the goal of locating pairs of pixels with maximal similarity (Scharstein and Szeliski, 2002). Scenes with large regions of homogenous intensity, such as painted walls, are difficult to match as the similarity cost for pixels in these regions tend to be very similar (Hirschmuller and Scharstein, 2007). Although there have been investigations into algorithmic methods to infer depth in information-poor regions, by far the simplest method to improve match results is to project a random or pseudo-random pattern into the scene. With this approach even simple correlation algorithms are effective; the original Microsoft Kinect device operates on this principle although it is not strictly a stereo system (Han et al., 2013).*
This paper presents a novel approach to texture projection by using the image of the laser spot from a visible-beam scanning LIDAR. The visible laser provides accurate and unique stereo-LIDAR correspondences by acquiring stereo imagery at every step in the scan. If the LIDAR is cross-calibrated to the stereo system, random dot patterns may be simulated by acquiring dense LIDAR data and projecting the 3D points into each image. This avoids any acquisition bottlenecks caused by the frame rate of the camera. The accurate ground truth provided by the LIDAR can then be used to compare other texture projection methods.
First, some common texture projection techniques are reviewed. Then, the combined stereo LIDAR system is described, along with a simple cross-calibration procedure. Results from LIDAR generated random dot textures are compared to ambient light alone. Additional results compare LIDAR texture against data
*
Corresponding author
projectors and diffractive optical element (DOE) based patterns. A strategy for intelligent image texturing using stereo matching prediction using a Support Vector Machine (SVM) trained on simple image features is finally applied.
2. RELATED WORK
In this section, current methods for 3D reconstruction using light projection are discussed. It should be noted that other (more invasive) techniques are available for adding texture to a scene. For instance, spray paint can be applied to the surface of an object to provide random texture prior to imaging, but clearly for most targets this is not practical.
2.1 Structured Light
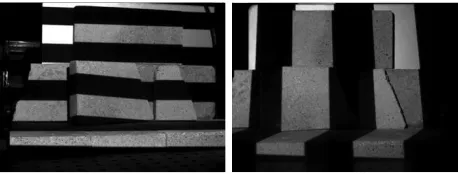
Structured light systems project a pattern or sequence of patterns which are used to infer depth (Posdamer, 1982) (Batlle et al., 1998) (Salvi et al., 2010). Figure 1 shows an example of such a structured light pattern.
Figure 1. Monochrome structured light patterns projected onto a scene full of 3D objects.
At a minimum, one view of the scene is required (Scharstein and Szeliski, 2003), but structured light may also integrated into the stereo camera systems (Jang et al., 2013). A common feature of structured light 3D is that there is some underlying knowledge about the geometry of the pattern(s) and this knowledge is critical for reconstruction. As such, image The International Archives of the Photogrammetry, Remote Sensing and Spatial Information Sciences, Volume XLI-B5, 2016
matching via correlation is generally not required, but a specific algorithm is required to derive 3D from a particular pattern sequence. Structured light patterns enable each pixel to be uniquely labelled or coded and this can be used to generate highly accurate ground truth depth maps. This also means that if it is not possible to recover the code for a particular pixel, it cannot be reconstructed without interpolation.
Structured light systems that rely on data projectors suffer from illumination constraints: the target environment must be uniformly illuminated, the projector must be much brighter than ambient and there may be issues with dynamic range if the scene contains large depth discontinuities. Laser-based methods solve the problem of dynamic range, but current diffractive optical elements (DOEs) cannot match the resolution of data projectors.
(Scharstein and Szeliski, 2003) used structured light to provide accurate, dense ground truth maps for the Middlebury stereo benchmark dataset. In the most recent update, (Scharstein et al., 2014), challenging scenes with reflective surfaces were included. However, it was necessary to paint reflective surfaces in a matt colour. Structured light is a common tool in industry as it enables very accurate depth measurements. However, it is severely limited to matt surfaces at short range and with sufficient illumination to overcome ambient lighting.
2.2 Random texture projection
Texture projection is defined here as a means of aiding a stereo matcher by providing additional texture in the scene. These methods are therefore agnostic to the actual matching algorithm used. Since stereo matching often relies on correlation using support regions or neighbourhoods around each pixel (Kanade and Okutomi, 1994), it is less important that every pixel be illuminated. For instance, if a pixel that is not illuminated, but a neighbouring pixel is, it may still be matched. Ambient illumination is also less of a concern with random patterns since they act to augment texture already present in the image. Figure 2 shows an example of a random dot pattern projected onto some kiln bricks.
(a) (b)
Figure 2. Random dot texture projection using a data projector. (a) with ambient illumination (b) with projector only.
Texture projectors may be simple devices such as DOEs. A popular choice of pattern is a 2D binary random dot pattern. Similar drawbacks to structured light apply: DOEs suffer from poor spatial resolution and while they are cheap to manufacture, the initial tooling and patterning costs are high. The Osela (Lachine, Canada)1 RPP random dot projector provides up to 57446 dots over a 45º x 45º field of view. However, the spatial resolution (inter-dot spacing) is not as critical as with structured light as the goal is not to cover every pixel in the image. Indeed it is necessary to leave some pixels unilluminated to allow
1
http://www.osela.com/products/random-pattern-projector/
strong intensity variation within the image. The Microsoft Kinect, for example, uses a repeated pseudo-random dot pattern.
One issue with texture projection involving truly random patterns is the possibility that if two small patches of the pattern are examined, they will be identical. There has been some research in preventing this - (Molinier et al., 2008) compared 5x5 pixel blocks in their pattern, ensuring that all blocks are unique. (Lim, 2009) used non-recurring De Brujin sequences (de Brujin, 1975) to generate patterns which have no repetition along individual epipolar lines. A De Brujin sequence B = (k, n) contains all sequences of length n drawn from an alphabet, A, generated, simulated annealing is used to adjust it such that the average similarity between two blocks is minimised. The process also aims to generate patterns that are less affected by blurring and phase noise introduced by spatial offsets between the camera and projector. These patterns exploit the fact that if the epipolar constraint is satisfied, and the images are rectified such that matches lie along horizontal scanlines, then the pattern need only be unique in the horizontal direction (Hartley and Zisserman, 2003).
These studies quantify performance in different ways. Lim compared results to a ground truth disparity map, but it is not specified how the ground truth is generated. Konolige compared the drop-out (effectively the percentage of unmatched pixels) for various patterns and also performed metric accuracy measurements on the final pattern using a planar target.
There are a number of commercially available stereo systems that include texture projectors. The IDS (Obersulm, Germany) Ensenso2 series includes either a blue or infrared random dot projector and is able to produce depth maps in realtime (30 fps) with a modern desktop computer. The Tordivel3 (Oslo, Norway) Scorpion Stinger is another short (203 mm) baseline system which includes a random dot laser projector.
2.3 Laser speckle
Laser speckle is a phenomenon caused by the mutual interference of monochromatic photons in a laser beam (Imai, 1986). Speckle is easily generated using either an optical fibre or a ground glass diffuser which allows for cheap and compact systems (Schaffer et al., 2010). Figure 3 shows an example of such a pattern.
Figure 3 Laser speckle pattern produced by a 532 nm laser and a 200 µm fibre.
Since the speckle pattern is random, it may be used as a source of texture. (Dekiff et al., 2010) used speckle generated using a
ground glass diffuser for in-vivo medical imaging. There are a number of parameters which may be varied when using speckle projection, primarily the size of the projected speckles which may be controlled using focusing optics. In Dekiff's examples, speckle spots 8 pixels wide were used leading to low resolution (by stereo standards) measurements with only 3900 3D points reconstructed. However, the technique was able to achieve errors of 0.058 mm when reconstructing a spherical surface from a 1 m standoff.
3. LIDAR TEXTURE PROJECTION
In this section, a novel approach to texture projection is discussed, namely the use of a visible-beam scanning LIDAR. By imaging the laser spot while the system is scanning, it is possible to build up a random dot pattern which may then be used with an unmodified stereo matching algorithm. Once matching is complete, the LIDAR is able to fill any gaps in the resulting disparity map.
A high level overview of the method is as follows:
1. Set the LIDAR to scan within the field of view of the two cameras
2. At each step in the LIDAR scan, acquire a stereo pair with a short exposure time such that only the laser spot is visible
3. Once the scan is complete, merge the images together to form a stereo pair of the scene with a random dot pattern overlaid.
4. Pass the stereo images to the matcher
5. Optionally infill any unmatched regions using the LIDAR
Although reconstruction using this method is necessarily slower than using a static pattern, since it is limited to the camera frame rate, it offers several advantages. At each point in the scan, the location of the LIDAR spot is determined in the left and right images. Once the scan is complete, these locations form a ground truth disparity map which can be used to evaluate matching results. Since each image in the scan corresponds to a single LIDAR range, it is possible to generate bespoke texture patterns. If the image is analysed prior to scanning it is also possible to identify regions with low texture and preferentially scan in these locations. The use of a visible laser beam enables texture projection over a large depth of field without illumination issues. Finally using a suitable scanning platform allows an effective resolution much higher than that of a projector or DOE, if desired.
It would also be possible to use a scanned laser beam, however the LIDAR allows for robust measurements on a variety of surfaces, even if the spot is not visible to the camera due to low reflectance. Also, if the LIDAR is cross-calibrated such that the locations of measured points can be mapped to 2D image coordinates, it is possible to generate simulated random dot images. This also allows the use of scanning LIDAR with faster acquisition rates than that of the camera (i.e. step 2 is not required).
3.1 System model and geometry
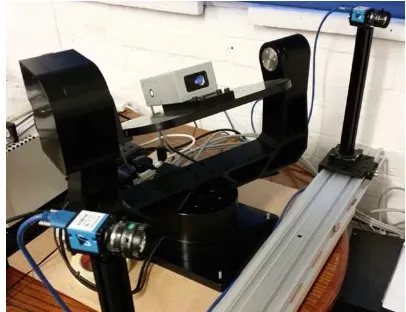
The LIDAR (Dimetix FLS-C 10) and scanning gimbal mount (Newmark GM-12) are positioned in-between the two cameras (Imaging Source DMK23UM01 with 8mm lenses) as shown in Figure 4.
Figure 4. Stereo camera and scanning LIDAR system.
The Dimetix FLS-C 10 has a specified accuracy of ±1mm on natural surfaces at a range of up to 65m. In its highest resolution mode, acquisition at up to 20Hz is possible. The Newmark GM-12 mount has a specified positioning accuracy of 0.02 °.
The stereo system was calibrated using Zhang's method (Zhang, 2000) as implemented in the OpenCV library (Bradski, 2000) with a reprojection error of 0.10 pixel for each camera. The LIDAR was cross-calibrated using the method described in (Veitch-Michaelis et al., 2015), giving the rotation R and translation T between the two systems. The geometric relationship between the two coordinate systems is shown in Figure 5.
Figure 5 Geometric relationship between the stereo camera coordinate system, centred on the left camera (A) and the
LIDAR coordinate system (B).
3.2 LIDAR spot location
The LIDAR spot was modelled as a 2D Gaussian. The beam that the Dimetix FLS-C 10 produces is not rotationally symmetric. Due to different beam divergences in each axis, the spot appears to be slightly rectangular though this is more pronounced at ranges under 1m. Coarse peak location was obtained by locating the maximum pixel in the image, subject to an intensity threshold of 60.
This threshold was chosen experimentally and worked well in testing. The camera exposure settings were chosen to supress ambient illumination so the laser spot was always the brightest feature in the image. The peak location was then refined to sub-pixel using a least-squares fit to a 2D Gaussian function. It was necessary to model the peak with variable width, height and rotation due to perspective effects.
3.3 Ground truth generation
A ground truth disparity map is necessary in order to evaluate the performance of different texture projection techniques and indeed stereo match performance in general. Counting the number of matched pixels that satisfy a left-right consistency check is not ideal as this assumes a priori that the stereo matcher is returning correct results. Since the LIDAR scan is sparse, it is not possible to obtain a ground truth disparity for every pixel without interpolation. Therefore, two ground truth measures are given. The first uses the sparse LIDAR points and is considered a 'gold standard' as it is based on direct observation of the LIDAR spot in each image. The second method for ground truth generation is based on interpolation of these sparse points using inpainting (Bertalmio et al., 2001).
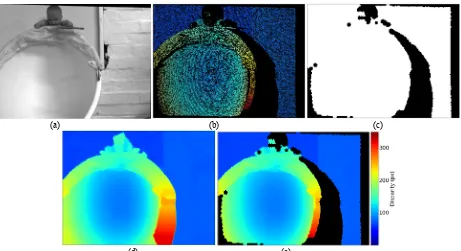
Figure 6a shows a scene which was specifically arranged to be difficult to match. The rear wall and hemispherical chair contain little intensity variation. Sparse LIDAR ground truth from 35,000 measurements is shown in Figure 6b. It was necessary to mask image regions which were occluded. The occlusion mask was created by binning the LIDAR disparity map by a factor of five to reduce the spacing between measurements. Morphological greyscale opening was applied to fill small holes while ignoring occluded regions. This image was then up-sampled to the original image size and any pixel with a disparity of zero was defined as occluded. The final result is shown in Figure 6c. This mask is combined with the inpainted ground truth, Figure 6d, to produce the final ground truth shown in Figure 6e.
The interpolated ground truth appears to be a reasonable representation of the scene, although fine details are inevitably lost. For evaluating texture projection, coarse ground truth is still useful as homogenously textured regions tend to have smoothly varying depth. Higher resolution scans would provide more accurate ground truth, but the example in Figure 6 shows that even with only 3% of the pixels labelled with a known ground truth, inpainting is an effective approximation.
3.4 Random dot pattern generation
Random dot patterns were generated from LIDAR by combining images obtained at every step in the scan. A random sample of these images was stacked to form the desired dot pattern. Starting with an empty image, the pattern was updated by taking the element-wise maximum of the current pattern and each new image. An example pattern created using this method is shown in
Figure 7.
Figure 7 Random dot pattern generated by stacking 35,000 LIDAR spot images.
Acquiring several tens or even hundreds of thousands of images may be impractical. With compression the storage requirements are modest, storing intermediate images limits the process to the frame rate of the camera. Commercial scanning LIDAR, such as the Leica ScanStation P30/P404, are available with capture rates up to 1M pt/sec. Since the LIDAR was cross-calibrated with the
4
http://www.leica-geosystems.co.uk/
(a) (b) (c)
(d) (e)
Figure 6 (a) Left stereo image (1.23 MP) (b) Sparse LIDAR ground truth (35000 points) (c) Occlusion mask, black = occluded (d) Inpainted LIDAR ground truth (e) Inpainted and masked LIDAR ground truth. The colour map in (e) is consistent for (b) and (d).
stereo system, it was possible to generate simulated random dot location in the image. A Gaussian filter with a 3x3 pixel kernel was applied so that each point resembled a laser spot. If the LIDAR used, returns intensity information, this can be used to colour each point according to its surface reflectance.
Figure 8 shows such a simulated dot pattern, it appears very similar to the real one, but does not account for distortion of the laser spot on the angled surfaces.
Figure 8 Simulated random dot pattern, generated from 35,000 LIDAR points mapped to image coordinates. Each point is a 5 pixel white circle and a Gaussian convolution was applied to the
image.
3.5 Stereo matching
Matching was performed using the Gruen-Otto-Chau Adaptive Least Squares Correlation (Gotcha) algorithm (Gruen, 1985), (Otto and Chau, 1989), (Shin and Muller, 2012). Gotcha is a region growing stereo matcher that has been demonstrated to be highly accurate on both terrestrial and planetary images (Day and Muller, 1989) as well as close-range and medical imagery (e.g. Deacon et al., 1991). The version used was a 5th generation implementation developed at Mullard Space Science Laboratory (MSSL). Gotcha takes as input a number of seed correspondences from which a disparity map is 'grown'. Unusually among stereo matchers, Gotcha is not constrained by a maximum or minimum disparity since the search location for a particular pixel is derived from an initial correspondence generated using a feature detector like SIFT (Lowe, 2004). In well textured regions, Gotcha is able to produce dense disparity maps from only a few seed points. However, in weakly texture regions, reconstruction is liable to fail. In this regard, Gotcha could be considered accurate, but cautious; if there is a low confidence that a match is correct it will not be returned. Gotcha was used with default settings: 8-connected neighbours, a patch size of 12, and a confidence (eigenvalue) threshold of 100 (see (Shin and Muller, 2012) for explanations of these parameters).
4. RESULTS
Stereo pairs and LIDAR scans for three test scenes were acquired: Corner (Figure 9a), Chair (Figure 10a) and Bricks (Figure 11a). In the corner and chair scenes, ambient, real LIDAR random dot (RLRD) and simulated LIDAR random dot (SLRD) were acquired. In the brick scene, additional stereo pairs were captured with a Kinect pseudo-random dot pattern (KIN) and a random dot image, generated from a data projector (DP).
Performance was evaluated in several ways:
1. Percentage of successfully matched pixels (PM) 2. Mean disparity error and standard deviation compared
to the LIDAR (sparse) ground truth (DES)
3. Mean disparity error and standard deviation compared to the inpainted ground truth (DEI)
4. Percentage of matched pixels with a disparity error <= 2 px (PM2) and <= 1 px (PM1)
Quantitative results for each scene are shown in Table 1 (Chair), Table 2 (Corner) and Table 3 (Bricks). Top performances are
Table 1 Match performance for Chair scene.
DES (px) DEI (px) PM Table 2 Match performance for Corner scene.
DES (px) DEI (px) PM
Table 3 Match performance for Bricks scene
In the Corner and Chair scenes, Gotcha struggles to match the large changes in perspective between views. The differences between simulated and real LIDAR random dots are small.
In some cases, such as the bowl of the chair, SLDR texture provides more matches. In others, such as the doll's head, RLDR performs better. Both methods show a significant improvement over passive stereo, with 4-5 times more pixels matched.
Figure 9 Chair scene. (a) Ambient light (b) LIDAR random dot (30 k points) (c) Ground truth disparity. Match results from Gotcha (d) Ambient, (e) LIDAR random dot (f) Simulated LIDAR random dot.
Figure 10 Corner scene. (a) Ambient light (b) LIDAR random dot (80 k points) (c) Ground truth disparity. Match results from Gotcha (d) Ambient, (e) LIDAR random dot (f) Simulated LIDAR random dot.
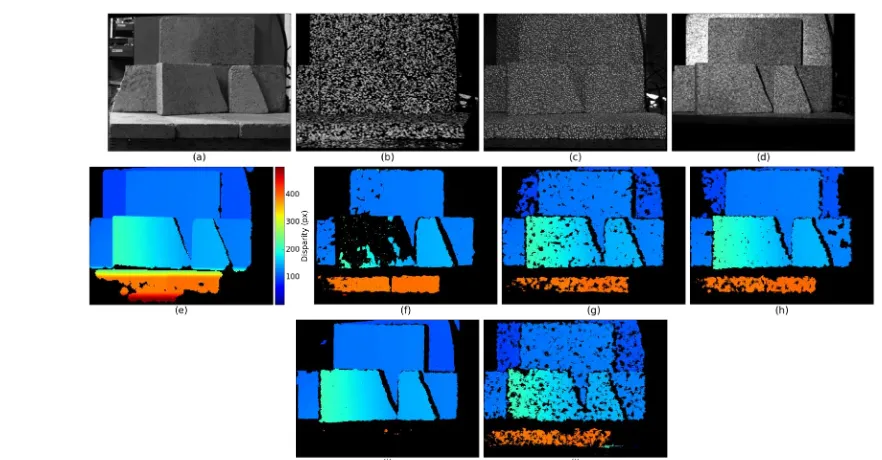
Figure 11 Bricks scene. (a) Ambient (b) LIDAR random dot (25 k points) (c) Kinect projector (d) Data projector (e) Ground truth disparity. Match results from Gotcha are shown on the second row (f) Ambient, (g) LIDAR random dot (h) Kinect projector (i) Data
projector (j) Simulated LIDAR random dot.
In the Bricks scene, there are good match results on the brick surfaces. The surface behind the bricks (a computer chassis) presents a challenging, specularly reflective, target. The projected patterns are all able to match some of the rear surface, though the DP texture suffers with specular reflection far more than the laser-based methods. Aside from this, the DP produced the cleanest results visually and almost all the illuminated regions are matched. This scene was at a closer range than Corner and Chair and the laser spot size was larger, even with very short exposure times. This manifests as coarser disparity maps using RLDR and SLDR.
Overall, active stereo matching can produce superior match results to passive stereo matching. LIDAR random dot patterns are an effective alternative to other projection methods. The ground truth data was also shown to be accurate, with most textures giving sub-pixel mean disparity errors. The inpainted ground truth is a useful metric for dense disparity map evaluation, but tended to have an error of 1-2 pixels.
5. TEXTURE ANALYSIS
One approach to more intelligent image texturing is to attempt to predict which regions of the image are likely to be matched. These regions may not require additional texture and may even be more poorly matched with additional texture. The problem is to determine whether there is sufficient local texture for the image to be matched with high probability. This can be posed in the form of binary classification, with the goal of labelling each pixel with a predicted 'match' or 'no match' label.
Match prediction was investigated using a support vector machine (SVM) (Suykens and Vandewalle, 1999). An SVM takes a set of labelled multi-variable training data, and attempts to find the hyperplane that has, on average, the largest distance between the nearest points in each output class (i.e. match or no match). The proposed method was specifically developed for use with Gotcha. Since Gotcha takes as input a list of seed points, intuitively there is a low probability that a pixel far from any seed point will be matched. On the other hand, if there is a lone seed point in a large image region with good texture the matcher should be able to grow the disparity map into that region. Two per-pixel features were used for classification: the Euclidean distance to the nearest seed point and the image entropy. The distance to the nearest seed point (DNSP), a nearest-neighbour search, can be performed exactly on a Graphics Programming Unit (GPU) very quickly, around 50 ms for a 1 MP image on an AMD Radeon 6970M.
(Egnal et al., 2004) found that entropy (Shannon, 1948) was a good metric for predicting unmatched pixels. Entropy, �, is defined for an image as � = − 2�2log6�2 where �2 is the
probability that a pixel has a particular intensity value and I runs from 0-255 for an 8-bit image.
Training data was generated using 15 stereo pairs from the Middlebury data set (Scharstein, 2002), with 14.8 Mpx of classified pixels. These images were matched with Gotcha, and the entropy and DNSP calculated for each left image. A 2D histogram of the data is shown in Figure 12. Results for different neighbourhood sizes (3 x 3, 5 x 5, 7 x 7 and 9 x 9) were produced, but there was little difference beyond 5 x 5. Both entropy and DNSP alone are quite effective at predicting whether pixels will be matched or not. Few pixels are matched with a DNSP > 30 or a local entropy of < 1.8.
Figure 12. Histogram of matched pixels given local entropy and distance to nearest seed point, generated from 15 stereo pairs.
The SVM classifier trained on this data performed with an unmatched prediction rate of 90.26% and a matched prediction rate of 53%. This result is acceptable since it is the unmatched pixels that are of interest. After the SVM was used to classify pixels in an input image, morphological dilation was used to fill holes in the prediction map. The prediction result for Bricks is shown in Figure 13.
Figure 13 (a) Predicted matched pixels for Bricks scene (white = match) (b) Actual Gotcha disparity map for Bricks scene.
The unmatched classification accuracy was 91% and the matched classification accuracy was 61%. Using this prediction, texture projection was limited to the predicted unmatched regions, giving a final disparity map shown in Figure 14.
Figure 14 Bricks scene, Gotcha disparity map generated using a combination of ambient illumination and LIDAR random dot
texture.
The image contains both the smooth reconstruction on the brick faces from ambient illumination and the additional reconstruction from LIDAR random dot texture on the rear surface. The central gap in the disparity map remains since the prediction map is incorrect there. The number of LIDAR points used was reduced from 73970 to 43741, a 40% decrease. Intelligent image texturing is most effective if the image contains regions of both strong and weak texture.
6. CONCLUSIONS
This paper proposes the use of a visible beam scanning LIDAR for evaluating texture projection methods, as well as generating artificial texture using the LIDAR laser spot itself. A cross-calibrated LIDAR can provide sub-pixel accurate sparse ground truth and pixel-accurate dense ground truth using interpolation. Cross-calibration allows either direct imaging of the LIDAR or simulated imaging of the laser spot. Texture generated from a LIDAR scan, both real and simulated, provides comparable stereo match performance to texture generated via random dot patterns or DOEs with more flexibility over dynamic range, resolution and scan size. For scenes that contain a mixture of well- and poorly-textured regions, it is possible to predict which pixels will be matched with high enough accuracy that the number of additional LIDAR points is significantly reduced.
Further experiments will compare additional texture projection methods such as laser speckle and investigate ways to improve simulated texture patterns.
ACKNOWLEDGEMENTS
The first author acknowledges support from STFC-CASE Industrial CASE grant (ST/J002984/1) as well as from IS Instruments Ltd.
REFERENCES
Batlle, J., Mustapha Mouaddib, El, Salvi, J., 1998. Recent progress in coded structured light as a technique to solve the correspondence problem: a survey. Pattern
Recognition 31, 963–982.
Bertalmio, M., Bertozzi, A.L., Sapiro, G., 2001. Navier-stokes, fluid dynamics, and image and video inpainting, in: Computer Vision and Pattern Recognition, 2009. CVPR 2009. IEEE Conference on, IEEE Comput. Soc, pp. I– 355–I–362 vol.1.
Bradski, G., 2000. The opencv library. Doctor Dobbs Journal 25, 120–126.
Day, T., Muller, J.-P., 1989. Digital elevation model production by stereo-matching spot image-pairs: a comparison of algorithms. Image and Vision Computing 7, 95–101. Deacon, A., A. Anthony, S. Bhatia, and J. Muller, 1991
“Evaluation of a CCD-based facial measurement system,” Med Inform, 16 (2), 213–228.
Dekiff, M., Berssenbrügge, P., Kemper, B., Denz, C., Dirksen, D., 2010. Three-dimensional data acquisition by digital correlation of projected speckle patterns. Appl. Phys. B 99, 449–456.
Egnal, G., Mintz, M., Wildes, R.P., 2004. A stereo confidence metric using single view imagery with comparison to five alternative approaches. Image and Vision Computing 22, 943–957.
Gruen, A., 1985. Adaptive least squares correlation: a powerful image matching technique. South African Journal of Photogrammetry 14, 175–187.
Han, J., Shao, L., Xu, D., Shotton, J., 2013. Enhanced Computer Vision With Microsoft Kinect Sensor: A Review.
Cybernetics, IEEE Transactions on 43, 1318–1334. Hartley, A., Zisserman, R., 2003. Multiple View Geometry in
Computer Vision. Cambridge University Press. Hirschmuller, H., Scharstein, D., 2007. Evaluation of Cost
Functions for Stereo Matching, in: Computer Vision and Pattern Recognition, 2007. CVPR '07. IEEE Conference on, pp. 1–8.
Imai, M., 1986. Statistical Properties of Optical Fiber Speckles. Bulletin of the Faculty of Engineering, Hokkaido University
130, 89–104.
Jang, W., Je, C., Seo, Y., Lee, S.W., 2013. Structured-light stereo: Comparative analysis and integration of structured-light and active stereo for measuring dynamic shape. Optics and Lasers in Engineering 51, 1255–1264. Kanade, T., Okutomi, M., 1994. A stereo matching algorithm
with an adaptive window: theory and experiment. Pattern Analysis and Machine Intelligence, IEEE Transactions on 16, 920–932.
Konolige, K., 2010. Projected texture stereo, in: Robotics and Automation ICRA, IEEE International Conference on, pp. 148–155.
Lim, J., 2009. Optimized projection pattern supplementing stereo systems, in:. Robotics and Automation ICRA, IEEE International Conference on, pp. 2823–2829.
Lowe, D.G., 2004. Distinctive Image Features from Scale-Invariant Keypoints. International Journal of Computer Vision 60, 91–110.
Molinier, T., Fofi, D., Salvi, J., Fougerolle, Y., Gorria, P., 2008. Projector view synthesis and virtual texturing. 2nd Int'l Topical Mtg. Opt. Sens. Artific. Vision.
Otto, G.P., Chau, T., 1989. “Region-growing” algorithm for matching of terrain images. Image and Vision Computing 7, 83–94.
Posdamer, J.L., 1982. Surface geometry acquisition using a binary-coded structured illumination technique. Computers in Industry 3, 83–92.
Salvi, J., Fernandez, S., Pribanic, T., Lladó, X., 2010. A state of the art in structured light patterns for surface profilometry. Pattern Recognition 43, 2666–2680.
Schaffer, M., Grosse, M., Kowarschik, R., 2010. High-speed pattern projection for three-dimensional shape measurement using laser speckles. Appl. Opt. 49, 3622– 3629.
Scharstein, D., Hirschmüller, H., Kitajima, Y., Krathwohl, G., Nešić, N., Wang, X., Westling, P., 2014. High-Resolution Stereo Datasets with Subpixel-Accurate Ground Truth, in: Jiang, X., Hornegger, J., Koch, R. (Eds.), Lecture Notes in Computer Science. Springer International Publishing, Cham, pp. 31–42.
Scharstein, D., Szeliski, R., 2003. High-accuracy stereo depth maps using structured light, in:. Computer Vision and Pattern Recognition, 2003. Proceedings. 2003 IEEE Computer Society Conference on, pp. I–195–I–202 vol.1 Scharstein, D., Szeliski, R., 2002. A Taxonomy and Evaluation
of Dense Two-Frame Stereo Correspondence Algorithms. International Journal of Computer Vision 47, 7–42. Shannon, C.E., 1948. A mathematical theory of communication.
The Bell System Technical Journal 27, 379–423. Shin, D., Muller, J.-P., 2012. Progressively weighted affine
adaptive correlation matching for quasi-dense 3D reconstruction. Pattern Recognition 45, 3795–3809. Suykens, J.A.K., Vandewalle, J., 1999. Least Squares Support
Vector Machine Classifiers. Neural Processing Letters 9, 293–300.
Veitch-Michaelis, J., Muller, J.-P., Storey, J., Walton, D., Foster, M., 2015. Data fusion of lidar into a region growing stereo matcher. Int. Arch. Photogramm. Remote Sens. Spatial Inf. Sci. XL-4-W5, 107–112.
Zhang, Z., 2000. A flexible new technique for camera
calibration. IEEE Trans. Pattern Anal. Machine Intell. 22, 1330–1334