Quantitative assessment of a novel super-resolution restoration technique using HiRISE with
Navcam images: how much resolution enhancement is possible from repeat-pass observations
Y. Tao, J.-P. Muller
Imaging group, Mullard Space Science Laboratory, University College London, Holmbury St Mary, Surrey, RH56NT UK ([email protected]; [email protected])
Commission IV, WG IV/8
KEY WORDS: Super-resolution restoration, GPT, HiRISE, repeat-pass, MSL, Navcam, orthorectified image, rock size, rover track, assessment, resolution enhancement, landing site selection
ABSTRACT:
Higher spatial resolution imaging data is always desirable to the international community of planetary scientists interested in improving understanding of surface formation processes. We have previously developed a novel Super-resolution restoration (SRR) technique (Tao & Muller, 2016) using Gotcha sub-pixel matching, orthorectification, and segmented 4th order PDE-TV, called GPT SRR, which is able to restore 5cm-12.5cm near rover scale images (equivalent to Navcam projected FoV at a range of ı5m) from multiple 25cm resolution NASA MRO HiRISE images. The SRR technique has been successfully applied to the rover traverses for the MER and MSL missions within the EU FP-7 PRoViDE project. These SRR results have revealed new surface information including the imaging of individual rocks (diameter ı 25cm) by comparison of the original HiRISE image and rover Navcam orthorectified image mosaics. In this work, we seek evidence from processing a very large number of stereo reconstruction results from all Navcam stereo images within PRoViDE, registration and comparison with the corresponding SRR image, in order to derive a quantitative assessment on key features including rocks (diameter < 150cm) and rover track wheel spacing. We summarise statistics from SRR-Navcam measurements and demonstrate that our unique SRR datasets will greatly support the geological and morphological analysis and monitoring of Martian surface and can also be applied to landing site selection, in order to avoid unsuitable terrain, for any future lander/rover as well as help to define future rover paths.
1. INTRODUCTION
1.1 Background and Context
Higher spatial resolution imaging data is usually considered desirable to the international community of planetary scientists interested in improving understanding of surface formation processes. The higher the spatial resolution, the closer the images are to typical resolutions used by geologists to interpret such processes on the Earth from aerial imagery. For example, studying the Martian surface using 12.5m High Resolution Stereo camera (HRSC) imagery allows you to be able to visualise the “big picture”, whilst for a tiny percentage of the Martian surface (~1%), 25cm High Resolution Imaging Science Experiment camera (HiRISE) allows you to analyse fine-scale details of surface features to get insights into complex surface forming processes. However, 25cm resolution is still not high enough to be able to analyse how rocks are distributed across a region or see the types of sedimentary features that Mars Science Laboratory (MSL) Curiosity rover has found in rover-based imagery.
Within the recently completed EU FP-7 PRoViDE project (Paar et al., 2015), we developed a novel super-resolution algorithm called Gotcha-PDE-TV (GPT), which was specifically developed to address the retrieval of orbital SRR and whose initial results suggest huge potential for Martian surface studies. The technique (Tao & Muller, 2015a) is unique, since (a) we not only use sub-pixel information from slight translational shifts but also restore pixels onto an orthorectified grid from different (comparatively large) viewing angles, thereby achieving a 2-5x enhancement in resolution; (b) used a novel segmentation-based approach to restore different features
separately; (c) applied the 5th generation of an adaptive least squares correlation and region growing matcher, called Gotcha, and the 4th order of Partial Differential Equation (PDE) based Total Variation (TV) regularization approach to provide accurate and robust (noise resistant) restoration (Tao & Muller, 2015a). GPT-SRR is applicable whenever there exist sub-pixel differences and there are comparably large view zenith angle differences, which is always the case in orbital images, even between multiple image acquisitions taken at different times with different solar illumination conditions. Each view is subject to different atmospheric blurring and scattering but as long as the atmospheric transparency is sufficiently high, GPT-SRR can be applied.
From the experiments performed to date over MER and MSL rover traverses, multiple overlapping HiRISE input images (25cm) can be processed to generate up to 5cm super resolution imagery depending on how many overlapping images are available and what quality they have. This enables the derivation of extremely detailed reconstructions of Martian surface hazards that are not viewable or insufficiently clear in single HiRISE images.
These SRR results have revealed new information including the imaging of individual rocks (diameter ı 25cm) by comparison with both the original HiRISE image and rover Navcam orthorectified image mosaics (Tao & Muller, 2015b). In this work, we seek evidence from processing a very large number of stereo reconstruction results from all Navcam stereo images within PRoViDE, registration and comparison with the corresponding SRR image, in order to derive a quantitative assessment on key features including rocks (diameter < 150cm) and rover track wheel spacing. We summarise statistics from The International Archives of the Photogrammetry, Remote Sensing and Spatial Information Sciences, Volume XLI-B4, 2016
SRR-Navcam measurements and demonstrate that our unique SRR datasets will greatly assist the geological and morphological analysis and monitoring of Martian surface and can also be applied to landing site selection, in order to avoid unsuitable terrain, for any future lander/rover as well as help to define future rover paths.
We plan to port the GPT-SRR software to faster compute resources such as a GPU or possible cloud computing resources in the near future and hence be able to process a very large number of full HiRISE areas, where we have 5 or more repeated observations, as well as new ESA CaSSiS data in the future but including both 3D and images from multiple overlapping colour stereo.
1.2 GPT-SRR Summary
The current implementation of the GPT SRR algorithm is shown schematically in [Figure 1]. A detailed description of the method can be found in (Tao & Muller, 2015a). In the GPT SRR, we take roughly aligned overlapping Lower resolution (LR) images and an Orthorectified Image (ORI) as input to estimate the up-scaled High Resolution (HR) image with a given scaling factor. The processing pipeline starts with a Mutual Shape Adapted (MSA) Scale Invariant Feature Transform (SIFT) detection and Gotcha process to predict motion vectors for every pixel (sub-pixel correspondences) on each of the LR images with respect to the reference ORI frame. If a position in the HR grid does not have any corresponding motion vector from all motion maps, this HR pixel will be propagated by its neighbouring HR pixels.
Figure 1 Flow diagram of GPT-SRR processing chain.
The motion maps provide the initial degradation information in the similarity measurement term of the MAP estimation. LR images and the reference ORI are resized by the defined scaling factor and are segmented to tiles according to a given threshold of the maximum difference of the magnitude of the distance of
the motion vectors. Then the MAP equation is resolved by (i) For the same area, each tile of each LR image is projected with motion vector next image (k) until all images converge; (iii) adding the
transposed difference vector for the image tile (k, t); (iv) adding the smoothness term and decomposing the TV regularization term with a 4th order PDE; (v) go back to i) for the next steepest descent iteration until it converges; (vi) collect the HR result for this tile (ti) and go back to i) for the next tile (ti+1) until all segments (S) converge; (vii) collect the results for all HR segments (S) and reconstruct the full HR grid; (viii) Finally a series of post-processing operations are performed based on the HR reconstruction including noise filtering and de-blurring.
2. GPT-SRR PRODUCTS OVERVIEW
2.1 MER and MSL HiRISE SRR
on MER-B Victoria crater was produced using 4 repeat views to yield a 12.5cm resolution. Finally for MSL, 8 repeat views (including partial coverage) were used to yield a resolution of 6.25cm covering its full traverse to date.
Figure 2 An example of MER-A 25cm HiRISE image (top) and 5cm SRR image (bottom) over the rover traverse on Sol 549-636.
[Figure 2] is an example of the 5cm MER-A SRR image in comparison with 25cm HiRISE ORI, showing that a lot more rocks and fine scale features have been resolved after the GPT-SRR processing. Detailed analysis on such scenes is given in the next section.
2.2 3D Visualisation and Web-GIS
In order to better support geological interpretation on SRR products, a subset of the SRR scenes from MER and MSL have converted to OPC format by our colleagues at Joanneum Research and can be visualised/annotated in 3D using the PRo3D® viewer developed by VRVis within the PRoViDE project [Figure 4].
Figure 3 3D visualisation from PRo3D® of 5cm SRR
(http://www.progisweb.eu), to give access to SRR datasets to the planetary science community and visualisation in a multi-resolution co-registered context. [Figure 5] shows an example of the MSL SRR image mosaic on the top of HiRISE and CTX ORI along the rover traverse in PRoGIS 1.0 website.
Figure 4 PRoGIS 1.0 interface showing MSL SRR products on the top of co-registered HiRISE and CTX orthoimage.
2.3 Pancam and Navcam SRR
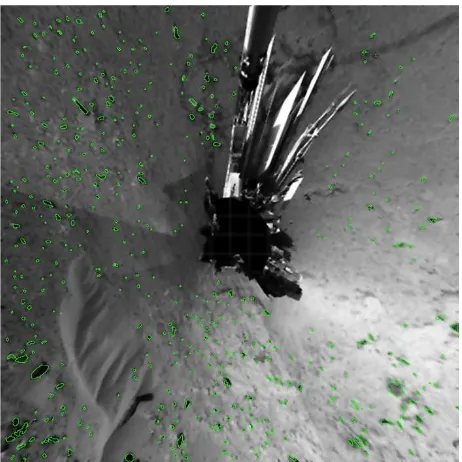
GPT-SRR has also been applied to MER Pancam sequences that were specially acquired for SRR, as well as MSL Navcam repeat images. Experiments have been made on a stack of MER-B Pancam images and MSL Navcam images. However, without multi-angle information, only a factor of 1.5-1.75x enhancements can be achieved. An example of MSL Navcam SRR has shown in [Figure 6].
Figure 5 An example of 1.75x MSL Navcam SRR from 6 slightly shifted views.
2.4 MSL ChemCam SRR
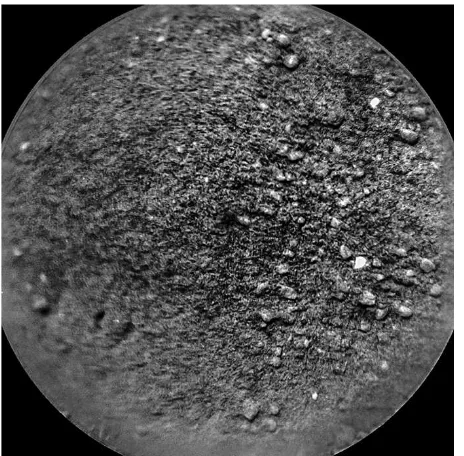
Similar to MER Pancam and MSL Navcam, MSL ChemCam SRR was also produced and examined using a stack of continuous views. The details of small stones and sand can be more clearly observed from the SRR shown in [Figures 7 & 8]. However, the resolution enhancement in ChemCam sequence is also subject to a factor of 1.75x in the absence of different viewing angles.
Figure 6 An example of one of the original ChemCam images in a stack of 16 images.
Figure 7 An example of 1.75x ChemCam SRR produced from 16 input images.
3. QUANTITATIVE ASSESSMENT
In the preceding section, GPT-SRR products were demonstrated to provide a 1.5-1.75x enhancement on rover imagery without multi-angle information and a 2-5x enhancement on multi-angle HiRISE images. The GPT-SRR technique is optimal for orbital imagery because we use both sub-pixel information from slight translational shift of a stack of lower resolution images and we restore pixels onto an orthorectified grid using images taken from different (comparably large) view angles. In this section, we demonstrate several assessment methods taken with the HiRISE SRR, original HiRISE image, and rover Navcam image.
3.1 Rover Track Measurement
As described in (Tao & Muller, 2015a), we are able to enhance and composite rover tracks that appeared in different HiRISE images using different weights. In comparing the enhanced rover tracks in SRR with rover imagery, we are able to perform high accuracy rover localisation as well as validate the spatial resolution. In particular, we can measure the outer-wheel and inner-wheel spacing. The comparisons between rover track compositing in SRR images, Navcam orthorectified image mosaics, and JPL vertically projected Navcam RDR products were demonstrated in (Tao & Muller, 2015a) over the MER-A Homeplate area. The maximum difference between the rover track outer spacing from SRR image and Navcam orthorectified mosaic was found within 8cm (1.6 pixels in SRR image), which is subject to Navcam orthorectification distortions and possible Martian surface change for the yearlong time span.
3.2 Texture-based Surface Roughness
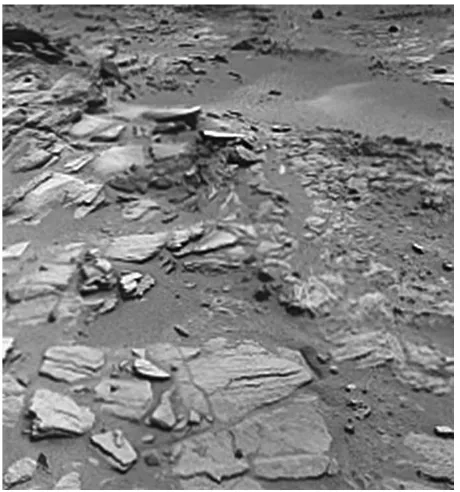
Apart from the MER-A rover track outer spacing measurement, another example from 6.25cm MSL SRR image over the so-called Shaler area has shown restoration of very clear outcrop
initial study on surface roughness derived from a simple metric (Calef et al., 2014) based on image texture, i.e. maximum variation in digital number brightness over a 0.75x0.75m window, in comparison of HiRISE with SRR images, suggests that 6.25cm SRR images are less noisy and reveal more linear surface features.
Figure 8 Example of 25cm HiRISE image
ESP_028401_1755 (left) and 6.25cm SRR image (right) in the MSL Yellowknife bay and Shaler area.
Figure 9 surface roughnesses derived from image texture for the same area, showing maximum variations over a 0.75m*0.75m window of 25cm HiRISE (left) and 6cm SRR image (right).
By deriving a texture based roughness map, the subjective difference between HiRISE and SRR from [Figure 9] can be quantitatively visualised in [Figure 10]. SRR tends to be less noisy (lower roughness value) on the surface, whilst in the feature rich areas, sharper (higher roughness value) layer edges with better connectivity (less noisy) have revealed restoration on linear features.
3.3 Rock Frequency-size Distribution
We have studied the potential of SRR imagery to improve knowledge of rock size distributions, which is critical for understanding the surface formation history described in (Golombek et al., 2014) as well as the potential navigability of the surface. A preliminary rock frequency-size distribution analysis on SRR and original HiRISE image has also been described in (Tao & Muller, 2015a).
An example of automatically detected rocks counted from 25cm HiRISE image and 5cm SRR image around an impact crater The International Archives of the Photogrammetry, Remote Sensing and Spatial Information Sciences, Volume XLI-B4, 2016
larger than 150cm, there are 22 rocks detected from the original HiRISE image and only 1 rock detected in the range 50cm<diameter<150cm. On the other hand, in the SRR image, there were 33 rocks with diameter larger than 150cm, 111 rocks with 50cm<diameter<150cm, and 9 rocks with 30cm<diameter<50cm.
This experiment has demonstrated that there is a huge difference between the detectability of rocks in HiRISE and SRR with diameter smaller than 150cm. A large number of rocks, which are not visible for either automated detection and classification or manual measurement in the original HiRISE image, have been restored in GPT-SRR. However, how do these SRR rocks correlate with the “ground truth” of the Martian surface observed by the rovers? How many more rocks can GPT-SRR not resolve from repeat HiRISE images? We take the rock frequency-size distribution experiment further in this paper to involve comparison with both original HiRISE image and Navcam rover images at much more higher resolution.
3.4 Comparison with HiRISE and Navcam Mosaic
In this work, we look at rock frequency size distributions along the MSL rover traverse (from Sol 347 – Sol 549) to compare with 0.5cm (down-sampled to 2.5cm) MSL Navcam images from standard JPL-PDS RDR vertical projected mosaics. The 25cm HiRISE orthorectified image and 6.25cm SRR image are cropped for the same areas for comparison with 2.5cm Navcam mosaics. Rocks on a Navcam mosaic, HiRISE and SRR clips are automatically detected and counted w.r.t different radius clusters, using a similar method to (Tao & Muller, 2013).
The comparison result is preliminary and subject to: (a) mis-detections; (b) Navcam projection distortions; (c) mis-counts around the border of the Navcam coverage on HiRISE and SRR. There are also uncertainties on: (d) smaller rocks mixed together and clustered as 1 rock in lower resolution images; (e) Rock position changed during the interval of different HiRISE images and when MSL rover took the Navcam images.
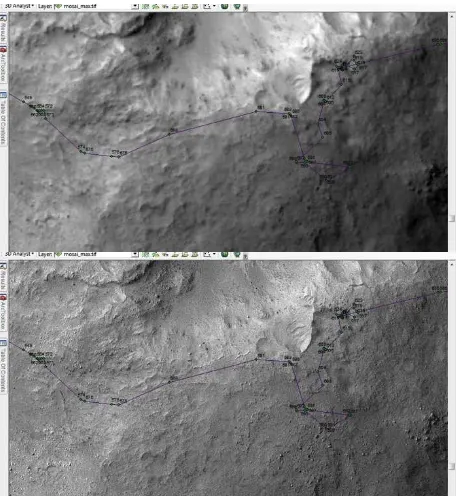
Figure 10 The 25cm HiRISE image
(ESP_018854_1755) at MSL Sol 549 showing automatically detected rocks (green) and the valid ROI (yellow) from Navcam vertical projected mosaic at the same area.
Figure 11 The 5cm SRR image at MSL Sol 549 showing automatically detected rocks (green) and the valid ROI (yellow) from Navcam vertical projected mosaic at the same area.
Figure 12 The 0.5cm MSL Navcam vertical projected mosaic (standard JPL RDR product) at Sol 549 (N_L000_0549_ILT027VRT_S_1004_UNCORM2) showing automatically detected rocks (green).
Figure 13 Accumulated rock numbers from HiRISE, SRR and Navcam within the same ROI at MSL Sol 549.
Figure 14 Accumulated rock number-size distribution for HiRISE, SRR, and Navcam at Sol 549.
[Figures 11-15] show examples of rock frequency-size distribution comparisons between 25cm HiRISE image, 6.25cm SRR image, and 0.5cm Navcam image in the same region at MSL Sol 549. The result has suggested: (a) 25cm HiRISE image is only able to resolve individual rocks with diameters larger than 100cm; (b) 6.25cm SRR image is able to resolve most of individual rocks with diameters larger than 50cm; (c) 6.25cm SRR image is able to resolve limited number of individual rocks with diameter smaller than 50cm and larger than 25cm; (d) there are still a large number of rocks with diameters smaller than 25cm appearing in Navcam image which cannot be captured or resolved from HiRISE and SRR.
Figure 15 Rock frequency-size distribution for HiRISE, SRR and Navcam at MSL Sol 347.
Figure 16 Rock frequency-size distribution for HiRISE, SRR and Navcam at MSL Sol 416.
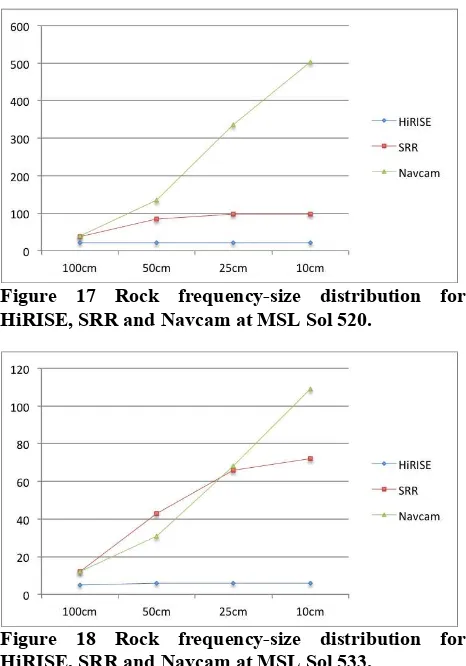
Figure 17 Rock frequency-size distribution for HiRISE, SRR and Navcam at MSL Sol 520.
Figure 18 Rock frequency-size distribution for HiRISE, SRR and Navcam at MSL Sol 533.
The rock size frequency-distribution comparison has been made for 5 regions along the MSL traverse in Sol 347, 416, 520, 533, and 549. Similar statistics [Figure 16-19] in Sol 347, 416, 520, and 533 have suggested: (a) the GPT-SRR algorithm is able to bring out individual rocks with size smaller than 100cm and larger than 30cm, which are not clear or unrecognizable in the original HiRISE image; (b) Accumulated rock numbers between 6.25cm SRR and 0.5cm Navcam mosaic have shown good correlation for rocks with size larger than 50cm and even 25cm in some cases. We have concluded that GPT-SRR presents huge potential for restoring semi-rover scale (Navcam range at ~5m) vision from ≥ 6 multi-angle repeated views, therefore HiRISE SRR can better support Martian surface studies where there is no rover data available and better support future rover path planning.
4. SUMMARY AND FUTURE WORK
4.1 Summary
Any planetary geologist or geo-morphologist is likely to have a strong interest in exploiting the highest possible resolution 3D image dataset. SRR will assist them greatly in formulating and testing hypotheses about planetary surface processes, as they will be able to apply their knowledge and understanding based on their terrestrial fieldwork. The high spatial resolution imaging data is an active driver for many applications, such as studying surface processes, which are not visible or not clear enough via known low-resolution data. Geologists can achieve The International Archives of the Photogrammetry, Remote Sensing and Spatial Information Sciences, Volume XLI-B4, 2016
used to produce SRR maps over MER and MSL mission. These SRR results have revealed new information including the imaging of individual rocks (diameterı25cm), potential lander targets, rover tracks, and improved surface roughness. This paper presented recent products from the GPT-SRR technique and provided additional quantitative assessment on the original algorithm (Tao & Muller, 2015a) by comparing SRR with original HiRISE image and Navcam rover imagery at a much higher resolution. Statistics from HiRISE, SRR, and Navcam measurement have been summarised and demonstrated the factors of 2-5x increase in resolution. We believe that the unique SRR datasets have huge potential in supporting geological and geomorphological analysis, monitoring of the Martian surface, and several critical engineering operations, such as landing site selection and rover path planning.
4.2 Processing Challenges
Currently owing to the very lengthy computation times of each SRR image tile (24-72 hours depending on different processing parameters, for a 2048x1024 tile with 8 input LR images running on a 16 core, 64 GB RAM Linux cluster), it is not yet feasible to apply SRR to full HiRISE images. SRR mosaics that covering MER and MSL rover traverses can be found on the PRoGIS 1.0 site (http://www.progisweb.eu) at UCL-MSSL. We have quoted a 23,040,000 CPU compute hours (using 22 cores) to be able to process ~400 HiRISE scenes with more than 5 repeat views. In iMars, we are seeking cloud-computing resources to be able to produce GPT-SRR with HiRISE full scenes.
4.3 Future Work
We are still optimizing the GPT-SRR algorithm to increase the SNR and reduce processing time. In-house modeling on specific issues like finding the best parameters, which images can and cannot be used, how many images from multiple viewing angles could yield certain enhancement factor, and what is the enhancement limitation from such approach, still require massive processing experiments.
At the moment, we plan to process ~400 HiRISE scenes that have more than 5 repeat views. We also plan to develop the capability for the ExoMars Trace Gas Orbiter 2016 CaSSIS instrument (from 4 up to İ1m/pixel) including both 3D and SRR from multiple overlapping colour stereos.
Finally, we believe that the technology developed here has huge potential, not only to other Solar System solid earth targets but also to the design of future missions, which will still be severely limited by telecommunications bandwidth but also by light travel time. We plan to optimize the existing processing pipeline to create a GPU powered automated processing system for super-resolution restoration of entire datasets and apply SRR to other planetary (non-Mars) bodies in the future.
ACKNOWLEDGEMENTS
The research leading to these results has received funding from the European Union’s Seventh Framework Programme (FP7/2007-2013) under iMars grant agreement n˚ 607379. This work has also received funding from the European Community's Seventh Framework Programme (FP7/2007-2013) under grant agreement No. 312377 PRoViDE.
REFERENCES
Calef, F.J., R. Arvidso, R. Sletten, R. Williams, and J. Grotzinger (2014) Surface Roughness Derived from HiRISE Visible Imagery: A Case Study At The MSL Landing Site, 45th Lunar and Planetary Science Conference, LPSC 2014 – 1614.
Golombek, M., J. Grant, D. Kipp, A. Vasavada, R. Kirk, R. Fergason, and et al. Selection of the mars science laboratory landing site. Space Science Reviews, 170(1-4): 641{737, 2012.
Paar, G., J.P. Muller, Y. Tao, T. Pajdla, M. Giordano, E. Tasdelen, I. Karachevtseva, C. Traxler, G. Hesina, L. Tyler, R. Barnes, S. Gupta, K. Willner (2015) PRoViDE: Planetary Robotics Vision Data Processing and Fusion, EPSC 2015 Vol. 10.
Tao, Y. and J.-P. Muller (2013) Automated science target selection for future mars rovers: A machine vision approach for the future ESA ExoMars 2018 rover mission. In proceeding of Geophysical Research Abstracts (EGU), volume 15.
Tao, Y., and J.-P. Muller (2015) A novel method for surface exploration: super-resolution restoration of Mars repeat-pass orbital imagery, Planetary and Space Science,
http://www.sciencedirect.com/science/article/pii/S00320633150 03591.
Tao, Y. and J.-P. Muller (2015) Towards a better understanding of Martian surface processes: zooming in for a quantitative assessment of key geomorphological features from super-resolution HiRISE images in comparison to overlapping rover Navcam image, EPSC 2015 Vol. 10.