Paediatrica Indonesiana
VOLUME 45 November - December • 2005 NUMBER 11-12
Original Article
From the Department of Child Health, Medical School, Diponegoro University, Kariadi Hospital, Semarang, Indonesia.
Reprint requests to: M. Mexitalia, MD, Department of Child Health, Jalan Dr. Sutomo 18, Semarang, Indonesia. Tel./Fax: 62-24-8414296.
E-The effect of soybean formula and
formula 100 supplementation on the growth
of preschool children
M Mexitalia, Yohanes Tri Nugroho, JC Susanto
M
oderate to severe wasting continues to be a public health problem in developing countries. In 1995, it has been estimated that 10.4% of preschool children in Southeast Asia were affected by wasting,1 but in China between1991-1997 the prevalence of underweight was 13-14.5%.2
An analysis of changes in the levels of childhood undernourishment found that the prevalence of stunted preschool children in Southeast Asia declined from 37.7% in 1995 to 32.8% in 2000 and it is estimated to decline to 27.9% in 2005.3
Food supplement is available for children during their preschool years, and should prevents them from wasting.1 Only a few studies have been conducted on
the importance of milk intake in preschool children, whereas milk is an important component for achiev-ing the total recommended level of energy intake.4
Several studies on food supplement for catch-up the growth have been conducted in Jamaica on 24 month-old children in 1993, in Thailand on 36 month-month-old children, in West Java on 6-20 month-old children,5
and in Italy on 1-10 year-old children using Rinforza®.6 ABSTRACT
Background Preschool children are vulnerable in growth. Soy-bean formula (SF) and formula-100 (F100) are supplementary foods which contain of high energy and are available at low price; how-ever, they are not widely used for preschool children.
ObjectivesTo investigate the effect of SF compared to F100 on the growth of preschool children.
MethodsA cross-over trial was conducted on 96 preschool chil-dren aged 4-7 years. Subjects were randomly divided into 2 groups which received 200 ml soybean formula (n=49) or F100 (n=47) for 1 month and crossed-over after a six-week wash-out period. Body weight was measured weekly. Body height and food analysis by 3-day food recall were measured at the beginning and the end of the study. The criteria of the acceptability of the formula was either good or poor.
ResultsSupplementation with SF as well as F100 induced catch up growth as shown by the increase of ∆z-score. There were no
significant difference of ∆ weight for age z-score, ∆ height for age
z-score, and ∆ weight for height z score between groups during
the first and second phases of the trial. The acceptability of F100 was significantly better than that of SF at the beginning; neverthe-less, the difference was not significant at the second phase trial.
ConclusionsSoybean formula and F100 given for a one month period can induce catch-up growth in preschool children. Soybean formula as an alternative health food can be accepted by preschool children [Pediatr Indones 2005;45:256-263].
The conclusion is that food supplement is capable for catch-up growth.
Currently, in the market, there are soybean for-mulas (SF) and standard formula. In the beginning, SF was used as a substitute to feed babies with cow’s milk allergy. The result is that these babies grew nor-mally. Other studies indicate that regular consump-tion of soy protein may reduce risks associated with obesity.7-9
Formula-100 (F100) is often used during the re-habilitation phase of severe malnourished children. The formula is easily prepared, with basic ingredients of dried skimmed milk, sugar, cereal flour, oil, and mineral mix. The formula can also be made from dried whole milk or full cream milk with the same amount of density, i.e.100
kcal/100 ml and 2.9 grams protein/100 ml.10,11 The use of F100 as well as SF as supplementation for normal chil-dren has not yet been reported. This study aimed to in-vestigate the effect of SF compared to F100 on the growth of preschool children.
Methods
A randomized, cross-over trial was conducted on 3 kindergarten schools. Minimum samples needed for 2 groups were 92 children. The schools were selected from a list of those with moderate to low socioeconomic status in the North Semarang and Tembalang sub-districts of Semarang city. This study
TABLE 1. SUBJECTS CHARACTERISTICS OF SF (GROUP A) AND F100 (GROUP B) IN FIRST PHASE OF TRIAL (BEFORE WASH-OUT PERIOD)
Characteristics
Height, before (cm) Height, after (cm)
Increment of height gain (cm) Weight, before (kg)
Weight, after (kg)
Increment of weight gain (kg) WAZ, before (SD)
WAZ, after (SD) Increment of WAZ gain HAZ, before (SD) HAZ, after (SD) Increment of HAZ gain WHZ, before (SD) WHZ, after (SD) Increment of WHZ gain Energy intake, before (kcal/day) Energy intake, after (kcal/day) Increment of energy intake (kcal/day) Protein intake, before (grams/day) Protein intake, after (grams/day) Increment of protein intake (grams/day) %RDA energy intake, before (kcal/day) %RDA energy intake, after (kcal/day) Increment of %RDA energy intake (kcal/day) %RDA protein intake, before (grams/day) %RDA energy intake, after (grams/day) Increment of %RDA energy intake (grams/day) Acceptability: Poor (%)
Good (%)
Note:
WAZ: weight for age z score HAZ: height for age z score WHZ: weight for height z score * Statistically significant
SF
was approved by the Ethical Clearance Committee prior to the study. Written informed consent was obtained from each child’s parents or legal guardian prior to enrollment.
There were 96 preschool children aged 4-7 years included in this study. The subjects were divided into two groups. Group A (Tembalang) received SF for one month, followed by a six-week wash-out period and then followed by F100 for one month. Group B (North Semarang) received F100 for one month, followed by a six-week wash-out period and then continued SF for one month. No formula was given during wash-out period.
Milk (SF or F100) was prepared by dieticians who were trained by the investigators, then measured, and afterwards distributed by cup with name tag. Each
child received 200 ml of milk everyday. Intake and acceptability were measured to the nearest 25 ml of each child everyday. Acceptability was good if the chil-dren drank more than 50% of the milk and poor if they drank less than 50% of milk.
Body weight was measured weekly by CEBA elec-tronic weighing scale. Height was measured by microtoise during the first and last day of each phase. These data were plotted on the WHO-NCHS z score. The social economy status was measured by Bistok Saing Scale. The parents or caregivers were asked to complete the questionnaires and a recall of food for 3 days. Children with allergy, intolerance, severe malnu-trition, obesity, severe infection, and handicap were ex-cluded. Children who were absent from school for more than 5 days were considered drop-outs. The weight TABLE 2. SUBJECTS CHARACTERISTICS ON SF (GROUP B) AND F100 (GROUP A)
IN SECOND PHASE OF TRIAL (AFTER WASH-OUT)
Characteristics
Height, before (cm) Height, after (cm)
Increment of height gain (cm) Weight, before (kg)
Weight, before (kg)
Increment of weight gain (kg) WAZ, before (SD)
WAZ, after (SD) Increment of WAZ gain HAZ, before (SD) HAZ, after (SD) Increment of HAZ gain WHZ, before (SD) WHZ, after (SD) Increment of WHZ gain Energy intake, before (kcal/day) Energy intake, after (kcal/day) Increment of energy intake (kcal/day) Protein intake, before (grams/day) Protein intake, after (grams/day) Increment of protein intake (grams/day) %RDA energy intake, before (kcal/day) %RDA energy intake, after (kcal/day) Increment of %RDA energy intake (kcal/day) %RDA protein intake, before (grams/day) %RDA energy intake, after (grams/day) Increment of %RDA energy intake (grams/day) Acceptability: Poor (%)
Good (%)
Note:
WAZ: weight for age z score HAZ: height for age z score WHZ: weight for height z score
SF
for age z score (∆WAZ), ∆ height for age z score (
∆HAZ), and ∆ weight for age z score (∆WHZ)
be-tween groups were compared by Student t-test or Mann-Whitney test when the data was not normally distrib-uted. Difference of acceptance level was analyzed by chsquare test. P<0.05 was considered as significant.
Results
The study was conducted in 2 phases, the first phase was before the wash-out period and the second one was after it. One hundred and thirteen children aged 4-7 years were enrolled. During the first phase, 17 children dropped-out due to moving to another school, 7 children refused to participate and 10 children were absent from school for more than 5 days. Therefore there were only 96 children left in the study (49 boys and 47 girls). At the second phase, all 96 children completed the study. Forty-nine children belonged to group A who received SF followed by F100 after wash-out, and 47 children belonged to group B
who received F100 at the first phase followed by SF after wash-out. The mean age of the children was 67 months. Using Bistok Saing Scale for socioeconomic status, 42.7 % were of low socioeconomic status, 46.9% of moderate socioeconomic status, and 10.4 % of high socioeconomic status.
The characteristics of the children at the first phase is shown on Table 1, where 49 children from group A received SF and 47 children from group B received F100, both groups for one month. There was an increase of growth in both groups. Statistical analy-sis showed that there was no significant difference ei-ther in weight gain or in increment of WHZ, WAZ, and HAZ (P>0.05). On the other hand, F100 supple-mentation was better compared to the SF regarding the child height gain (0.5 cm versus 0.4 cm, P<0.05). Protein intake of the SF was 7.2 grams/day significantly higher than that of F100 group which was 3.1 grams/ day (P<0.05). The increment also depended on the energy intake, % recommended dietary allowance (RDA) energy intake and %RDA protein intake, but was not statistically significant. The acceptability of
2 3
Measurement
1 4
-1.60 -1.50 -1.40 -1.30 -1.20
WA
Z
Wash-out
A
B
FI G U R E 1. GR O W T H M E A S U R E D B Y WAZ D U R I N G SUPPLEMENTATION AND WASH-OUT PERIOD. BOLD-DASHED LINE REPRESENTS SF GROUP AND INTACT LINE REPRESENTS F100 GROUP.
FI G U R E 2. GR O W T H M E A S U R E D B Y HAZ D U R I N G SUPPLEMENTATION AND WASH-OUT PERIOD. BOLD-DASHED LINE REPRESENTS SF GROUP AND INTACT LINE REPRESENTS F100 GROUP.
3
1 2 4
-1.80 -1.60 -1.40 -1.20 -1.00
HAZ
Measurement Wash-out
A
F100 was significantly better compared to SF on the first phase (P<0.001).
In the second phase after a six-week wash-out period, 49 children from group A received F100 and
47 children from group B received SF for one month. There was an increase in growth, energy, and protein intake, as well as %RDA for both energy and protein in both groups. But the analysis showed no signifi-cant difference. It also showed that there was no sig-nificant difference in the acceptability between F100 and SF.
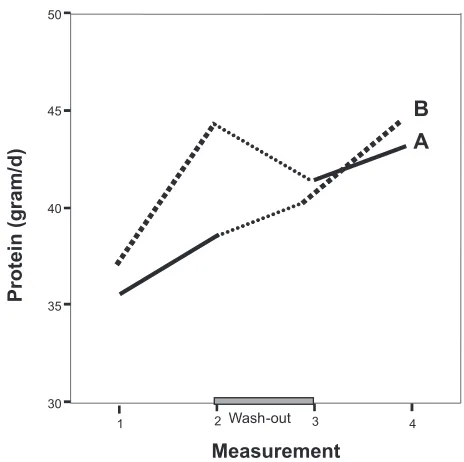
Figure 1,2,3,4, and 5 show that in group A, the WAZ, HAZ, and WHZ, energy and protein in-take, respectively, increased during the supplementa-tion, both before and after out. During the wash-out period, the WAZ, HAZ, WHZ, energy and pro-tein intake decreased. In group B, the WAZ and WHZ increased during supplementation but decreased dur-ing the wash-out period. Meanwhile, the HAZ, en-ergy and protein both increased during supplementa-tion period as well as during the wash-out period.
Figure 4 and Figure 5 show that in group B, an increase of energy intake and protein intake occurred both during supplementation and wash-out period, but the increase is lower during the wash-out period. While in the group A, there was an increase during supplementation but during wash-out period, it de-creased.
No harmful effect was found in F100 as well as SF supplementation.
FIGURE 3. GROWTH MEASURED BY WHZ DURING SUPPLEMENTATION AND WASH-OUT PERIOD. BOLD-DASHED LINE REPRESENTS SF GROUP AND INTACT LINE REPRESENTS F100 GROUP.
1 2 Wash-out 3 4
Measurement
-1.10 -1.00 -0.90 -0.80 -0.70 -0.60
WH
Z
B
A
FIGURE 5. DAILY PROTEIN INTAKE DURING SUPPLEMENTATION AND WASH-OUT PERIOD. BOLD-DASHED LINE REPRESENTS SF GROUP AND INTACT LINE REPRESENTS F100 GROUP.
2 3
40 45
1 4
Measurement
30 35 50
Prot
ei
n
(g
ram
/d
)
Wash-out
B
A
2 3
1 4
Measurement Wash-out
1000 1200 1400 1600
En
erg
y
(kcal
/d
)
A B
Discussion
Supplementation with SF as well as F100 induced catch-up growth shown by the increase of ∆z-score. At the first phase, supplementation with SF for one month increased weight by 200 grams, height 0.4 cm,
∆WAZ 0.03, ∆HAZ 0.01, and ∆WHZ 0.05. On the other hand, supplementation with F100 caused weight gain 200 grams, height 0.5 cm, ∆WAZ 0.03, ∆HAZ 0.03, and ∆WHZ 0.03. At the second phase, after the wash-out the increase was better. The weight gain in SF supplementation group was 400 grams, height gain 0.4 cm, ∆WAZ was 0.10, ∆HAZ was 0.03, and ∆WHZ was 0.16. Supplementation with F100 gained weight by 400 grams, height 0,5 cm, ∆WAZ 0.14, ∆HAZ 0.02, and ∆WHZ 0.20.
Many studies about supplementation which in-volved children older than three years did not show accelerated catch up growth.1 Supplementation with
high fat or high carbohydrate biscuits given to 30 stunted but not wasted Gambian children 3-9 years of age also induced catch-up growth. Each children re-ceived biscuits containing approximately 1600kJ for as long as 12 months. The results showed that neither fat nor carbohydrate supplement had a significant influ-ence on growth. The high fat supplement did slightly increase adipose tissue mass. The reasons for this re-mains unclear.12 Meanwhile, in Italy, a 4-month
supple-mentation with Rinforza®(Pediasure®) of 174 chil-dren aged 12 months to 10 years showed a decrease of risk for malnutrition (weight-for-height below the 25th
percentile). Although the differences were not statisti-cally significant after 2 months, they were statististatisti-cally significant after 4 months.4 Our study showed good
re-sults after a one-month supplementation with SF and F100. In Guatemala, a 6-month supplementation with Atole® (a drink with high protein and moderate en-ergy content) on children aged 6-24 months with weight-for-length between 90% and 99.9%, showed sig-nificantly good results in preventing malnutrition (the attributable prevention ranged from 0.21 to 0.26). Meanwhile, there was only little effect of Atole® in the older age group (24-48 months). The attributable prevention values ranged between 0.06 and 0.11.1
Another study of a 4-month oral nutritional supple-mentation with or without synbiotics in children aged 1-6 years old, showed that both could induce catch-up growth and prevent malnutrition.13
In our study, the increase of energy and protein intake was also good. The increase of the energy in-take from RDA of FS group before the wash-out was an 8% increase of energy intake and 7% of protein intake. From F100, before wash-out was 12% and pro-tein intake was 12%. After the wash-out, increase of energy and protein intake were 8.6% and 6%, respec-tively, using SF supplementation and 12% energy in-take and 11% energy inin-take using SF. In Sweden, the role of milk in preschool lunch meals has been de-bated frequently and water is often alternatively given. A study was done on 36 children aged 4–6 years, and water or milk was served alternatively. When milk was given with meals, a mean additional energy intake of 17% (P<0.0001) was found.4 In USA, traditional and
soy-enhanced lunches were randomly assigned to re-spective days on preschool children aged 3-6 years. There were no significant differences in energy val-ues served for traditional compared to soy-enhanced lunches. However, protein was significantly higher in the soy-enhanced lunches,8 which was similar to our
study.
Food supplementation can influence energy and protein intake. During the wash-out period, the intake of energy and protein was less or even de-creased. A study in Iran, which assessed the im-pact of nutritional education on growth, found that educational interventions involving parents and/ or other family members might play a role in in-creasing the children’s energy and protein intake. Therefore, it is important to give supplementation as well as nutritional education,14 which was not
done in our study.
There was no significant difference in catch-up growth which was measured by means of ∆WAZ,
∆HAZ, and ∆WHZ between SF and F100 group. There was also no significant difference between en-ergy intake, however protein intake before the wash-out period was significantly different. The increase of protein intake was not followed by the difference in growth. This maybe due to the Protein Efficacy Ratio (PER) of soybean 2.3 while cow milk formula 2.5 and the Net Protein Utilization (NPU) Formula 63 while cow’s milk formula 80.9 The Food and Agriculture
com-parison in roughly assessing the quality of food pro-teins and protein mixtures by calculating an amino acid score. The amino acid score of cow’s milk is 100 and soybean is 82.14 Soybean had a good protein en-ergy ratio of 19.1 as well as cow’s milk 20.3,15 how-ever, the total nitrogen loss of soybean is higher than that of cow’s milk.16 The digestibility coefficient of total nitrogen in soybean 0.90, meanwhile cow’s milk 0.95.17
The acceptability of F100 is better than that of soybean formula with significant difference before the wash-out period. After the wash-out period there was no significant difference of acceptability. Although F100 was more acceptable, there is no significant dif-ference in inducing the catch-up growth of the chil-dren. The change in food acceptance develops slowly in young children, with numerous exposures neces-sarily before clear acceptance is shown8 and it is strongly tracked over periods of 19 months to more than 6 years.18 Preschoolers are still developing taste and smell preferences for that they may be more likely to try and accept soy products more than older chil-dren which is why introducing soybean formula as an alternative healthy feeding to this population may be successful in establishing a preference for health-pro-moting foods.8
In conclusion, soybean formula and F100 given for a- one -month period can induce catch-up growth in preschool children. Soybean formula as an alternative to health food can be accepted by preschool children.
Acknowledgments
We are grateful to Otsuka Co. Ltd, Indonesia for support on research conducting. We thank Mrs. Tatik Mulyati, DCN, MKes from Department of Nutrition, Kariadi Hospital for assisting on diet preparation, and Hardian, MD from Department of Physiology, Medical School, Diponegoro University for his contribution to statistical analysis.
References
1. Rivera JA, Habicht JP. Effect of supplementary feeding on the prevention of mild-to-moderate wasting in con-ditions of endemic malnutrition in Guatemala. Bulle-tin of the WHO 2002;80:926-32.
2. Wang Y, Monteiro C, Papkin B M. Trends of obesity and underweight in older children and adolescens in United States, Brazil, China and Russia. Am J Clin Nutr 2002;75:971-2.
3. De Onis M, Frongillo EA, Blossner M. Is malnutrition declining? An analysis of changes in levels of child mal-nutrition since 1980. Bulletin of the WHO 2000;78:1222-33.
4. Hägg A, Jacobson T, Nordlund G, Rössner S. Effects of milk or water on lunch intake in preschool children. J Appetite 1998;31:83-92.
5. WHO. Complementary feeding of young children in developing countries: A review of current scientific knowledge. Geneva; 1998.
6. Fiore P, Castagnola E, Merolla R. Effect of nutritional intervention on physical growth in children at risk of malnutrition. Int Ped 2002;17:179-83.
7. Businco L, Bruno G, Giampietro PG. Soy protein for the prevention and treatment of children with cow-milk allergy. Am J Clin Nutr 1998;68(Suppl):1447S-52S.
8. Endres J, Barter S, Theodora P, Welch P. Soy-enhanced lunch acceptance by preschoolers. J Am Diet Assoc 2003;103:346-51.
9. Klish WJ. Soy protein-based formulas: Recommenda-tion for use in infant feeding. Am Acad Ped 1998;102: 148-53.
10. WHO. Management of severe malnutrition: A manual for physicians and other senior health workers. Geneva; 1999.
11. WHO. Introduction: Management of severe malnu-trition. Geneva; 2000.
12. Krähenbühl JD, Schutz Y, Jëquier E. High fat versus high carbohydrate nutritional supplementation: A one year trial in stunted rural Gambian children. Eur J Clin Nutr 1998;50:213-22.
13. Fisberg M, Maulén-Radován IE, Tormo R, Carrascoso MT, Giner CP, Martin FA, et al. Effect of oral nutri-tional supplementation with or without synbiotics on sickness and catch-up growth in preschool children. Int Pediatr 2002;17:216-22.
14. Salehi M, Kimiagar SM, Shahbazi M, Mehrabi Y, Kolahi AA. Assessing the impact of nutrition education on growth indices of Iranian nomadic children: An appli-cation of modified beliefs, attitudes, subjective-norms, and enabling-factors model. Br J Nutr 2004;91:779-87.
diet therapy. 8th ed. Philadelphia: WB Saunders Co.; 1992. p. 64-9.
16. Prawirohartono EP. Nutrien dan angka kecukupan gizi yang dianjurkan. 1st ed. Yogyakarta: BP-FK UGM; 1997. p. 1-19.
17. Tome D, Bos C. Dietary protein and nitrogen utiliza-tion. J Nutr 2000;130:1868S-73S.