URBAN DEVELOPMENT AND SPATIAL
PLANNING OF GREATER JAKARTA
Wilmar Salim
Objectives
To provide a comprehensive overview of past and
present spatial planning and urban development in
the Jakarta Metropolitan Region (JMR)
To provide summary of spatial planning and urban
development activities in the JMR
To follow the continuing decentralization of population
out of DKI into the surrounding suburbs
To give examples of how urban planning is not followed
Methods
JMR planning: overview of 1965-1990 and
1990-2012 plans discussion of spatial structure
Population density analysis by subdistrict, year
2000 and 2010, with maps and gradient
Employment density analysis, only year 2000
available at subdistrict level
Jabotabek’s Dynamic Development –
Henderson, Kuncoro, and Nasution (1996)
Rapidly changing allocation of residences and business,
following expected development patterns, 1980s to 1990s
High population density: lower density in the core, densification of
periphery and urban sprawl in the fringe
Urban development hindered by poor land market institutions
(weakly defined property rights, lack of active land use planning,
low infrastructure investment)
Manufacturing industrialization on Botabek with low land price
and wages
Multi-centered development: loss of monocentricity in Jakarta,
increased concentration outside Jakarta
Hurting small scale industry
Spatial mismatch: low income workers’ residences separated from
Planning practices in Jakarta
Unilateral effort by
certain group of
people who don’t gain
a lot of supports from
major stakeholders
Resembles practices
that happened during
Batavia era
Continuing inadequacy of
governance and planning
arrangements
Advisory non-binding
metropolitan planning
Increases risks to economic
and environmental
sustainability
JMR Planning in the Beginning (1965 to 1985):
Original, Visionary, Problem-oriented, Not executed
Master Plan of Jakarta 1965-1985:
“planning” region (Jakarta and regions with direct
impact) vs “administrative” region (larger than DKI
Jakarta, smaller than Jabodetabek) discussion only
On transportation: new rail-based rapid transit system,
including subway, to be built by 1980 never been
implemented
On proposed land use and density
On flood management
Proposed Land Use and Population Density in 1985
Industrial areas on the East and western cooridors, residential areas at the center toward the West
High density at center and Northeast, decrease gradually toward the West
Industrial zone on the East (Cakung-Cilincing) is accompanied by high population density (400 pph) in Tj. Priok and Koja, supposedly to house the workers
Flood zone and flood management plan
West: Tebet, Palmerah, Grogol
Petamburan, Tambora, Penjaringan
East: Kemayoran, Senen, Pulo
Gadung, Tj. Priok, Koja
Waduk: Pluit, Melati, Setiabudi, Tebet,
Pulomas, Jelambar, Parung Bodoh
Canal: East-West and North-South
JMR Planning in the Later Period (1985 to 1995):
Discontinuation, Private sector-driven
Spatial General Plan of Jakarta 1985-2005:
East-West development axis, not to the South
On transportation: no rail-based transit system, dedicated
double-decker bus lane
On flood: Depok Dam to anticipate 100-year flood, Cengkareng
West Flood Canal, East Flood Canal
Presidential Decrees 1989 – 1995:
Management of industrial estates to East (Bekasi) and West
(Tangerang)
Development of Teluk Naga, Tangerang
Reclamation of North Coast of Jakarta (Pantura)
Spatial Plan of Jakarta 1995-2010 (1997):
Accommodating reclamation of Pantura
Urban Development: Population Dispersion
City/District Size (ha) Population (in thousand) Density (pop/ha) 1990 2000 2010 1990 2000 2010 DKI Jakarta 65,704 8,222.5 8,347.1 9,588.2 126.13 128.04 145.93 Bogor 11,850 271.3 750.8 949.1 22.89 63.36 80.09 Depok 20,029 - 1,143.4 1,736.6 - 57.09 86.70 Tangerang 16,455 - 1,325.8 1,797.7 - 80.57 109.25 Bekasi 21,049 - 1,663.8 2,336.5 - 79.04 111.00 Kab. Bogor 266,383 3,736.2 3,508.8 4,763.2 11.71a 11.74 17.88 Kab. Tangerang 111,039 2,765.0 2,781.4 4,142.3 19.33a 22.80 37.30 Kab. Bekasi 114,779 2,104.4 1,668.5 2,629.5 15.93a 15.03 22.91 Jabodetabek 627,288 17.099.4 21,191.7 27,943.0 25.48 37.63 44.55
JMR Core Area Population
City/District Size
(ha) Population (000)2000 2010 Population (%)2000 2010 Density (pop/ha)2000 2010
Jakarta Pusat 4,813 875.5 898.9 10.49 9.37 181.9 186.7 Jakarta Barat 12,919 1,895.9 2,278.8 22.71 23.77 146.7 176.4 Jakarta Utara 14,624 1,414.7 1,645.3 16.95 17.16 102.9 119.6 Jakarta Timur 18,775 2,340.8 2,687.0 28.04 28.02 124.7 143.1 Jakarta Selatan 14,573 1,784.4 2,057.1 21.38 21.45 122.4 141.2 Kep. Seribu 870 17.2 22.7 0.21 0.24 19.8 24.2 DKI Jakarta 65,704 8,347.1 9,588.2 128.04 145.93
Growing and densifying, but decreasing proportion of
Jakarta Pusat and Jakarta Timur
Subdistrict Analysis: Depopulation (Core)
Depopulation 1990-2000:
Jakarta Pusat: Tanah Abang, Menteng, Senen, Cempaka Putih,
Kemayoran, Sawah Besar, and Gambir
Jakarta Barat: Palmerah, Grogol Petamburan, Tambora, and
Taman Sari
Jakarta Timur: Jatinegara, Pulo Gadung and Matraman
Jakarta Selatan: Kebayoran Lama, Kebayoran Baru,
Pancoran, Tebet, and Setia Budi
depopulation of Jakarta Pusat and Selatan, but not
Jakarta Barat and Timur
Depopulation 2000-2010: Menteng, Sawah Besar and
Subdistrict Analysis: Population increase (Core)
Major contributors in 2000:
Jakarta Barat: Kalideres, Cengkareng, Kebon Jeruk, and
Kembangan
Jakarta Timur: Cakung, Cipayung and Caracas
Major contributors in 2010:
Jakarta Pusat: Kemayoran and Tanah Abang;
Jakarta Barat: Cengkareng, Kalideres, Kembangan, and
Kebon Jeruk;
Jakarta Utara: Cilincing and Penjaringan;
Jakarta Timur: Cipayung and Cakung; and
Jakarta Selatan: Jagakarsa
Subdistrict Analysis: Change in Density Level (Core)
Density level 1990 2000 2010
>400 pph Johar Baru and Tambora Johar Baru and Tambora
Johar Baru and Tambora
300 – 400 pph Matraman, Kemayoran, Senen - Matraman
200 – 300 pph Tanah Abang, Sawah Besar, Palmerah, Grogol Petamburan, Jatingeara, Tebet Senen, Kemayoran, Palmerah, Jatinegara, Matraman, Tebet Senen, Kemayoran, Palmerah, Grogol Petamburan, Koja, Kramat Jati, Jatinegara, Tebet < 100 pph Kembangan, Kb Jeruk, Cengkareng, Kalideres, Penjaringan, Klp. Gading, Cilincing, Kep. Seribu, Psr Rebo, Ciracas, Cipayung,
Makasar, Cakung, Jagakarsa, Ps. Minggu, Cilandak, Pesanggrahan Kembangan, Penjaringan, Klp. Gading, Cilincing, Kep. Seribu, Cipayung, Makasar, Jagakarsa, Cilandak Penjaringan, Klp. Gading, Cilincing, Cipayung, Makasar, Kep. Seribu
Subdistrict Analysis: Densification (Periphery)
Density level 1990 2000 2010
100 – 200 pph - Bogor Tengah; Ciledug, Batuceper; Bekasi
Timur, Bekasi Selatan, Bekasi Utara
Bogor Tengah, Tanah Sereal; Pancoran Mas, Sukmajaya, Beji; Ciledug, Larangan, Karang
Tengah, Cipondoh, Karawaci, Cibodas, Periuk, and Benda;
Pondok Gede, Bekasi Timur, Rawa Lumbu, Bekasi Selatan, Bekasi Barat, Medan Satria, and Bekasi Utara; Pamulang, Ciputat, Ciputat Timur, and Pondok Aren
In 2000: 46 out of 135 subdistricts (34%) had density >100 pph.
In 2010: 69 out of 179 subdistricts (38%) from 23, 20 are
outside Jakarta (Bogor, Depok, Tangerang, Bekasi, and Kab.
Tangerang; 3 are inside (Kembangan, Jagakarsa and Cilandak)
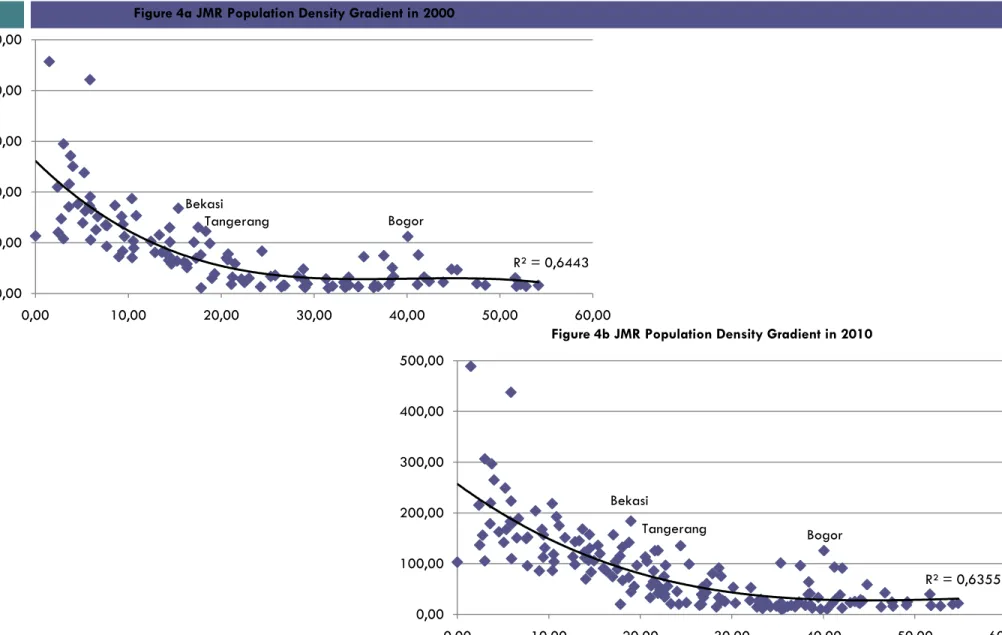
Population Density Gradient 2000 and 2010:
from slope to flattening, with distance from Monas
Bekasi Tangerang Bogor R² = 0,6443 0,00 100,00 200,00 300,00 400,00 500,00 0,00 10,00 20,00 30,00 40,00 50,00 60,00 Figure 4a JMR Population Density Gradient in 2000
Bekasi Tangerang Bogor R² = 0,6355 0,00 100,00 200,00 300,00 400,00 500,00 0,00 10,00 20,00 30,00 40,00 50,00 60,00 Figure 4b JMR Population Density Gradient in 2010
Subdistrict analysis: Employment Density in 2000
Similar to population density Manufacture toward West
Built-up Area Growth 1983-2005
Built-up areas in
Jabodetabek in 2005
doubled the size in 1992
28% of land is built-up
Largest conversion in Kab.
Bogor, Tangerang, Bekasi
22 new town projects in
land between 500 and
6,000 ha in 1996; 8
industrial estates in land
between 100 and 540 ha
in 1994, in Kab. Bogor,
Tangerang and Bekasi
Jakarta metropolitan area growth between 2000-2010;
(Schneider, A. et al., forthcoming)
From 1105 km
2
in 2000
to 1444 km
2
in 2010
Recent Planning – RTRW Jabodetabekpunjur
9 radial PKN centered in DKI Jakarta: Bekasi, Tambun,
Setu, Cileungsi, Cimanggis, Depok, Cinere, Serpong,
Tangerang, plus Bogor: what activities and investments?
On public transportation: rail-based mass transit system
and mass rapid transit system integrated with prioritized
bus, monorail, and other modes: what routes and stations
On flood: Limo Dam (Pd. Cabe
Pesanggrahan),
Genteng Dam (South Bogor Cisadane), Narogong
Dam (Jonggol
Cikarang): what about for Ciliwung?
Spatial Pattern Plan of Jabodetabekpunjur (Perpres
54/2008)
Recent Planning – RTRW DKI Jakarta 2030
For 12.5 million population: 9.2% Central, 18.6%
North, 24.1% East, 22.6% South, 25.3% West, and
0.2% Kep. Seribu
Reclamation of Jakarta North Coast (Pantura)
On public transportation:
Mass Rapid Transit (Lb. Bulus-Dukuh Atas-Kota) &
East-West line
Light Rail Transit, Inner ring rail, commuter rail, airport rail
15 busway corridors, elevated BRT (Setia Budi-Tn Abang)
On flood: Cengkareng Drain II, connecting West Flood
Canal to East Flood Canal, sea wall at minimum -8 m
under sea level
Spatial Pattern Plan of DKI Jakarta (Perda
1/2012)
P5
P3
Flood zone and flood management: leaving out
population in the South and the poor?
Flood zone and flooded area on Jan
18, 2013
Existing and proposed polders Sea wall, 57 dams, 17 ponds
Summary on Urban Development
Depopulation remains in Menteng, Sawah Besar, Gambir
Gentrification in other subdistricts, especially Matraman,
Palmerah, Grogol Petamburan and Kebayoran Lama
Densely populated subdistricts remain the same but other
subdistricts have been more populated, including those at the
center of
Bogor, Tangerang, Bekasi, Depok
, as well as in Kab.
Tangerang
Other PKNs are not as developed as other subdistricts
Employment density follows population, but manufacturing
employment concentration is to the West, while trade and
services at the center
Rapid urban development on Botabek has extended towards
Conclusions
Planning practice not supported by stakeholders:
Implementation: financial, technical, political, etc
Discontinuation: new leaders have different ideas
Coordination: central vs regional government
Disconnect between plan and reality?
Plan couldn’t keep up with organic development: urban
development going to different direction not as planned,
driven by private interests