Informasi Dokumen
- Penulis:
- Rachel Schutt
- Cathy O’Neil
- Sekolah: Columbia University
- Mata Pelajaran: Data Science
- Topik: Doing Data Science
- Tipe: ebook
- Tahun: 2014
- Kota: Sebastopol
Ringkasan Dokumen
I. Introduction: What Is Data Science?
This introductory chapter tackles the central question: "What is data science?" It begins by acknowledging the prevalent hype surrounding "Big Data" and data science, highlighting the ambiguity of key terms and the lack of clear definitions. The authors express a shared skepticism, emphasizing the need for a more rigorous and impactful approach to the field. They address criticisms about the lack of recognition for prior work in statistics, computer science, and related disciplines. The chapter then shifts to exploring what sets the current data science landscape apart from previous eras.
1.1 Big Data and Data Science Hype
This section directly confronts the prevalent hype surrounding Big Data and data science. It lists several key criticisms: the lack of clear definitions for core terms (Big Data, data science); insufficient credit given to the foundational work of statisticians, computer scientists, and other researchers; excessive and potentially misleading hype creating unrealistic expectations; a perceived threat to the established field of statistics; and the general skepticism towards anything self-proclaimed as a "science". The authors emphasize their shared skepticism and position this as a starting point for contributing to the field's legitimacy and positive societal impact.
1.2 Getting Past the Hype
This section outlines the authors' journey from initial skepticism to embracing the potential of data science. It uses Rachel's transition from a PhD in statistics to a data science role at Google as a case study. While acknowledging the inevitable gap between academia and industry, the authors argue that the differences extend beyond simple industry adaptation. The experience highlights a need for a new process, the "data science process", drawing from both statistics and computer science, and a wider body of knowledge and methodology not typically found in traditional academic settings. The chapter concludes by framing data science as a nascent and potentially transformative field requiring careful consideration.
1.3 Why Now?
This section explains the confluence of factors driving the current data science boom. The availability of massive datasets and inexpensive computing power are central. The datafication of both online and offline activities is emphasized, highlighting the pervasive nature of data collection. The authors discuss the creation of data products—recommendation systems, financial models, and personalized learning platforms—and the resulting feedback loops between data, technology, and human behavior. The chapter stresses the ethical and technical implications of these feedback loops and sets the stage for further discussion throughout the book.
1.4 Datafication
This subsection introduces the concept of datafication, defined as the process of transforming all aspects of life into data. Examples include Google Glass datafying gaze, Twitter datafying thoughts, and LinkedIn datafying professional networks. The authors explore the spectrum of intentionality in datafication, ranging from conscious participation in social media experiments to passive data collection through cookies and surveillance. This section raises questions about the implications of datafication and whose interests are primarily served by the process, highlighting a key theme of ethical considerations in data science.
1.5 The Current Landscape (with a Little History)
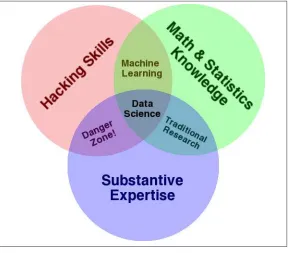
This section delves into the ongoing debate about the nature of data science. It examines existing perspectives from various online discussions, citing responses from Quora and blog posts that compare and contrast data science with statistics and machine learning. The section presents different viewpoints, including the perspective that data science is simply a rebranding of existing statistical methods, and the counterargument that it represents a distinct field with its unique processes and applications. Drew Conway's Venn diagram is referenced as a visual representation of the intersection of different skills within data science. The authors’ goal is to frame the current discussion about the field's identity and to set the stage for a deeper exploration.
II. Statistical Inference, Exploratory Data Analysis, and the Data Science Process
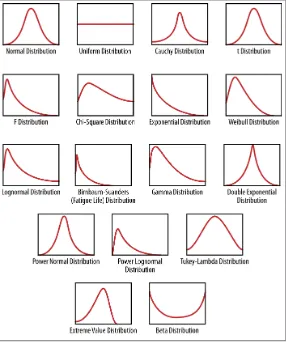
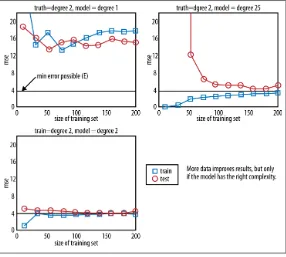
Chapter 2 lays the groundwork for understanding the data science process. It begins with a discussion of statistical inference and its relevance in the age of Big Data. The chapter explores the concepts of populations and samples, and how these relate to Big Data. It emphasizes that Big Data can lead to significant assumptions, requiring careful consideration. The chapter also introduces exploratory data analysis (EDA) as a crucial step in the data science process, highlighting its philosophical underpinnings.
III. Algorithms
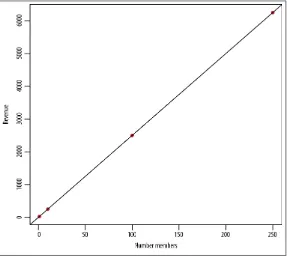
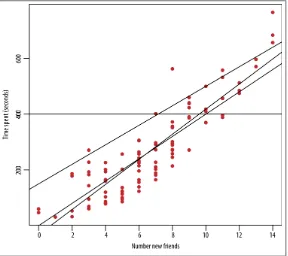
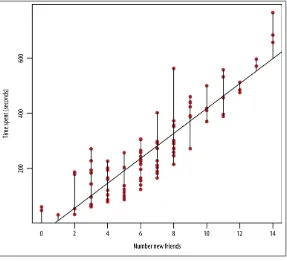
Chapter 3 delves into the core of data science algorithms. It introduces machine learning algorithms, focusing on three fundamental ones: linear regression, k-Nearest Neighbors (k-NN), and k-means. Each algorithm is explained with sufficient detail to provide a solid understanding of its mechanics and application. The chapter includes exercises to reinforce learning and encourage practical application of the concepts.
IV. Spam Filters, Naive Bayes, and Wrangling
This chapter applies the algorithms learned in the previous chapter to a real-world problem: spam filtering. It explains why simple algorithms like linear regression are unsuitable for this task and introduces the Naive Bayes algorithm as a more effective alternative. The chapter covers Bayes' theorem and demonstrates how it can be used to build a spam filter. It also touches on techniques like Laplace smoothing to improve the filter's performance and discusses web scraping and APIs as tools for data acquisition.
V. Logistic Regression
Chapter 5 focuses on logistic regression, a crucial algorithm for classification problems. It explores the underlying mathematics, including estimation of parameters and optimization techniques like Newton's method and stochastic gradient descent. The chapter incorporates a case study to illustrate its practical application and includes exercises to encourage hands-on experience.
VI. Time Stamps and Financial Modeling
Chapter 6 explores the use of time stamps in data analysis, focusing on applications in financial modeling. It incorporates a real-world case study and introduces key concepts like log returns, volatility measurement, and exponential downweighting. The chapter also discusses the importance of in-sample and out-of-sample analysis and the challenges of establishing causality in financial data.
VII. Extracting Meaning from Data
Chapter 7 focuses on feature selection, a crucial step in building effective models. It explores different techniques like filters, wrappers, and embedded methods using decision trees and random forests. The chapter discusses the trade-off between interpretability and predictive power and provides a real-world example of user retention modeling.
VIII. Recommendation Engines: Building a User-Facing Data Product at Scale
This chapter delves into the construction of recommendation engines, focusing on the practical challenges of building such systems at scale. It reviews the nearest neighbor algorithm, discussing its limitations, and introduces more sophisticated techniques like singular value decomposition (SVD) and alternating least squares. The chapter addresses the dimensionality problem and explores the concept of filter bubbles.
IX. Data Visualization and Fraud Detection
Chapter 9 explores the importance of data visualization in data science, tracing its history and highlighting its role in communication and insights generation. It includes examples of data visualization projects, and discusses its use in fraud detection, particularly in the context of a case study from Square.
X. Social Networks and Data Journalism
This chapter discusses social network analysis (SNA) and its applications in understanding complex social systems. It covers key terminology, centrality measures, and models for representing networks. The chapter also explores the intersection of data science and data journalism, providing insights and advice for effective technical writing.
XI. Causality
Chapter 11 delves into the crucial topic of causality, emphasizing the distinction between correlation and causation. It discusses various methods for establishing causality, including randomized clinical trials and observational studies. The chapter introduces the Rubin Causal Model and provides guidance on asking causal questions and visualizing causal relationships.
XII. Epidemiology
This chapter explores the intersection of data science and epidemiology. It highlights the challenges of causal inference in observational studies and discusses the issue of confounding variables. The chapter presents a real-world example of a research experiment aimed at addressing confounding issues in medical research.
XIII. Lessons Learned from Data Competitions: Data Leakage and Model Evaluation
Chapter 13 uses data mining competitions as a context to teach critical lessons in data science. It discusses the problem of data leakage and how to avoid it. The chapter also emphasizes the importance of proper model evaluation, going beyond simple accuracy metrics and considering the implications of probabilities in model predictions.
XIV. Data Engineering: MapReduce, Pregel, and Hadoop
Chapter 14 covers essential data engineering concepts and technologies. It introduces MapReduce, Pregel, and Hadoop, explaining their roles in processing and managing large-scale datasets. The chapter emphasizes the practical aspects of data engineering and the workflow involved in handling big data.
XV. The Students Speak
This chapter offers student perspectives on their experiences in the "Introduction to Data Science" course. It provides valuable insights into the learning process and highlights the practical applications of the concepts covered in the book.
XVI. Next-Generation Data Scientists, Hubris, and Ethics
The concluding chapter discusses the future of data science, focusing on the skills and qualities needed for next-generation data scientists. It emphasizes the importance of problem-solving, soft skills, and ethical considerations in the field, offering career advice for aspiring data scientists.