WORKING ENVIRONMENT, JOB CHARACTERISTICS, AND JOB
MOTIVATION ON LECTURERS’ JOB SATISFACTION: A CASE STUDY
AT ONE PUBLIC UNIVERSITY
RosmiatiFaculty of Teacher Training and Education, Jambi University, Indonesia
Ekawarna
Faculty of Teacher Training and Education, Jambi University, Indonesia
Eddy HARYANTO
Faculty of Teacher Training and Education, Jambi University, Indonesia
ABSTRACT
This study generally aimed to find out the effect of working environment, job characteristics, and working motivation on lecturers’ job satisfaction in Jambi University. Survey research method was used to investigate the relationship between variables and to test the hypothesis. Therefore, path analysis model was used to analyze the pattern of relationship between variables with the aim to determine the direct and indirect effect of a set of independent variables (exogenous) to the dependent variable (endogenous). A total of 857 lecturers of different faculties were getting involved as the population in this study, and in short as 273 lecturers were chosen as the samples by using proportionate stratified random sampling. The findings revealed that; there was a positive direct effect of working environment on job motivation, working environment on job satisfaction, job characteristics on job motivation, working environment on job satisfaction, and job motivation on job satisfaction. Limitations of the study, both theoretical and practical implications, and suggestion for further research were also conveyed in this study.
Keywords: working environment, job characteristics, job motivation, job satisfaction
INTRODUCTION
Job satisfaction is important thing in a series of management processes of an organization due to generate a morale that will ultimately lead in increasing productivity and performance. It involves the attitudes and feelings of a person who are closely related to two dimensions; work and the associated with self-employed (Anwar, 2000). Dimensions of work include wages and salaries received, opportunities of career development, relationships with other employees, job placement, occupation, organizational structure and quality of supervision. While the dimensions of associated with self-employee include age, health condition, ability, education and others. Furthermore, every human being experiences a challenge change, whether local, national, or global. The key to making changes is the human resources as the main supporters in an organization. Human resources are the employees of the organization. The way requires an empowerment of existing resources, especially human resources. With the empowerment of human resources in an organization then the employees can be more efficient and effective which will encourage the realization of autonomy and maturity of the employees themselves to face problems occurred when carrying out the task.
To be able to improve the competitiveness, it is required qualified human resources, teaching staff, or lecturers who competence in accordance with the required and able to apply teaching, research, and community services. In addition, there are many factors affecting both internal factors and external factors to be able to work optimally, one of those factors is based on the results of lecturer evaluation in even semester 2015/2016. Every end of the semester, there is a significant increase of responses or assessments provided by students on the lecturer's performance. The factor which is also visible from the attendance of the lecturer where the lecturer's presence is seen not so significant based on the attendance of lecturer every month. However, based on the results of preliminary observations, it was found that most lecturers of Jambi University feel dissatisfaction with their work. Certainly, this is not 100% representing the assessment of lecturers’ job satisfaction.
As lecturers, they should be able to provide a healthy academic atmosphere, which can motivate students in teaching and learning process. This will certainly bring significant influence to Jambi University in managing the strategy, to maintain commitment and to inspire the spirit to remain and achieve the target in order to create an output that is in accordance with the ideals of Jambi University. Job satisfaction is a very important factor to get optimal work. When the lecturers feel satisfaction in working, they will do as much as possible with all the ability to complete the job task, thus it will increase the productivity of lecturers’ work. For any organization, employees are vital resources and important investment; if employees are satisfied then they will be loyal to the organization (Alev, Gulem, Gonca, & Burca, 2009). Job satisfaction is an effective direction towards the desired results; some researchers defined job satisfaction as the employee's feeling toward their work (Kovacs & Goldston, 1991).
By adopting job satisfaction model from Pillai and Meindl (1998), it is assumed that job satisfaction is derived from work motivation, task / job characteristics, and working environment. The results of Hackman and Oldham's research (1975 cited by Prasetyo & Wahyuddin, 2003) indicate that the characteristics existing in the work have positive and significant relationship to job satisfaction (Loher, Noe, Moeller, & Fitzgerald, 1985) by using the meta-analysis procedure of 28 similar research results, concluded that statistically these two variables have the significant relationship. According to Robbins, Bergman, Stagg, and Coulter (2006), the quantity and direction of the relationship are influenced by moderator variables, for instance individual differences such gender, age, educational level, marital status, and situational factors; working environment, leadership, needs and so forth.
When job satisfaction and influenced factor can be identified through this study, then the results of this study will be useful as part of self-evaluation and can be set to maintain job satisfaction in working environment of Jambi University. There are consequences when lecturers are satisfied with their work, and there are consequences when they are dissatisfied with their work. According to Robbins and Judge (2003), a theoretical framework (out of the influence of devotion) is very useful in understanding the consequences of dissatisfaction such aspiration (voice), loyalty, and servitude. Besides, the researchers argue that one of the dangers of working discrepancy is a syndrome called deviant behavior in forms of the formation of defector groups, abuse of authority, theft in the workplace, inappropriate association, and inaction.
Working characteristics
(X2)
Working motivation
(X3)
Working satisfaction
(Y) Working
environment
(X1)
RESEARCH METHODOLOGY
This research was carried out at Jambi University. The research started from February 2016 until November 2016. For the purpose of analysis, data collection was conducted through two phases. The first phase of data collection is to test the research instrument, then data were analyzed to determine the level of validity and reliability of the instrument. The second phase was the collection of research data in accordance with the needs in this study. The first phase was held in June 2016, while the second phase was in November 2016.This research used survey research method. This method is appropriate to describe the factual conditions, and it can also compare these conditions with predefined criteria. Additionally, it can also be used to investigate the relationship between variables and to test the hypothesis. Therefore, path analysis model was used to analyze the pattern of relationship between variables with the aim to determine the direct and indirect effect of a set of independent variables (exogenous) to the dependent variable (endogenous). The use of path analysis model is useful for; 1) describing the phenomenon being studied or the problem studied, (2) the prediction of the dependent variable value based on the independent variable value, (3) the determinant factor as the determination of independent variables having the dominant effect on the dependent variable, (4) the model testing uses theory of trimming. The variables referred in this study were job satisfaction (Y), working motivation (X3), working characteristics (X2), and working environment (X1). The effect among variables described the path relationship between variables X1, X2, and X3 to Y, presented on theoretical model of research as the following figure.
Figure1. Theoretical research model (adapted from Pillai & Meindl, 1998)
Figure 10 (theoretical research model) above showed that the path analysis model used was "correlated path model", which had 2 (two) sub-structures. The first sub-structure expressed the causal relationship of X1 and X2 to X3, and the second sub-structure expressed the causal relation from X3 to X4. In the first sub-structure, X1 and X2 were exogenous variables, and X3 was endogenous variables. In the second sub-structure, X3 was an exogenous variable and X4 was an endogenous variable
RESULTS AND DISCUSSION
Data of dependent variable as endogenous variable, consist of job satisfaction (Y) and working motivation (X3), and data of independent variable working environment (X1) and working characteristic (X2) as exogenous variables obtained by using questionnaire instrument from 857 respondents; 13 faculties at Jambi University. The number of questionnaires distributed amounted to 273 copies to the respondents, and those who returned as many as 273 respondents (100%). Based on the description of research data, the results of descriptive statistical calculations used SPSS version 21 programs were obtained the following;
Job satisfaction variable (y)
Job Satisfaction variable was measured through questionnaire consisted of 32 statements, using a scale of 1-4 where respondents chose the answer option in which score 1 is for strongly disagree, score 2 is for disagree, score 3 is for agree, and score 4 is for strongly agree. Based on the results of data analysis, the results obtained as follows:
Average Score
Standard Deviation and Variance
Var4 =
The frequency distribution is based on the Sturges rule:
Range: R = 124 - 68 = 56. Number of classes: k = 1 + 3.3 log (84) = 7.35, rounded to = 8. Interval length class: p = 56 / 7.35 = 7.619, rounded to = 8. Lower limit of the interval class is 65.5. Based on these values, the frequency distribution is presented in the following table:
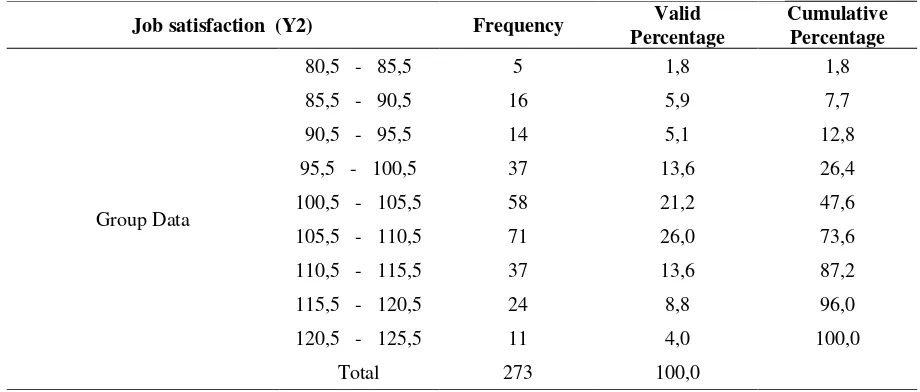
Table 1: Frequency distribution of group data on job satisfaction variable
Job satisfaction (Y2) Frequency Valid
Table 2: Job Satisfaction (Y2)
Job satisfaction (Y2) Frequency Valid Percentage Cumulative Percentage
Averange Group Data
Low 43 15,8 15,8
Medium 181 66,3 82,1
High 49 17,9 100,0
Total 273 100,0
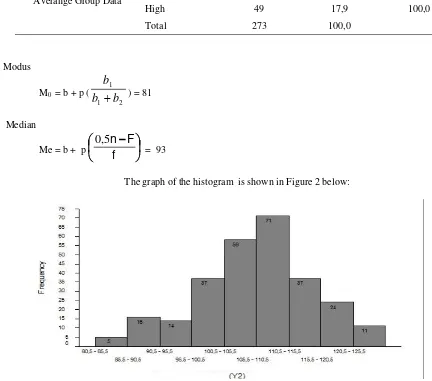
Modus
M0 = b + p (
2 1
1
b
b
b
+
) = 81Median
Me = b + p
−
f
F
n
5
,
0
= 93
The graph of the histogram is shown in Figure 2 below:
Figure 2: Histogram graph of job satisfaction (Y)
The data above showed that the score of job satisfaction with the highest frequency/ number of respondents was ranged from 81.5 up to 97.5 (interval classes: three and four) as many as 273 respondents or the same. Based on frequency distribution data, the score of frequency is smaller than mean-1SD as 17 or 20.23%, the score of frequency from -1SD to + 1SD was 66 or 59.54% and the frequency of the above score was +1SD as many as 17 or 20.23%. Thus, it can be said that job satisfaction experienced by lecturers of Jambi University was in "medium" level.
Job Motivation Variable (X3)
Average Score
Standard Deviation and Variance
Var3 =
Frequency Distribution: The frequency distribution is based on the Sturges rule, Range: R = 118 - 66 = 52, Number of classes: k = 1 + 3.3 log (84) = 7.35, rounded to = 8, The length of interval class: p = 52 / 7,35 = 7.074, rounded to 8, Lower limit of the interval class is 61.5. Based on the value, the frequency distribution is presented in Table 2 below;
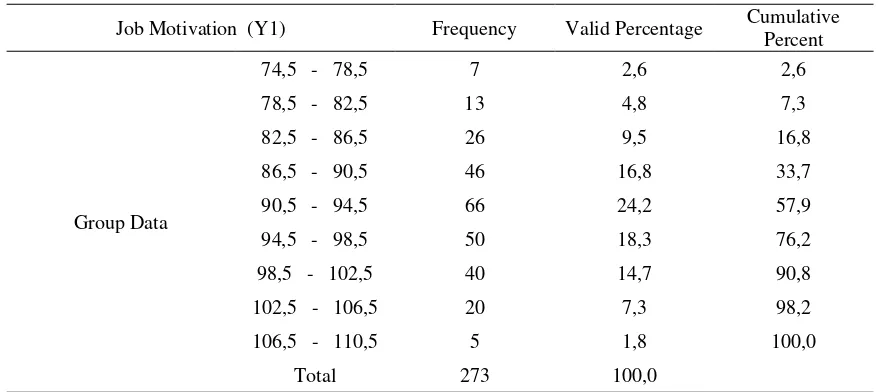
Table 3: Frequency distribution of data group on job motivation variable
Job Motivation (Y1) Frequency Valid Percentage Cumulative Percent
Table 4: Job Motivation (Y1)
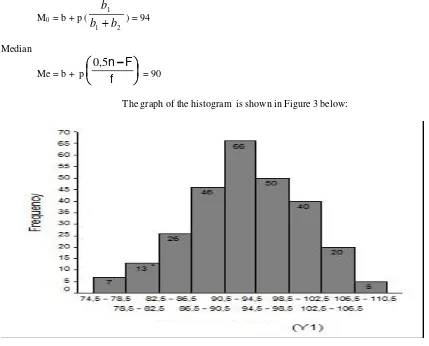
Modus
The graph of the histogram is shown in Figure 3 below:
Figure 3: Histogram Chart of Job Motivation (X3)
The data above showed that Job Motivation score with the highest frequency / number of respondents was ranged from 77.5 to 85.5 (third interval class) as many as 21 respondents or 25%.
Job Characteristic Variable (X2)
Job Characteristic variable was measured through a questionnaire consisted of 28 statements, using a scale of 1-4 where respondents chose the answer option in which score 1 is for strongly disagree, score 2 is for disagree, score 3 is for agree, and score 4 is for strongly agree. Based on the data obtained then processed statistically, the result was as follows.
Standard Deviation and Variance
Frequency Distribution
The frequency distribution is based on the Sturges rule: Range: R = 119 - 66 = 53Number of classes: k = 1 + 3.3 log (84) = 7.35, rounded to = 8, Interval length class: p = 53 / 7, 35 = 7.21, rounded to = 8, Lower limit of the interval class is 61.5. Based on the value, frequency distribution of job characteristic variable is presented in table 3 below.
Table 5: Frequency distribution of group data on job characteristics variable
Group Range Frequency Percentage Cumulative Percentage
1 61,5 - 69,5 2 2.38 2.38
2 69,5 - 77,5 2 2.38 4.76
3 77,5 - 85,5 18 21.43 26.19
4 85,5 - 93,5 22 26.19 52.38
5 93,5 - 101,5 17 20.24 72.62
6 101,5 - 109,5 11 13.10 85.71
7 109,5 - 117,5 11 13.10 98.81
8 117,5 - 125,5 1 1.19 100.00
Total 84 100
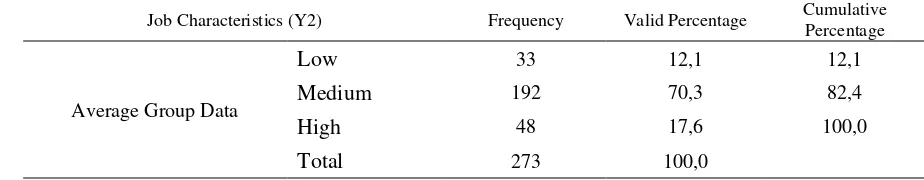
Table 6: Job Characteristics (X2)
Job Characteristics (Y2) Frequency Valid Percentage Cumulative Percentage
Average Group Data
Low 33 12,1 12,1
Medium 192 70,3 82,4
High 48 17,6 100,0
Total 273 100,0
Modus
M0 = b + p (
2 1
1
b
b
b
+
) = 93,00Median
Me = b + p
−
f
F
n
5
,
0
= 93,00
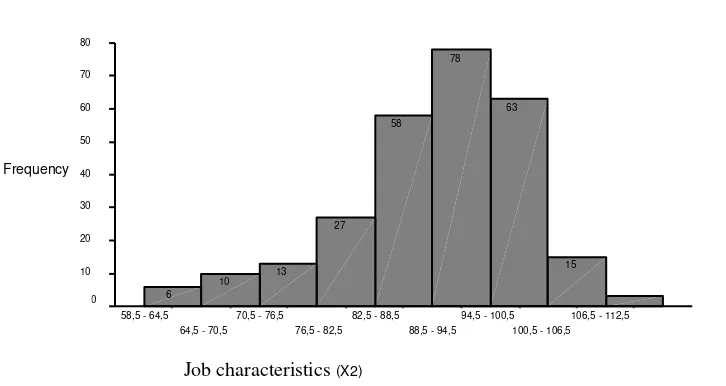
Figure 4. Histogram chart of job characteristics (X2)
The data above showed that the score of job characteristics with the highest frequency / number of respondents was between 85.5 up to 93.5 (fourth interval class) 22 respondents or 26.19%.
Working Environment Variable (X1)
Working environment variable was measured through questionnaires consisted of 30 statements, using a scale of 1-4 where respondents chose the answer option in which score 1 is for strongly disagree, score 2 is for disagree, score 3 is for agree, and score 4 is for strongly agree. Based on the data obtained then processed statistically, the result was as follows.
Standard Deviation and Variance
VAR1 =
The frequency distribution is based on the Sturges rule: Range: R = 117 - 68 = 49. Number of classes: k = 1 + 3.3 log (84) = 7.35, rounded to= 8. Length of interval class: p = 49 / 7,35 = 6,66, rounded to = 7. Lower limit of the interval class is 64.5. Based on these values, the frequency distribution of data is presented in Table 4 below:
Table 7: Frequency distribution of group data on working environment variable(X1)
Working Environment (X1) Frequency Valid Percentage
Cumulative Percent
Group Data
55,5 - 62,5 5 1,8 1,8
69,5 - 76,5 22 8,1 9,9
76,5 - 83,5 52 19,0 28,9
83,5 - 90,5 53 19,4 48,4
90,5 - 97,5 57 20,9 69.2
97,5 - 104,5 59 21,6 90,8
104,5 - 111,5 25 9,2 100,0
Total 273 100,0
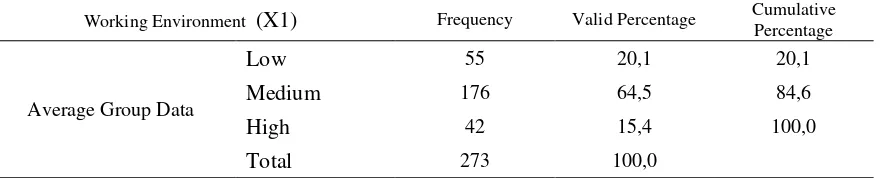
Table 8: Working Environment (X1)
Working Environment (X1) Frequency Valid Percentage Cumulative Percentage
Average Group Data
Low 55 20,1 20,1
Medium 176 64,5 84,6
High 42 15,4 100,0
Total 273 100,0
Modus
M0 = b + p (
2 1
1
b
b
b
+
) = 85Median
Me = b + p
−
f
F
n
5
,
0
= 92
Figure 4. Histogram graph of working environment (X1)
The data above showed that the score of working environment with the highest frequency / number of respondents was ranged from 85.5 to 92.5 (fourth interval class) 20 respondents or 23.81%.
Hypothesis Testing
Direct effect of working environment (X1) on working motivation (X3)
The first hypothesis formulation to be tested is: Ho: There is no direct effect of working environment on job motivation, or statistically formulated Ho: p31 = 0. H1: There is a direct effect of working environment on job motivation, or statistically formulated H1: p31 ≠ 0. Decision rule: If 0.05 ≤ Sig then H0 is accepted and H1 is rejected, it means that the path coefficient is not significant. If 0.05 ≥ sig then H0 is rejected and H1 is accepted, it means that the path coefficient is significant. From the results of statistical calculations used the SPSS program, it is obtained calculation results as presented in the following table 5;
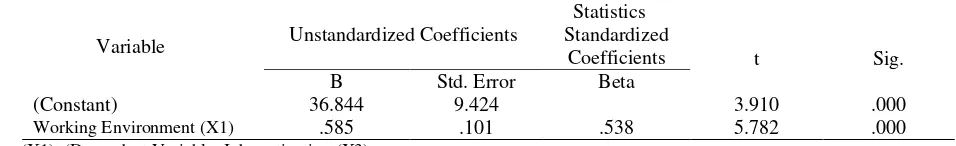
Table 9: The Coefficientsa of the effect of working environment variable on job motivation variable
Variable
Statistics Unstandardized Coefficients Standardized
Coefficients t Sig.
B Std. Error Beta
(Constant) 36.844 9.424 3.910 .000
Working Environment (X1) .585 .101 .538 5.782 .000
a (X1) (Dependent Variable: Job motivation (X3)
Based on the statistical calculation data, the effect of working environment (X1) on job motivation (X3) was 0,538 with coefficient t arithmetic is 5,782 and 0.05> sig. Then Ho is rejected and accepts H1 statement. Thus it can be said that the hypothesis proposed by the statement; there is a direct effect of working environment on job motivation empirically acceptable. With the rejection of Ho hypothesis, it is believed empirically that working environment has a positive and significant effect on job motivation. In other words, high variation in low motivation of the lecturers in Jambi University is influenced by working environment.
Direct Effect of Working Environment (X1) on Job Satisfaction (Y)
The second hypothesis formulation to be tested is: Ho: There is no direct effect of working environment (X1) on job satisfaction (Y), or statistically formulated Ho: p41 = 0, H1: There is a direct effect of working environment (X1) on job satisfaction (Y), or statistically formulated H1: p41 ≠ 0. Decision rule: If 0.05 ≤ Sig then H0 is accepted and H1 is rejected, it means that the path coefficient is not significant. If 0.05 ≥ sig then H0 is rejected and H1 is accepted, it means that path coefficient is significant. From the results of statistical calculations used the SPSS program, it is obtained calculation results as presented in the following table.
Table 10: The Coefficientsa of effect of working environment on job satisfaction
Variable
Statistics Unstandardized Coefficients Standardized
Coefficients t Sig.
B Std. Error Beta
(Constant) 36.606 9.640 3.797 .000
Working Environment (X1) .614 .103 .549 5.941 .000
a (X1) (Dependent Variable: Job satisfaction (X4)
From the table above, we can see that the coefficient of beta on working environment variable (X1) on job satisfaction variable (Y) is 0,549, with t count coefficient of 5.941 and 0.05> sig. Based on these results, then Ho is rejected and H1 statement is accepted. Thus, it can be said that hypothesis proposed by statement; there is direct effect of working environment on job satisfaction, and it can be accepted. With the rejection of Ho hypothesis, it is believed empirically that working environment has a positive and significant effect on job satisfaction. In other words, the variation in low level of job satisfaction of the Lecturers in Jambi University is influenced by working environment.
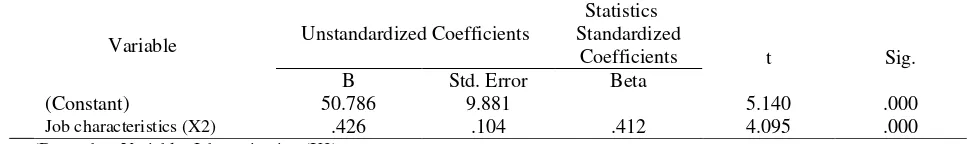
Direct Effect of Job Characteristics (X2) on Job Motivation (X3)
The formulation of the third hypothesis to be tested is: Ho: There is no direct effect of job characteristics (X2) on job motivation (X3), or statistically formulated Ho: p32 = 0
H1: There is a direct effect of job characteristics (X2) on job motivation (X3), or statistically formulated H1: p32 ≠ 0. Decision rule: If 0.05 ≤ Sig then H0 is accepted and H1 is rejected, it means that the path coefficient is not
significant. If 0.05 ≥ sig then H0 is rejected and H1 is accepted, it means that the path coefficient is significant. From the results of statistical calculations used the SPSS program, it is obtained calculation results as presented in the following table.
Table 11: The Coefficientsa of effect of the Job Characteristics on Job Motivation
Variable
Statistics Unstandardized Coefficients Standardized
Coefficients t Sig.
B Std. Error Beta
(Constant) 50.786 9.881 5.140 .000
Job characteristics (X2) .426 .104 .412 4.095 .000
a (Dependent Variable: Job motivation (X3)
From the table above, we can see that beta coefficient of job characteristics on job motivation was -0.412, with t count coefficient of 4,095 and 0.05> sig. Based on these results then Ho is rejected and H1 statement is accepted. Thus it can be said that the hypothesis proposed with the statement; there is a direct influence of job characteristics on job motivation, and it can be acceptable. With the rejection of Ho hypothesis, it is believed empirically that job characteristics have a positive and significant effect on job motivation. In other words, high variation in low motivation of the lecturers in Jambi University is influenced by Job Characteristics.
Direct Influence of Job Characteristics (X2) on Job Satisfaction (Y)
Table 12: The coefficienta of effect of job characteristics (X2) on job satisfaction (Y)
Variable
Statistics Unstandardized Coefficients Standardized
Coefficients t Sig.
B Std. Error Beta
(Constant) 52.816 10.227 5.164 .000
Job characteristics (X2) .431 .108 .405 4.006 .000
a (Dependent Variable: Job satisfaction (X4)
From the table above, we can see that beta coefficient on Job Characteristics on Job Satisfaction is 0.405, with coefficient t arithmetic of 4.006 and 0.05> sig. Based on these results, then Ho is rejected and H1 statement is accepted. Thus, it can be said that hypothesis proposed by statement; there is direct effect of job characteristic (X2) on job satisfaction (Y), and it can be acceptable. With the rejection of Ho hypothesis, it is believed empirically that job characteristics (X2) have a positive and significant effect on job satisfaction (Y). In other words, the variation of high level of job satisfaction of the lecturers in Jambi University is influenced by job characteristics.
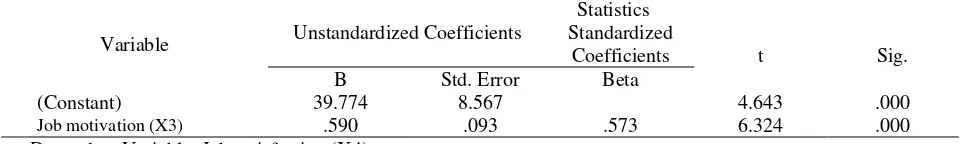
Direct Influence Work Motivation (X3) on Job Satisfaction (Y)
The formulation of the fifth hypothesis to be tested is: Ho: There is no direct effect of job motivation on job satisfaction, or statistically formulated Ho: p43 = 0, H1: There is a direct effect of job motivation on job satisfaction, or statistically formulated H1: p43 ≠ 0, Decision rule: If 0.05 ≤ Sig then H0 is accepted and H1 is rejected, it means that the path coefficient is not significant. If 0.05 ≥ sig then H0 is rejected and H1is accepted, it means that path coefficient is significant. From the results of statistical calculations used the SPSS program, it is obtained calculation results as presented in the following table.
Table 13: The coefficienta of effect of job motivation on job satisfaction
Variable
Statistics Unstandardized Coefficients Standardized
Coefficients t Sig.
B Std. Error Beta
(Constant) 39.774 8.567 4.643 .000
Job motivation (X3) .590 .093 .573 6.324 .000
a (Dependent Variable: Job satisfaction (X4)
From the data, we can see that beta coefficient of job motivation on job satisfaction of 0.573 with t count coefficient of 6.324 and 0.05> sig. Based on these results then Ho is rejected and H1 statement is accepted. Thus, it can be said that the hypothesis proposed with the statement; there is a direct effect of job motivation on Job Satisfaction, and it can be acceptable.
Does working environment (X1) have an indirect effect on job satisfaction (X4) while have a direct effect on job motivation (X3)?
The formulation of the sixth hypothesis to be tested is: nHo: There is no working environment (X1) having an indirect effect on job satisfaction (X4) while directly affect the work motivation (X3) Ho: p143 = 0. H1: There is working environment (X1) that indirectly effects on job satisfaction (X4) while direct effect on job motivation (X3) H1: p143 ≠ 0. The calculation of the coefficient value of indirect effect X1 on Y2 through Y1 and the coefficient value of indirect effect of X2 on Y2 through Y1, as follows.
An indirect effect of X1 on Y2 through Y1
= (Effect X1 --- Y1) x (Effect Y1 --- Y2) = PY1.1 x PY2.Y1
= 0.20739 x 0.47590 = 0.098695
= (Effect X2 --- Y1) x (Effect Y1 --- Y2) = PY1.2 x PY2.yY1
= 0.24162 x 0.47590
= 0.11498
Does Job Characteristics (X2) have an indirect effect on job satisfaction (X4) but have a direct effect on work motivation (X3)
The formulation of the sixth hypothesis to be tested is: Ho: No Job Characteristic (X2) has an indirect effect on job satisfaction (X4) while has first direct effect on work motivation (X3) Ho: p243 = 0, H1: Job Characteristics (X2) has an indirect effect on job satisfaction (X4) but has a direct effect on job motivation (X3) H1: p243 ≠ 0. The calculation of the coefficient value of the total effect of X1 on Y2 and the coefficient value of the total effect of X2 on Y2, as follows.
An indirect effect of X1 on Y2 through Y1 + The direct effect of X1 on Y2
= (Effect X1 --- Y1) x (Effect Y1 --- Y2) + (Influence X1 --- Y2) = PY1.1 x PY2.y1 + PY2.1
= 0.20739 x 0.47590 + 0.40132 = 0.500015
An indirect effect of X2 to Y2 through Y1 Direct influence of X1 to Y2
= (Effect X2 --- Y1) x (Effect Y1 --- Y2) + (Influence X2 --- Y2) = PY1.2 x PY2.Y1 + PY2.2
= 0.24162 x 0.47590 + 0.25708 = 0.37206
With the rejection of Ho hypothesis, it is believed empirically that job motivation has a positive and significant effect on job satisfaction. In other words, the variation in low level of job satisfaction of the lecturers in Jambi University is influenced by job motivation.
LIMITATIONS OF RESEARCH
This study had some limitations both regarding the concept, methodology and analysis results; first, conceptually this study used the assumption of causality relationship between the variables affected job satisfaction, whereas the variables chosen to explain job satisfaction variables are only limited to variables of working environment, job characteristics, and job motivation. Due to the limitations, the dimensions or indicators chosen are also limited to
X1
X2
Y1
Y2
R2y2.12y1 = 0.6298
e2y2.12y1 = 0.3702 r12 = 0.1083
ty1.1 = 3,5955 tY2 1 = 15,3598
Py2 y1 = 0,4759 ty2 y1 = 14,8792 Py2.1 = 0.4013
Py1.1 = 0.2074
Py1.2 = 0.2416 ty1.2 = 4,1890
Py2.2 = 0.2571
ty2.2 = 14,0428 R2y1.12 = 0.1122
e2y1.12 = 0.8878
whereas in the variables studied there are certain things that may not be approached quantitatively. One of the weaknesses is by choosing this quantitative method the researcher cannot dig deeper information. Third, the response of each respondent is limited to personal perceptions bounded by the dimensions of space, place and time. Respondents may be less careful because of mood or self-interest factors that can affect the response. Researcher is not able to fully supervise the sincerity and honesty of each respondent at the time of filling the questionnaire. Fourth, the data analysis using a tool of statistics that technically do a lot of rounding of numbers to simplify and facilitate the calculation. This can certainly lead to reduced accuracy in this study.
CONCLUSIONS, IMPLICATIONS AND SUGGESTIONS
Based on the results of data analysis as presented, the findings and conclusions of this study are; 1) there is a positive direct effect of working environment on job motivation. This means that good situation and working conditions affected the effectiveness of a person in working, will result in the emergence of encouragement within the lecturer of Jambi University to think, act, work and overcome any obstacles when they perform their duties. 2) There is a positive direct effect of working environment on job satisfaction. This means that good situation and working conditions influenced the effectiveness of a person in working, will result in the emergence of encouragement within the lecturers of Jambi University to think, act, work and overcome any obstacles. 3) There is a positive direct effect of job characteristics on job motivation. This means that the way of the lecturers in interacting with a good colleague, will lead to the emergence of encouragement within the lecturer to think, act, work and overcome any obstacles when performing their duties. 4) There is a positive direct effect of working environment on job satisfaction. This means that well interactions among lecturers will result in the emergence of feelings of pleasure, proud, and happy for Jambi University Lecturers on their work. 5) There is a positive direct effect of job motivation on job satisfaction. This means that well encouragement within the lecturers will lead to the emergence of feelings of pleasure, proud, and happy for Jambi University Lecturers on their work.
1) There is a positive direct effect of working environment on job motivation implied that working environment will affect the effectiveness of a person in working. Therefore, the arrangement of a good working environment will impact on the emergence of encouragement within a person to think, act, work and overcome any obstacles when performing their duties to be better. 2). Working environment directly affects positively to job satisfaction meant that working environment has a positive significant effect on job satisfaction. It includes two basic components of the physical working environment and psychological working environment, where those two components are closely interrelated. The physical working environment has an impact on the psychological comfort of the worker, as well as the psychological working environment having various effects on physical working conditions. If a worker gets a positive effect then she/ he will have better moral in doing her/ his job and this will increase job satisfaction to achieve the goals efficiently. When a worker gets a negative effect, she/ he will experience a moral decline in work, and consequently it will cause a job dissatisfaction, and waste or expenditure more than the cost that should be issued. 3) Job characteristics positively affects job motivation, it means that if job characteristics are chosen appropriately, they will lead to increase job motivation. This also means that the proper job characteristics, according to the situation and the level of maturity, will effect in increasing motivation of the lecturers in Jambi University. 4) Job motivation has a positive direct effect on job satisfaction. This means that motivation as a force existing within a person will effect on directions, intensity and persistence of her/ his behavior. A motivated person has willing to try directing her/ his behavior through an effort (intensity), for a certain time (persistence), and toward a particular destination (direction). If the business is carried out to satisfy various needs, it will have an impact on the increase of job satisfaction. 6) If working environment is well laid out, supported by high job motivation will result in increasing job satisfaction. If the physical working environment is well laid out in where inter and personal interactions are going well, the common goal is compatible with the goals of each individual, the group members having willingness and independence in doing the work, will generate excitement, enthusiasm and job satisfaction where members of the organization will feel happy and proud about their work.
forming a task orientation of lecturers in Jambi University, (c) each assigned task must have clarity, (d) open in innovation development, (e) each activity unit has a physical conformity, (f) minimizing work pressure, and (7) controlling regularly and continuously. (2) Maintenance job characteristics properly. The right work is a prerequisite for members of organization to motivate them in achieving high performance and job satisfaction. To achieve this required commitment, the lecturers of Jambi University need to maintain interpersonal relationships and streamline information in accordance with the required lecturers in Jambi University. Smooth flow of information and good interpersonal relationships will create conducive atmosphere to organizational life so that group cohesiveness within Jambi University can be well maintained, such atmosphere will lead to increase job satisfaction of lecturers in Jambi University.
Based on the statement of implications above, the suggestions are; 1) lecturers of Jambi University should have a high commitment to increase job motivation and job satisfaction. Jambi University is one of the most important assets, and job motivation and job satisfaction are very important aspects to achieve the effective performance in providing services with high quality. The right job motivation is the responsibility of the lecturers in Jambi University. 2) Rector should conduct systematic arrangement of working environment to create a conducive organizational climate. Additionally, comfortable, healthy and safe working environment are needed to increase job motivation and job satisfaction of lecturers in Jambi University. 3) Each department within the University / Faculty should be organized and directed to work together dynamically to achieve common and specific goals. The key word is the smooth flow of information and human relations that must be played by the leaders of the University. Besides, the role that should be played by each lecturer of Jambi University is to maintain a harmonious dynamics among others such; (a) devote all feelings of involvement in activities of the University; (c) endeavor to assist the achievement of common goals; (d) strive to obey the rules set by the University well, (f) be able to communicate openly, (g) seek to assist other departments within the University's internal scope, (h) provide an opportunity for Jambi University Lecturers to also actively participate in all activities; perform their role, and (i) realize the importance of the activities outlined by the University to achieve the University's goals, mission and vision. 4) Rector should improve the implementation of human resource development and the development of its management resources, so that they are ready for working hard and smart work, and have new paradigm to make Jambi University of Jambi more excellence and modern. 5) Research on job satisfaction should be expanded, not only limited in form of quantitative research, but also more comprehensive regarding to job satisfaction in terms of research types, both qualitative and mixed research in Jambi University.
REFERENCES
Alev, K., Gulem, A., Gonca, G., & Burca, G. (2009). Exploring the antecedents of organization identification: the role of job dimension, individual characteristics and job involvement. Journal of nursing management, 17(1), 66-73.
Anwar, P. (2000). Manajemen Sumber Daya Manusia. Bandung. PT Remaja Rosdakarya.
Hackman, J. R., & Oldham, G. R. (1975). Development of the job diagnostic survey. Journal of Applied Psychology, 60(2), 159.
Kovacs, M., & Goldston, D. (1991). Cognitive and social cognitive development of depressed children and adolescents. Journal of the American Academy of Child & Adolescent Psychiatry, 30(3), 388-392.
Loher, B. T., Noe, R. A., Moeller, N. L., & Fitzgerald, M. P. (1985). A meta-analysis of the relation of job characteristics to job satisfaction: American Psychological Association.
Pillai, R., & Meindl, J. R. (1998). Context and charisma: A “meso” level examination of the relationship of organic structure, collectivism, and crisis to charismatic leadership. Journal of Management, 24(5), 643-671.
Prasetyo, E., & Wahyuddin, M. (2003). Pengaruh kepuasan dan motivasi kerja terhadap produktivitas kerja karyawan Riyadi Palace Hotel di Surakarta. Retrieved April, 2, 2016.
Robbins, S., Bergman, R., Stagg, I., & Coulter, M. (2006). Management (4th [Australian] ed.). Frenchs Forest: NSW: Pearson Prentice Hall.