THE OPERATIONAL CHARACTERISTICS OF
THE JAKARTA BUS RAPID TRANSIT SERVICES
Leksmono Suryo PUTRANTO Senior Lecturer
Department of Civil Engineering Tarumanagara University Jl. Let. Jen. S. Parman No. 1, Jakarta 11440, Indonesia Fax: +62-21-566-3277
E-mail: [email protected]
Abstract: In order to understand the operational characteristics of the Jakarta bus rapid transit (BRT) services, an observation was made on line 1 between Blok M and Kota. Three observation points were selected on Blok M terminal, Bank Indonesia stop and Kota terminal. Sufficient surveyors were assigned at each point to record the time of arrival/ departure of the bus and the number of passengers boarding and alighting. Headways, boarding/ alighting rates and travel speeds were calculated from the obtained data. The results confirm that no control on planned headways and boarding/ alighting times has been made due to lack of fixed time table of the bus service.
Key Words: bus rapid transit, headway, boarding/ alighting time
1. INTRODUCTION
Jakarta BRT service which incorrectly called as “busway” by Indonesian public have been providing service since 15 January 2004. At the time of the preparation of this paper three corridors (lines) have been in operation and an additional of four new corridors was about to start the services. According to the Decree of the Governor of Jakarta No.84/2004 which contains of Jakarta Macro Transport Pattern, there will be 15 lines of BRT services at the end of 2010. This paper is intended to provide brief description on the operational characteristics of the Jakarta BRT services on line 1 between Blok M and Kota.
2. OBJECTIVES
The objective of this research was to understand the operational characteristics of the Jakarta BRT services.
3. SCOPE AND LIMITATIONS
4. LITERATURE REVIEW
The required scale of transport services depends on a city depends on the stage of development of the city. Small and traditional community lives in a relatively small area might only require walk as a mode of transport. As the community grows and the related area simultaneously grows a motorized vehicle might be required to shorten the travel time. To increase capacity the use of larger mode of transport such as bus should be initiated. Metropolitan area requires rapid transit for higher speed. For this purpose an exclusive lane is usually required longitudinally and/or transversely (Vuchic, 1981). Mass rapid transit (MRT) by means of underground or elevated railway system was believed to be the ultimate solution for metropolitan transport (Replogle, 2006). However, recently, some studies proved that bus rapid transit (BRT) provides competitive line capacity, requires lower costs (in terms of construction, operation and maintenance), gives less negative impact to environment, etc. (Replogle, 2006 and Schipper, 2006). However Morichi and Acahrya (2006) argued that for certain cities the demand might be much higher than the BRT capacity and suggested the MRT as the backbone with the support of the BRT as a feeder system as the solution.
Putranto (2004) found that worldwide, total MRT network length is significantly and negatively correlated with opening year of the first section. This means that total network length of MRT system that has been established longer is higher than total network length of MRT system that has just been established for a shorter period. This finding suggests that development of a comprehensive MRT system requires substantial period of time. Therefore BRT could be use as an intermediate option to be replaced by MRT at a later stage (Morichi and Acahrya, 2006). Zhang et al (2005) established a set of evaluation indexes including social economy factors, traffic function factors, environment effect factors and resources utilizing factor by taking managers, users and relatives as the subject of BRT scheme evaluation.
Line capacity is related to several characteristics such as the headway, boarding/ alighting time, number of boarding/ alighting passengers (boarding/ alighting rates), vehicle capacity, etc. The first three were analyzed in this paper.
5. METHODOLOGY OF DATA COLLECTION AND ANALYSIS
Some t-tests for the difference of means of headways and boarding/ alighting times were made in order to evaluate the differences in the BRT operational characteristics between pairs of observation cases. Two methods to group the data were exercised, i.e. by period of observation, by routes and by combination of them. Obviously, the more the level of detail of the grouping, the less the number of sample on each group. The significant level considered in this paper was 0.05. It should be noted that number of sample is playing an important role in determining the minimum mean difference to be considered as statistically significant.
Additionally a Pearson Correlation analysis was also carried out between: • boarding time and number of passengers boarding at the terminal • alighting time and number of passengers alighting at the terminal
• boarding/ alighting time and number of passengers boarding/ alighting at the bus stop
A significant level (α) of 0.05 was also used to determine significant correlation coefficient (r).
6. DATA ANALYSIS RESULTS
Tables 1 to 5 summarize the results of mean difference of headways t-tests grouped by pairs of observation period, routes and combination of them.
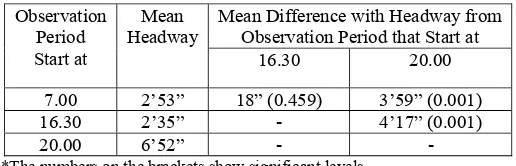
Table 1 T-test for mean difference of headways grouped by observation period
Mean Difference with Headway from Observation Period that Start at Observation
Period Start at
Mean Headway
16.30 20.00
7.00 2’53” 18” (0.459) 3’59” (0.001)
16.30 2’35” - 4’17” (0.001)
20.00 6’52” - -
*The numbers on the brackets show significant levels
Table 2 T-test for mean difference of headways grouped by route
Mean Difference with Headway from Route
Route Mean Headway
BI-Blok M Blok M-BI BI-Kota
Kota-BI 2’39” 49” (0.139) 2’26”(0.006) 1’39” (0.001) BI-BlokM 3’28” - 1’36” (0.118) 50” (0.033)
Blok M-BI 5’5” - - 46” (0.434)
BI-Kota 4’18” - - -
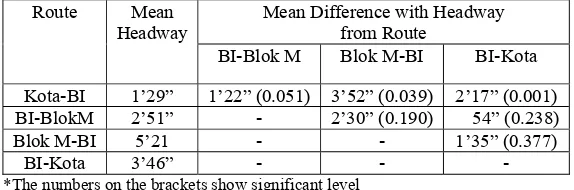
Table 3 T-test for mean difference of morning headways grouped by route
Mean Difference with Headway from Route
Route Mean Headway
BI-Blok M Blok M-BI BI-Kota
Kota-BI 1’29” 1’22” (0.051) 3’52” (0.039) 2’17” (0.001) BI-BlokM 2’51” - 2’30” (0.190) 54” (0.238)
Blok M-BI 5’21 - - 1’35” (0.377)
BI-Kota 3’46” - - -
*The numbers on the brackets show significant level
Table 4 T-test for mean difference of afternoon headways grouped by route
Mean Difference with Headway from Route
Route Mean Headway
BI-Blok M Blok M-BI BI-Kota
Kota-BI 1’41” 1’22” (0.001) 1’20”(0.099) 2’18” (0.001) BI-BlokM 3’4” - 1”(0.967) 56” (0.013)
Blok M-BI 3’2” - - 57” (0.229)
BI-Kota 4’0” - - -
*The numbers on the brackets show significant level
Table 5 T-test for mean difference of evening headways grouped by route
Mean Difference with Headway from Route
Route Mean Headway
BI-Blok M Blok M-BI BI-Kota
Kota-BI 10’8” 4’45” (0.029) 3’49” (0.085) 4’36” (0.034) BI-BlokM 5’22” - 56” (0.287) 9” (0.732)
Blok M-BI 6’18” - - 46” (0.445)
BI-Kota 5’32” - - -
*The numbers on the brackets show significant level
It can be seen from Table 1 that mean difference of headway between morning and afternoon period was not statistically significant. Mean headway in the evening period was statistically significant different with either mean headway in the morning or afternoon period. This indicates that during off peak period (evening period) the number of buses operated was significantly decreased.
From Tables 2 to 5, we find that in general Kota-BI-Blok M direction of travel was having shorter mean headway than the opposite direction. This might be caused by limited observation hours. The BRT system is operated between 5.00 and 22.00.
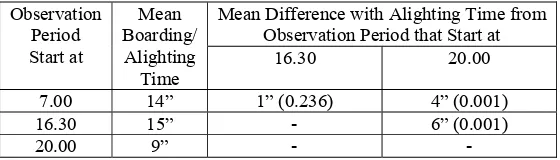
Table 6 T-test for mean difference of terminal alighting time grouped by observation period
Mean Difference with Alighting Time from Observation Period that Start at Observation
*The numbers on the brackets show significant levels
Table 7 T-test for mean difference of terminal boarding time grouped by observation period
Mean Difference with Alighting Time from Observation Period that Start at Observation
*The numbers on the brackets show significant levels
Table 8 T-test for mean difference of bus stop boarding/ alighting time grouped by observation period
Mean Difference with Alighting Time from Observation Period that Start at Observation
From Table 6, it can be seen that the mean difference of terminal alighting time between morning and afternoon period was not statistically significant. Mean terminal alighting time in the evening period was statistically significant different with either mean terminal alighting time in the morning or afternoon period. This correlates with the number of alighting passengers during different period of observations.
From Table 7, it can be seen that the mean difference of terminal boarding time between morning and afternoon period was not statistically significant. Mean terminal boarding time in the evening period was statistically significant different with either mean terminal boarding time in the morning or afternoon period. This correlates with the number of boarding passengers during different period of observations.
Table 9 Correlation Analysis between boarding time/ alighting time and no. of passengers boarding/ alighting
Location Correlation between No. of Sampel
r α Significant at 0.05? Terminal boarding time and no. of passengers
boarding
126 0.127 0.078 no
Terminal alighting time and no. of passengers alighting
147 0.198 0.008 yes
Bus Stop boarding/ alighting time and no. of passengers boarding/ alighting
100 0.118 0.120 no
From Table 9 it can be seen that boarding time/ alighting time were generally not correlated with number of passengers boarding/ alighting. It does not indicate that there was a standard time length of boarding/ alighting. The boarding/ alighting times were varied widely.
7. CONCLUSIONS
• Mean difference of headway between morning and afternoon period was not statistically significant. Mean headway in the evening period was statistically significant different with either mean headway in the morning or afternoon period.
• Mean difference of terminal alighting time between morning and afternoon period was not statistically significant. Mean terminal alighting time in the evening period was statistically significant different with either mean terminal alighting time in the morning or afternoon period.
• Mean difference of terminal boarding time between morning and afternoon period was not statistically significant. Mean terminal boarding time in the evening period was statistically significant different with either mean terminal boarding time in the morning or afternoon period.
• Mean difference of bus stop boarding/ alighting time between morning and afternoon period was not statistically significant. Mean bus stop boarding/ alighting time in the evening period was statistically significant different with either mean terminal alighting time in the morning or afternoon period.
• Boarding time/ alighting time were generally not correlated with no. of passengers boarding/ alighting. The results confirm that no control on planned headways and boarding/ alighting times has been made due to lack of fixed time table of the bus service.
ACKNOWLEDGEMENTS
I acknowledge the students of Civil Enginering Department, Tarumanagara University i.e. Taufan Sugiharto, Febriany Ferdinandus, Yatrix M.manuputty, Roby Ariwibowo, Alvin Verdika, Hermawan Budi P., Ichang Chandra, Andry Wijaya, Banteng Tommy, Husnu Aldi Gunawan, Andreas Retanubun that helped the author to collect the data.
REFERENCES
_____(2004). The Decree of the Governor of Jakarta No.84/2004. Jakarta: Dinas
Morichi,S., Acahrya, S.R. (2006). Sustainable Transport in East Asian Megacities. In: International Seminar on Transportation Options for Megacities, Opportunities and Challenges for Policy Makers. Jakarta 11 December 2006. Jakarta: The EASTS
and MTI.
Putranto, L.S. (2004). Characteristics of World Urban Rail Based Transport Provisions. In: Quality in Research. Depok ………… 2004. Depok: Fakultas Teknik Universitas Indonesia.
Replogle, M. (2006). Urban Public Transport Options for Asian Megacities. In:
International Seminar on Transportation Options for Megacities, Opportunities and Challenges for Policy Makers. Jakarta 11 December 2006. Jakarta: The EASTS
and MTI.
Schipper, L. (2006). Integrating Technology, Management, Economics and People for Sustainable Transport in a City. In: International Seminar on Transportation Options for Megacities, Opportunities and Challenges for Policy Makers. Jakarta
11 December 2006. Jakarta: The EASTS and MTI.