*Corresponding author, e-mail: [email protected]
Abstract
Bengkulu city is well-known as a high-risk area for an earthquake. One of the effects of the earthquake is liquefaction, the phenomenon in which the strength and stiffness of the soil are reduced by shock. The researchers measured the quantity of liquefaction by knowing the value of Vs30 values that can be obtained from the United States Geological Survey (USGS). In this study, however, we measured liquefaction based on the shear strain value (γ). Here, the shear strain values could be determined by measuring the seismic vulnerability index and the peak ground acceleration. The vulnerability index was obtained by measuring the resonance of the frequency and the amplification factor using a short period seismometer with 3 components (2 horizontal components and 1 vertical component), whereas the peak ground acceleration was obtained from the earthquake data that happened in Bengkulu City in 2000. The result showed that Vs30 and shear strain negatively correlated.
Keywords: Earthquake; Liquefaction; Shear strain; Vs30
Copyright © 2018 Universitas Ahmad Dahlan. All rights reserved.
1. Introduction
Bengkulu Province often experiences natural disasters of an earthquake where causes liquefaction, a phenomenon whereby soil loses strength and behaves like a liquid due to cyclic force during an earthquake, so the pore water pressure exceeds the effective soil stress. As the water pressure increases due to the earthquake, the soil effective stress (σ’) decreases. Liquefaction usually occurs in less dense and water-saturated soil (1), where the soil layer strength loss due to shocks caused by an earthquake or other vibration (2), so that if a shock occurs, soil layer behaves like a liquid. Liquefaction usually happens in water-saturated soil whose pores are full of water. When it gets vibration, the water gives pressure to the soil particles results in the decreasing soil density. Before the earthquake, the water pressure is low, but after that, the pressure increases so it can move the soil particles easily. Bengkulu City lies in the latitude of 3°45’-3°59’ S and longitude of 102°14’-102°22’ E, within the subduction area of Indo-Australia and Eurasia tectonic plates. Consequently, Bengkulu City is prone earthquake and liquefaction.
An earthquake of 7.9 on the Richter scale struck Bengkulu City in 2000 showed existing liquefaction in many locations. This liquefaction is related to the measurement of peak ground acceleration and shear wave velocity (3). In general, the condition of liquefaction represented by the peak ground acceleration should reach more than 300 gal (4). Our survey showed that the peak ground acceleration in all locations in Bengkulu City was higher than 300 gal. There is a high probability of liquefaction occurrence in Bengkulu if an earthquake occurs (5). One of liquefaction occurred during an earthquake in Bengkulu in 2000, where the impact is shown in Figure 1.
Figure 1. The building sink due to liquefaction
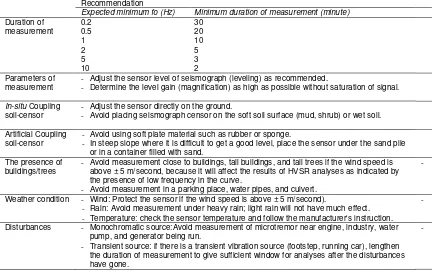
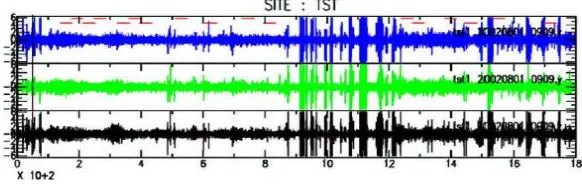
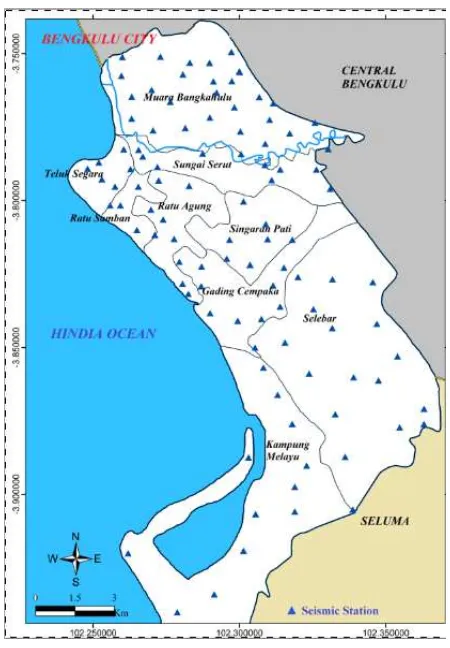
The measurement of liquefaction area based on soft soil condition which has low shear wave velocity will be correlated with the area having a shear strain in the same location. The correlation has not been done, but it needs to be proven. The objective of this study was to measure the potential threat of liquefaction to areas in Bengkulu City using microtremor data. Data were acquired using short period seismometer with three components, namely horizontal component of north-south, the horizontal component of east-west and a vertical component. The equipment for seismometer was sampling frequency of 100 Hz, digitizer, solar cell panel, GPS, UPS, and laptop for data acquisition. The software DATAPRO was used for microtremor data acquisition, GEOPSY for HVSR analyses and ArcGIS for mapping. Acquisition of primary data was made by direct microtremor measurement in each zone. The microtremor measurement was done in 100 locations, and each location was measured for 30 minutes with a sampling frequency of 100 Hz. The technique for microtremor survey followed the standard of SESAME European Research Project 2004 as shown in Table 1. The seismometer for measurement is shown in Figure 2, while the example of microtremor data display from survey results is shown in Figure 3.
Table 1. Microtremor Survey Technique (8)
Recommendation
Expected minimum fo (Hz) Minimum duration of measurement (minute)
Duration of measurement
0.2 30
0.5 20
1 10
2 5
5 3
10 2
Parameters of measurement
- Adjust the sensor level of seismograph (leveling) as recommended.
- Determine the level gain (magnification) as high as possible without saturation of signal.
In-situ Coupling soil-censor
- Adjust the sensor directly on the ground.
- Avoid placing seismograph censor on the soft soil surface (mud, shrub) or wet soil.
Artificial Coupling soil-censor
- Avoid using soft plate material such as rubber or sponge.
- In steep slope where it is difficult to get a good level, place the sensor under the sand pile or in a container filled with sand.
The presence of buildings/trees
- Avoid measurement close to buildings, tall buildings, and tall trees if the wind speed is above ± 5 m/second, because it will affect the results of HVSR analyses as indicated by the presence of low frequency in the curve.
- Avoid measurement in a parking place, water pipes, and culvert.
-
Weather condition - Wind: Protect the sensor if the wind speed is above ± 5 m/second).
- Rain: Avoid measurement under heavy rain; light rain will not have much effect. - Temperature: check the sensor temperature and follow the manufacturer's instruction.
-
Disturbances - Monochromatic source:Avoid measurement of microtremor near engine, industry, water pump, and generator being run.
- Transient source: if there is a transient vibration source (footstep, running car), lengthen the duration of measurement to give sufficient window for analyses after the disturbances have gone.
Figure 2. Primary data acquisition tools: (1) triaxial geophone; (2) GPS, (3) sensor cable; (4) seismic data digitizer and recorder; (5) laptop; (6) solar cell panel
Figure 3. Microtremor data display in DATAPRO software (8)
The analysis of tremor data resulted in seismic vulnerability index, which then was multiplied by the peak ground acceleration to get the shear strain value (). So far, the measurement of liquefaction vulnerability is usually done using an indicator of soil hardness represented by the shear wave velocity at a depth of 30 meters (Vs30) below the soil surface. To show that shear strain can be used as measurement indicator for the potential threat of liquefaction to an area, the shear strain indicator must be compared with Vs30. The ratio between shear strain and Vs30 was shown in a graph, so the measurement of the potential threat of liquefaction could be directly measured from the graph.
2. Research Method
Generally, liquefaction may occur due to certain factors, one of which is the increase in water pressure as a result of earthquake shocks, so that the effective stress (σ’) decreases. This condition can be stated as follows:
'
u
(1)where:
σ’=effective stress (kg/m2) σ=total soil stress (kg/m2) u=pore water pressure (kg/m2)
The soil effective stress is calculated using this equation:
'
h
'
'
(2)and
h
(3)where:
ρ=bulk density of soil (kg/m3) ρ'=bulk density of water (kg/m3)
h'=depth soil water surface (m)
To measure the potential threat of liquefaction of the soil, two important variables must be calculated, namely (1) cyclic stress ratio (CSR), cyclic stress causing liquefaction and (2) cyclic resistance ratio (CRR), soil ability to resist liquefaction. The value of CSR is calculated using this equation:
max
'
0.65
.
'.
av vo d vo vo
a
a
CSR
r
g
(4)where av is the cyclic shear stress, which is approached with horizontal peak ground acceleration (amax), g is gravity acceleration=9.81 m/s
2
, σVo, and σ’Vo total vertical overburden stress and effective stress and rd is stress reduction factor which is a function of depth (z). The formula for rd is empirically formulated by (9) as follows:
1.5 1.5
0.5 1.5 2
1.0 0.4113
0.04052
0.001753
1.0 0.4177
0.05729
0.006205
0.00121
dz
z
z
r
z
z
z
z
(5)The value of cyclic resistance ratio (CRR) is calculated using field data, namely standard penetration test (SPT), cone penetration test (CPT), and shear wave speed (Vs). Based on the values of CSR and CRR, the Factor of Safety of FSis calculated using this equation:
CRR
FS
CSR
(6)Liquefaction happens if FS≤ 1 and vice versa, it does not happen if FS > 1. In this study, whether or not liquefaction occurs was determined based on the shear strain (), which was calculated from the microtremor measurement in each study site. The microtremor data were analyzed with Geopsy using HVSR method. An empirical approach was used to calculate shear strain (10), and the result is formulated in the equation (7).
2 6 max 01000 10
A
a
f
(7)In Equation (7) is a shear strain, f0 resonance frequency, A amplification factor and amaxpeak ground acceleration which was calculated using Kanai attenuation in (11), formulated in equation (8) (11).
3.6 1.83 0.61 1.66 log 0.67 max
1
10
M R R R ga
T
(8)In equation, Tg is soil vibration period, M earthquake magnitude moment, and dan R is the distance from hypocenter to the station.
Shear strain triggers deformation of soil surface layer. Liquefaction deformation occurs if the value of shear strain is higher than 1×10⁻³. Therefore, the measurement of liquefaction potential in this study was conducted using shear strain measurement (12).
3. Data Acquisition
Figure 4. Microtremor data distribution in Bengkulu City
Figure. 5. The center of the earthquake and its distance to the station
Formula (9) was used to calculate the distance between hypocenter and the station.
2
2 12 2
i i i
R
h
x
x
y
y
(9)where Ri is the distance between hypocenter to the ith station; h is the depth of hypocenter; (x,y) the coordinate of the epicenter, and (xi, yi) the coordinates of the ithstation.
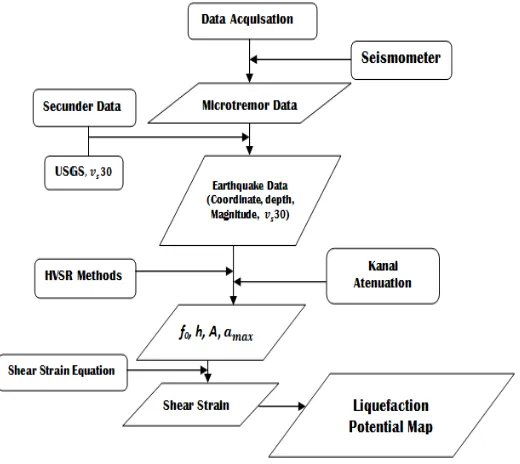
After the values of R in each station were known, the value of amax in each station could be calculated. After the values of amax, A and f0 were known, the value of could be calculated.
Figure 6. Input-output data flowchart
4. Results and Analysis
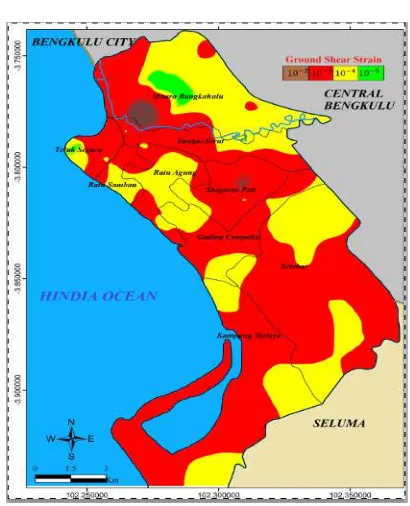
The potential of liquefaction in Bengkulu City determined from the distribution of shear strain as shown in Table 2. The distribution of shear strain values indicating the potential for liquefaction is shown in Figure 7. The colors show the potential for liquefaction of an area, ranging from brown (very potential), red (potential), yellow (not potential or safe) and green (safe).
Table 2. The Result of Micrometer Data Analysis Into Shear Strain
Num ID Lat (deg) Long (deg) γ Vs30 (m/s)
1 ST105 -3.802 102.256 0.0019 206
2 ST140 -3.821 102.280 0.0009 311
3 ST144 -3.789 102.326 0.0003 257
4 ST150 -3.836 102.314 0.0011 197
5 ST8 -3.739 102.322 0.0002 302
6 ST147 -3.831 102.331 0.0010 260
7 ST79 -3.829 102.287 0.0009 310
8 ST43 -3.824 102.291 0.0012 216
9 ST68 -3.767 102.285 0.0002 342
10 ST148 -3.787 102.250 0.0017 290
. . . .
. . . .
95 ST118 -3.756 102.293 0.0070 247
96 ST134 -3.763 102.292 0.0006 250
97 ST128 -3.759 102.291 0.0007 286
98 ST4 -3.753 102.290 0.0009 278
99 ST67 -3.768 102.280 0.0005 278
100 ST23 -3.791 102.283 0.0005 267
Figure 7. Map of shear strain in Bengkulu City
Figure 8. The percentage of liquefaction potential in Bengkulu City
Based on the potential for liquefaction, the areas in Bengkulu City can be categorized as very potential (1.83%), the potential (49.54%), safe (46.79%), and very safe (1.83%). The areas potentially and highly potentially to experience liquefaction in Bengkulu City are relatively large in term of land availability for settlement, offices, public facilities, and infrastructure. According to data published in “Bengkulu Dalam Angka” (13), the area for settlement gets larger over time, reaching 16% of the total city area in 2016. Most of the settlement area is in the coastal area. This is a bad situation because this area has high population density, many office buildings, and infrastructures. Liquefaction in this area will result in a large loss because most large physical structures will sink into the ground.
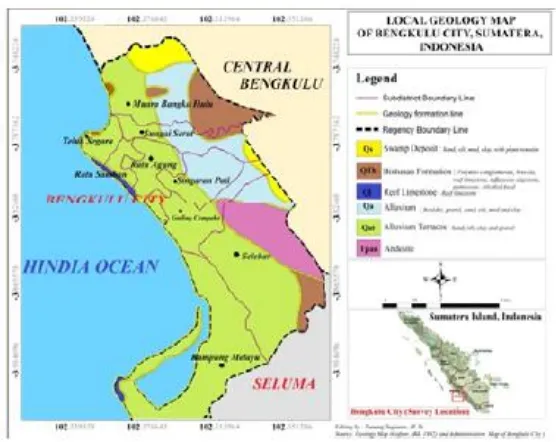
Figure 9. Local geology of Bengkulu City (2)
The results of this study are in accordance with the statement of (7) that the area in Yuan Lin which experienced liquefaction and suffered heavy damage was located in high shear strain zone based on micrometer data. The study of (14) which states that high shear strain value is located in the coastal area also supports our study (14). Almost all areas in Bengkulu have high shear strain value and are located in Alluvium Terraces. Nakamura et al. (10) conducted microseismic measurement in 400 locations in the area which suffered heavy damage during Kobe earthquake in 1965 (15). The measurement results showed a correlation between seismic vulnerability index and percentage of damage. The areas which suffered damage had a high seismic vulnerability, and vice versa. One of the damage is liquefaction. An area having high seismic vulnerability index has a high shear strain (16) automatically.
The areas which have high shear strain is located in the soft rock which has low shear wave velocity. Noutash et al. (17) state that measurement of liquefaction using wave shear velocity as an indicator may be conducted although it is not better than measurement using SPT (Standard Penetration Test). However, measurements of liquefaction potential using wave shear velocity as an indicator have been conducted by many researchers such as (3), (18) and (19). Theoretically, wave shear velocity is negatively correlated with shear strain. If the wave shear velocity is low, the shear strain is high. This correlation is shown in Figure 10.
City lies in an earthquake-prone area, using liquefaction map as part land use planning shows
that the city’s policy has a high concern for the community’s interest.
5. Conclusion
The measurement of liquefaction potential in an area can be done by measuring the shear strain in that area. This measurement may not be as good as that using the CSR and CRR methods, but the measurement of shear strain can be easily conducted because we just need to measure soil vibration and peak ground acceleration. The measurement of shear strain can produce not only the map of liquefaction potential, but also detection of the landslide, rockfall, beach erosion, and sediment thickness. The equipment to measure shear strain is portable and easy to operate. If it is correlated with the liquefaction using shear wave velocity data, the measurement of shear strain can be done directly using formula (10).
Acknowledgment
Part of this work was supported by the project of “Penelitian Hibah Pasca Doktor” (contract no. 919/UN30.15/LT/2017) funded by the Ministry of Research, Technology and Higher Education, the Republic of Indonesia. The authors thank Dr. Kuwat Triyana for correcting the manuscript.
References
[1] Marto A, Soon T. Short Review on Liquefaction Susceptibility. Int J Eng Res Appl. 2012; 2(3): 2115-9. [2] Sugianto N, Farid M, Suryanto W. Local geology condition of Bengkulu city based on seismic
vulnerability index (K<inf>g</inf>). ARPN J Eng Appl Sci. 2016; 11(7): 4797-803.
[3] Pathak SR, Dalvi a. N. Liquefaction Potential Assessment : An Elementary Approach. Int J Innov Res Sci Eng Technol. 2012; 1(2): 2010-2.
[4] Kumar V, Venkatesh K, Kumar Y. Approaches for Estimating Liquefaction Potential of Soils. Int J Struct Civ Eng [Internet]. 2012; 1(2): 35-53. Available from: http://www.ijsce.com/uploads/displayVolumeIssue/V1-I2-4.pdf
[5] Farid M, Suryanto W. Microseismic Wave Measurements to Detect Landslides in Bengkulu Shore with Attenuation Coefficient and Shear Strain Indicator. 2016; 2016(2015): 1-7.
[6] Fukushima Y, Köse O, Yürür T, Volant P, Cushing E, Guillande R. Attenuation characteristics of peak ground acceleration from fault trace of the 1999 Kocaeli (Turkey) earthquake and comparison of spectral acceleration with seismic design code. J Seismol. 2002; 6(3): 379-96.
[7] Huang HC, Tseng YS. Characteristics of soil liquefaction using H/V of microtremors in Yuan-Lin area, Taiwan. Terr Atmos Ocean Sci. 2002; 13(3): 325-38.
[8] SESAME. Guidelines for the implementation of the H/V spectral ratio technique on ambient vibrations. Rapp Final. 2004: 1-62.
[9] Kasus S, Haji GOR, Salim A, Lapai DAN. Analisa potensi likuifaksi berdasarkan data pengujian sondir (studi kasus gor haji agus salim dan lapai, padang). J Rekayasa Sipil. 2009; 5(1): 11-22. [10] Nakamura Y. Clear identification of fundamental idea of Nakamura’s technique and its applications.
Proc 12th world Conf. [Internet]. 2000;Paper no. 2656. Available from: http://www.sdr.co.jp/papers/n_tech_and_application.pdf
[11] Douglas BC. Global Sea Rise: A Redetermination. Surv Geophys [Internet]. 1997;18(2/3):279-92. Available from: http://dx.doi.org/10.1023/A:1006544227856%5Cn http://link.springer.com/10.1023/A:1006544227856
[12] Ishihara K. An Introduction to Soil Dynamic Mechanism. 1982;
[13] Badan Pusat Statistik Kota Bengkulu. Bengkulu Dalam Angka Tahun 2015. Lap Tah. 2015;
[15] Nakamura Y, Sato T, Nishinaga M. Local Site Effect of Kobe Based on Microtremor. Proc Sixth Int Conf Seism Zo EERI, Novemb 12-15, 2000/ Palm Springs Calif. 2000;3-8.
[16] Farid M, Sri Brotopuspito K, Wahyudi, Sunarto, Suryanto W. Ground shear strain and rate of erosion in the coastal area of north Bengkulu, Indonesia. Adv Mater Res. 2014; 896: 521-4.
[17] Noutash MK, Dabiri R, Bonab MH. The Evaluation of Soil Liquefaction Potential Using Shear Wave Velocity Based on Empirical Relationships. Int J Eng. 2012; 6(4): 218-32.
[18] Satyam DN, Rao KS. Liquefaction Hazard Assessment Using SPT and VS for Two Cities in India.
Indian Geotech J [Internet]. 2014;44(4):468-79. Available from: http://link.springer.com/10.1007/s40098-014-0098-2