Caspian Journal of Applied Sciences Research, 2(2), pp. 143-153, 2013 Available online at http://www.cjasr.com
ISSN: 2251-9114, ©2012 CJASR DOI:
AWAM International Conference on Civil Engineering &Geohazard Information Zonation
The relationships among ground shear strain, shore characteristics and abrasion
on the west coast of Bengkulu Province, Indonesia
Muhammad Farid1, Kirbani Sri Brotopuspito1, Wahyudi1, Sunarto2, Wiwit Suryanto1*
1
Geophysics Laboratory, Physics Department, UniversitasGadjahMada Yogyakarta, Indonesia
2
Department of Physical Geography, UniversitasGadjahMada Yogyakarta, Indonesia
*
Corresponding Author:wiwit@gadjahmada.edu
This research characterises shore types on the west coast of Indonesia’s Bengkulu province based on a variety of geological conditions, especially the ground shear strain, which serves as an indicator of the rate of abrasion. For each shore type, the ground motions were measured using a short period seismograph. The ratio of the horizontal to vertical spectral values (HVSR) provided the dominant frequency ( ) and peak amplitude of the HVSR spectrum ( ). The value of the seismic vulnerability index ( ) could then be calculated using an
empirical formula. The ground shear strain was obtained by multiplying the Seismic Vulnerability Index ( )
by Peak Ground Acceleration ( ) using the Kanai’s empirical attenuation relationship. The results show that the ground shear strain values on the western coast of Bengkulu province are characteristic of eight different types of coastline, with the GSS values ranging from 1.6 x 10⁻⁴to 78.3 x 10⁻⁴.
Keyword:Abrasion, Ground Shear Strain , Bengkulu Province, HVSR
1.
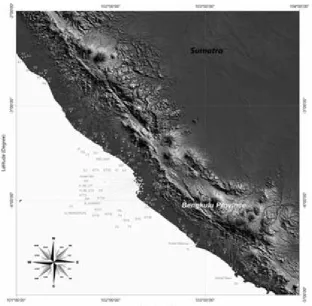
INTRODUCTIONBengkulu province stretches from 101°1' to 103° 46' E and 2°16' to 5°13' S, with approximately 525 km of coastline facing the Indian Ocean. The area is located to the east of the subduction zone of the Indo-Australian and Eurasian plates and is therefore very seismically active (Figure 1). Based on historical seismicity, the province is an earthquake-prone area, and approximately 95% of earthquakes have had hypocenters located under the Indian Ocean (BMKG, 2009). Bird (1984) divided the coast into two distinct types, the shore and the coast. A shore defined as an area of the seafront that consists of a mixture between gravel and sand that the waves are not strong enough to carry away. Hantoro (2009) explained that there are two characteristic types of coast, gently sloping sandy shore and steep rocky shore.
In this paper, we studied the shore types in Bengkulu province and classified the characteristics of the coast according to eight types i.e. (1) flat fine sand shore, (2) flat rocky shore, (3) flat muddy shore, (4) flat coarse sand shore, (5) rugged cliffs, (6) cliffs of alluvial clay, (7) cliffs of
tuffa clay and (8) cliffs of sandy tuffa. The shore types were determined based on the coastal geology and the morphology of the coastal region. We calculated the ground shear strain based on microseismic measurement data for each of eight types. The ground shear strain offers a quantitative measure to distinguish among the eight type of coast. Coastal erosion is largely a result of external factors, especially the strength of the waves beating against the shore. However, in our study area coastal erosion from internal factors, namely the seismic vulnerability of the coast, was observed, as this coast is often affected by earthquakes. The Seismic Vulnerability Index (Kg)
describes the tendency of the surface soil layers to deform during earthquakes.
2. THEORETICAL FRAMEWORK
The seismic vulnerability index is obtained by squaring the HVSR spectrum and dividing by the peak value of the predominant frequency and is defined as (Nakamura, 2000):
=
The relationships among ground shear strain, shore characteristics and abrasion on the west coast of Bengkulu Province, Indonesia
143
where is the seismic vulnerability index, is the index of HVSR spectral peaks, and is the predominant frequency.The seismic vulnerability index is often related to geomorphological conditions. Nakamura (2004) showed that areas with a high seismic vulnerability index on the coast of Kobe, Japan were composed of alluvial.
Gurler et al. (2000) found that the areas in Mexico City that had high seismic vulnerability were found in zones that were formerly wetlands and reclaimed areas, whereas the transition region (between the alluvial plains and hills) had relatively low seismic vulnerability index values. Furthermore, in the hills, the seismic vulnerability index was very low. Saita (2004) reported that high seismic vulnerability was indicative of reclaimed areas in Intramuros, Philippines. In a study in San Francisco’s Marina district, there was a relationship between the seismic vulnerability index and
the geomorphological conditions in
the area (Nakamura, 2008). The results showed that hilly areas possessed a low seismic vulnerability index, whereas the coastal alluvium material showed a high seismic vulnerability index.
2.1. Acceleration in Basic Rocks and Ground Shear Strain
The ground shear strain (γ) of the surface soil layer describes its ability to stretch or shift during earthquakes (Kanai, 1951). The ground shear-strain of the surface soil layer during an earthquake is calculated by multiplying the seismic vulnerability index value from the microtremor measurement by the ground acceleration in the bedrock, using the following formula:
= × 10 ×
(2)
Caspian Journal of Applied Sciences Research, 2(2), pp. 143-153, 2013
where is the ground shear strain, is the seismic vulnerability index, and is the peak ground acceleration. There are several empirical formulas to calculate the acceleration in bedrock. In this research, we calculate the shear-strain ground acceleration using Kanai’s [11] empirical formula, which is expressed as:
= 5
10 . .
.
. .
(3)
where is acceleration in the bedrock, is the predominant period, is the moment magnitude, and is the epicentral distance.
Ishihara (1982) originally developed the relationship between ground shear-strain values and surface soil conditions. High ground shear-strain values are found in soil layers that deform, for example, through ground cracks, liquefaction and avalanches. Conversely, smaller ground shear strain values indicate solid rock and a layer that is hard to deform. Only waves and vibrations will occur in areas with a ground shear strain of 10-6, but avalanches and liquefaction can occur at a ground shear strain of 10-2 (Table 1). Higher ground shear-strain values can lead to deformation of the surface soil layer.
Characteristics of an area with a given seismic vulnerability index, such as microtremors, ground shear-strain, and the ratio of house damage, vary with the landform unit (Daryono, 2011).
The high level of coastal erosion in Bengkulu province led us to investigate potential causes beyond the strong wave action of the Indian Ocean. Abrasion speed varies with geological and morphological conditions. Suwarsono (1999) found that the abrasion rate reached 1.12 to 1.25 meters per year along the coast of North Bengkulu. The abrasion rate in South Bengkulu is 1.8 meters per year, and in Mukomuko district, the abrasion rate is 0.9 meters per year. In Bengkulu city, the shore abrasion reaches 2-5 meters per year (Junaidi, 2000; Kesumajaya, 2006).
Deformation that occurs in a region due to earthquakes will increase the ground shear strain. The relationship between the strain and the soil dynamics caused by earthquakes is outlined in Table 1.
2. DATA COLLECTION
We collected microtremor data during from October 5 to November 4, 2011 using short period
seismometers (velocity sensitive sensor, three components) with a sampling frequency of 100 Hz, a 24-bit digitizer equipped with a solar cell panel and GPS for timing system. The data were processed in ASCII format using DATAPRO software. For the HVSR processes we used Geopsy software (Wathelet, 2005). ArcGIS was used for map making, and Golden Software Surfer was utilised for contour information. We observed ambient seismic data for 105 locations along the coast of Bengkulu Province (Figure 2).
3. RESULTS AND DISCUSSION
We obtained eight microtremor spectra from the data using the HVSR method. There was a tendency for the spectral shapes to change with the type of shore. The shape of the spectrum, the dominant frequency (fo), the peak of the spectrum
(A), the Seismic Vulnerability Index (Kg), Peak
Ground Acceleration (PGA) and Ground-Shear Strain (GSS) of each type of shore are shown in Table 2. The eight types of beach showed characteristic variations, especially in the ground shear strain value. The hard shores had the lowest ground shear strain, and the fine shore types showed higher ground shear strain. The shore with abrasion showed a very high ground shear strain. Each shore type had a unique seismic vulnerability index (Kg). “From lowest to highest, they were as
follows: 0.48 for the flat coarse sand shore; 0.5 for the flat rocky shore; 1.31 for rugged cliffs; 1.6 for the flat fine sand shore; 2.8 for the cliffs of sandy tufa; 4.2 for the cliffs of tufa clay; 7.6 for the flat muddy shore; and 16.1 for cliffs of alluvial clay.
Each type of shore in this study had a unique
This discussion focuses on assessing the factors that influence the variation in the seismic vulnerability index and the spatial distribution of seismic vulnerability index values for each type of shore.
The relationships among ground shear strain, shore characteristics and abrasion on the west coast of Bengkulu Province, Indonesia
143
Fig. 2:
Distribution of measurement point along the west coast of Bengkulu Province, Indonesia
Table 1:
Strain value and the dynamics of soil (Nakamura et al., 2003)
Size of Strain 10-6 10-5 10-4 10-3 10-2 10-1 Phenomena Wave, Vibration Crack, Settlement Landslide, Soil Compaction
Liquefaction
Dynamic Properties Elasticity Elasto-Plasticity Collapse,
Repeat and Speed-Effect of Loading
Table 2:
Characteristics in the Coastal Region Earthquake
Beach Type Spectrum GSS Map Data Quantity
Fine Sand Beach
1
fo= 0.7
A = 1.05 Kg= 1.6
Caspian Journal of Applied Sciences Research, 2(2), pp. 143-153, 2013
Rocky beach
fo= 5.1
A = 1.55 Kg= 0.5
PGA = 352.8 GSS = 1.7x 10⁻⁴
Muddy beach
fo= 1.7
A = 3.59 Kg= 7.6
PGA = 239.2 GSS = 1.2x 10⁻³
Sandy rough beach
fo= 10.8
A = 1.78 Kg= 0.3
PGA = 723.4 GSS = 2.1x 10⁻⁴
Cliff rugged beach
fo= 12.1
A = 9.98 Kg= 1.3
PGA = 731.5 GSS =9.6x 10⁻⁴
Abrasion
Rugged coastal alluvial clay
fo= 3.0
A = 6.95 Kg= 16.1
PGA = 486.4 GSS = 7.8x 10⁻³
The relationships among ground shear strain, shore characteristics and abrasion on the west coast of Bengkulu Province, Indonesia
Stone clay rugged coast tufa
fo= 3.3
vulnerability is primarily determined by the coastal lithology conditions. All factors that affect the level of seismic vulnerability are static because they are determined by the origin of the shore itself. Soil with higher values tends to be more susceptible to deformation. Although the flat muddy shore is highly unstable, the cliffs of alluvial clay have the greatest vulnerability index. As shown in Table 2, they tend to slide from the top when exposed to strong abrasion, and their condition is affected by the seismic vulnerability of abrasion, as are the rugged cliffs, which are composed by volcanic sediments and have a medium value. In this context, the higher the seismic vulnerability index of a shore type, the more susceptible it is to abrasion. The shore tends to stabilise the condition of fine sandy shores, cliffs of alluvial clay, 521.0 gal for the cliffs of tufa clay, and 462.7 gal for the cliffs of sandy tufa. Peak ground acceleration values do not always have an impact on coastal rock deformation. For instance, flat muddy shores with high seismic vulnerability have a low peak ground acceleration (239.2 gal), and the rugged cliffs show a high peak ground acceleration (731.5), although their vulnerability index value is low.
The Peak ground acceleration of each shore type is as follows: 261.4 gal at fine sand shores, 352.8 gal for flat rocky shores, 239.2 gal for muddy coast, 723.4 gal for coarse sand shore, 731.5 gal for the rugged cliffs, 486.4 gal for the cliffs of alluvial clay, 521.0 gal for the cliffs of tufa clay, and 462.7 gal for the cliffs of sandy tufa. Peak ground acceleration values do not always have an impact on coastal rock deformation. For instance, flat muddy shores with high seismic vulnerability have a low peak ground acceleration (239.2 gal), and the rugged cliffs show a high peak ground acceleration (731.5), although their vulnerability index value is low.
Caspian Journal of Applied Sciences Research, 2(2), pp. 143-153, 2013
4. CONCLUSION
The results of the spectral analysis of the eight types of beach can be summarised as follows: The characteristic microtremor spectrum changes according to the type of shore. Shore that is exposed to abrasion tends to have a lower index of seismic vulnerability and higher ground shear strain than stable shores. Shores that experience abrasion have values of ground strain shear on the order of 10-3.
ACKNOWLEDGEMENT
We thanks to Nugroho Budi Wibowo of Climatology, BMKG, Yogyakarta Office during the field work and the students and technician of the Universitas Bengkulu.
REFERENCES
Bird E (2008). Coastal Geomorphology: An Introduction, Second Edition, John Willey and Sons Ltd, England.
BMKG (2009).Bengkulu Earthquake History from 1800, Meteorology, Climatology and Geophysical Agencies of Indonesia.
Daryono(2011), Seismic Vulnerability Index Based Microtremor each unit on landforms in BantulGraben Zone Special Region Yogyakarta, Dissertation UniversitasGadjahMada, Indonesia.
GurlerED, Nakamura Y, Saita J, Sato T (2000). Local site effect of Mexico City based on microtremor measurement, 6th International Conference on Seismic Zonation, Palm Spring Riviera Resort, California, USA, pp.65.
Hantoro WS (2009). Effect of Marine and Coastal Characteristics : The development of the
City Shore Area, Research Center for Geotechnology Indonesia.
Junaidi F (2000), Abrasion and Traditional Market Conditions at the South City of Bengkulu, Bachelor Thesis Universitas Bengkulu, Indonesia.
Kanai K (1951). Relation Between the Nature of Surface Layer and the Amplitude of Earthquake Motions, Bulletin Tokyo Earthquake Research Institute.Kesumajaya, E., 2006. Sedimentation and Erosion Studies Gulf Coast Segara Bengkulu District, Thesis Faculty of Civil Engineering and Planning InstitutTeknologi Bandung, Indonesia. Nakamura Y (2000). Clear Identification of
Fundamental Idea of Nakamura’s Technique and Its Application. 12th World Conference of Earthquake Engineering, 2656, New Zealand
Nakamura Y (2004).UrEDAS, Urgent Earthquake Detection and Alarm System, now and future.13th World Conference on Earthquake Engineering, paper #908.
NakamuraY (2008). On The H/V Spectrum. The 14th World Conference on Earthquake Engineering, Beijing, China.
Saita J, Bautista M L P, Nakamura Y (2004). On Relationship Between The Estimated Strong Motion Characteristic of Surface Layer and The Earthquake Damage: Case Study at Intramuros, Metro Manila-. 13thWorld Conference on Earthquake Engineering, Paper No. 905, Vancouver, BC, Canada. Suwarsono(1999).Sea Wave Energy Swash as the
Basic Determination of Abrasion Speed, Thesis Universitas Bengkulu, Indonesia. Wathelet M (2005). Array recordings of ambient