THE ECONOMIC EFFECT OF DEMOCRATIC SECURITY POLICY
AGAINST INEQUITY: EMPIRICAL CASE FROM COLOMBIA,
2000-2006
Yeremia Natanael1, Farhan Rahadian2 1Department of Economic Science, University of Indonesia
2Department of Political Science, University of Indonesia
Email: [email protected]
Abstract
Colombia was the 5th largest economic power in South America and 31st in the worldin 1990, with petroleum commodity making up almost half of the entire income. Despite the records and resources, the distribution was centralized in major metropolitan areas such as Bogota, Medellin and Cali. At its worst, during 2000-2006, Colombia experienced an increasing in GDP per Capita followed by an often fluctuate Gini Ratio higher than 0,5 which may fall into the category of high inequity. As part
of Qresident Blvaro Vribes democratic security policy- war against terrorism and
illegal drug trading was implied by showing domination of the military between 2000-2004. Several operations and sieges were carried out all over the country to seize the objectives. Throughout the operation, the civil society was on the verge of political and social turmoil. Using a high quality dataset of wealth indicators over the period 2000-2006, this paper develops a correlation of the economic performance and socio-political condition. This model is parameterized by a dataset of graphs which describes the condition of wealth in Colombia. Having similarities in political and economical situation, the experience of Colombia could be a lesson, review or benchmark for the development progress of Indonesia.
Keywords: Inequity, Income Inequality, Gini Ratio, GDP Per Capita, Democratic Security Policy
INTRODUCTION
The sustainability of the economy of a country is certainly influenced by its own political circumstances. The composition of the government will definitely determine the economic regulations and policies. Then problem will arise when the centre-role is hampered from internal and external factors. Political instability is one of the conditions that are a mixture of both factors that can cause a crisis in all aspects of the state. Many researchers, professors and independent institutions have found a positive correlation between political instability and general economic growth. The most widely taken conclusion is the first one reduces the latter.
coefficient, exceeding the medium level. This period was known as one of the worst times for colombia that have experienced many conflicts. By exposing this case, this paper will try to examine the concrete evidences of the relationship between political instability and inequity distribution of wealth.
LITERATURE REVIEW
Political Instability
Generally, political instability can be described as a collection of events that struck a country in a certain matter of condition. As there is no central definition of political instability, many works have tried to measure it using various variables and indicators. Barro (1991) tried to measure the concept by showing dataset of revolutions, coups and political assasinations on more than 70 countries. However this example have only defined political instability in just outer core since the concept also needs to include more other notable events such as demonstration, cabinet reshuffle or terrorist insurgency. The more extensive variables by Alesina et al. (1996) includes three broad classes: 1) political unrest such as cabinet
adjustments= 3* •structural• institutional variables such as the HEQ per capita and being a
democracy or not; 3) economic performance in particular growth level. In contrary, Jong-A-Pin (2008) presented more complete political variables than Barro (1991) while neglecting institutional and economic variables by Alesina et al. (1996).
Inequality and Society Economic Welfare Gini Ratio and Inequality
There are two sizes are generally used to analyze the income distribution (Todaro and Smith, 2006) are the size distribution of income and functional or factor share distribution of income, and the functional or factor share of income distribution focuses on a part of the total national income received by each of the factors of production (land, labor, and capital). One of the measurements which reflect the inequality of income distribution is the Gini coefficient (Gini Ratio). The Gini Ratio is mostly used to measure the overall level of income inequality, with a broad measurement of a curve that describes the distribution of income for all of income groups. The curve is called the Lorenz curve, which is a curve that compares the cumulative expenditure distribution of a particular variable with uniform distribution which represents the cumulative percentage of the population. If revenues are distributed perfectly, all the points will be located on a diagonal line. The shaded areas will be zero because the area is equal to the diagonal line, and thus the coefficient number equal to zero. Conversely, when only one party who receives all income, the area shaded areas will be equal to the area of the triangle, so that the Gini coefficient worth one. Therefore, it could be concluded that a more equitable distribution of income is said when the value of the Gini coefficient close to zero (0), while an increasingly unequal distribution of income, the Gini coefficient value of its increasingly close to one. Criteria based on the Gini coefficient of income inequality (Susanti, 2007) are as follows:
Mess than 0. 4 : Low degree of inequality Cetween 1/5-0.5 : Moderate inequality Iigher than 1/6 : High degree of inequality
The Gini coefficient is a measure of income inequality that meet four criteria (Todaro and Smith, 2006). First, the principle of anonymity, the size of the imbalances should not depend on who earn higher incomes. The measure does not depend on what we believe to be a better human being, whether it be the rich or the poor. Secondly, the principle of independence of the scale, the size of inequality does not depend on whether we measure revenues in dollars or in cents, or whether the country's economy on average, rich or poor. Thirdly, The principle of independence of the population, this principle states that the measurement of inequality should not be based on the number of recipients of income (total population). For example, China's economy should not be said to be more equitable or more unequal than Singaporean economy only because the China has more population. Fourthly, the principle of transfer, this principle is also often referred to as the Pigou-Dalton principle.
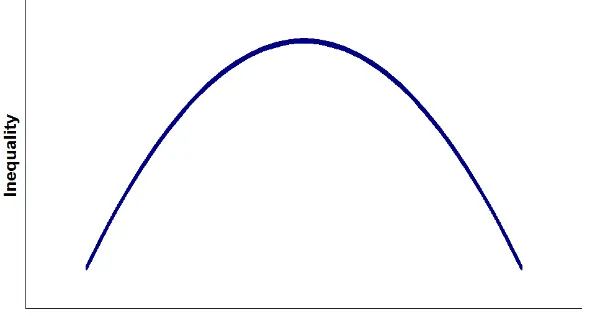
GDP Per Capita and Kuznets's Hypothesis
explained by using Luznets hypothesis/ Uhe Luznets hypothesis explains relationship between the economic growth of a country with inequality distribution of income among the population. Using data from country to country (cross section) and data from a number of surveys or observation in any country with time series data, Kuznets find the relation between income inequality and income per capita represent inverted shaped. This U-shaped indicates that in the early stages of economic growth, income distribution tends to worsen (inequality rises), but on the next stage will improve income distribution (inequality decline). Inverted U hypothesis put forward Kuznets argument is based on the theory of Lewis regarding the movement of people from rural areas (agriculture) to urban (industrial sector). Rural areas are very densely populated, resulting in the level of wages in the agricultural sector is very low, while in urban areas the wage level is relatively high because the population or work force is relatively small, and makes the supply of labor from the sector to the industrial sector is not limited. Several empirical studies conducted to test the hypothesis Kuznets using macro data from a number of countries, associated with the relationship between economic growth and income inequality. The empirical studies carried out three important notes (Tambunan, 2001). First, several studies conducted reject the hypothesis Kuznets. Empirical studies conducted Ravallion and Datt (1996) of India shows that during the period of the 1950s to the 1990s the average income per capita increases and the development trend of economic inequality showed a negative angle (downhill). Analysis of the 60 developing countries conducted by Adams (2004) also showed that GDP per capita has no effect on income inequality.
Second, although in general this hypothesis is accepted, but most of these studies show that the positive relationship between economic growth and equity on a long-term period only evident for a group of industrialized and developed countries (the group of countries with high levels of income ). Third, the gap portion of the Kuznets curve (left) tends to be more volatile than the portion of the gap decreases from the curve (top right). The gap tends to decrease for countries in the medium and high income levels. Thus, since the gap portion of the curve is composed of low-income countries, the relationship is more unstable for these countries. Recent developments of studies on economic development, no longer focused on whether or not the hypothesis Kuznets effect, but rather the positive impact of economic growth on poverty reduction with the possibility of an increase in income inequality (Wodon, 1999).
It was found that the income inequality is strongly influenced by the amount of social contributions which makes the panel data for various countries biased. The inverted U-curve was found in the countries with low amount of social contributions. With increasing amount of social contribution the inverted U-curve flattens, its maximum decreases and position of the turning point is shifted to higher GDP per capita.
country specific time series. They did not found any support for the Kuznets inverted U-curve neither in the cross-country analysis nor in the country specific inter-temporal data. On the other hand, Jha (1996) analyzed observations for 76 countries for the period 1960-92 and found that Kuznets hypothesis holds. Similarly Milanovic (2000) reported that Kuznets hypothesis was supported by data for 80 countries during the 1980s.
Figure 1. Kuznet Curve
METHODOLOGY
Data used for analyze political stability is from the Politically Motivated Violance Ranking by Jong-A-Pin (2008). This ranking indicates political stability in a country. Low ranking refers to a stable country and a high ranking refers to an unstable country. Most of paper utilize data of Gini ratio and GDP per Capita of Colombia during 2000-2006 for economic analysis. In this paper, the effect of democratic policy on inequity will be explained by the alteration of Gini ratio and GDP per Capita compared and contrasted for the same time period. The Gini ratio could represent income distribution and income inequality, while GDP per Capita could represent standard of living of Colombia people. The Gini ratio and percentage changes were obtained from Ieconomics. The macroeconomic and socioeconomic variables are from the World Bank World Development Indicators Database (WDID), and Ieconomics.
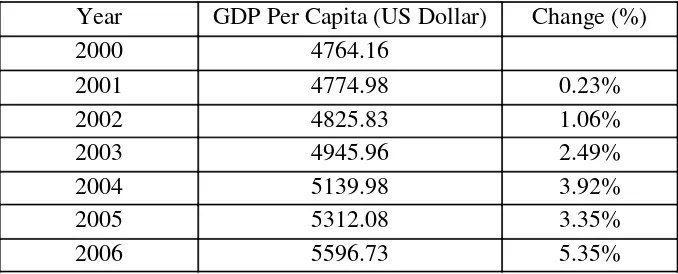
GDP per Capita is increasing over the period, followed by increasing percentage of change. This indicates a better standard of living of Colombia people.
Table 1. Colombia Gini Ratio, 2000-2006. Source: Ieconomics
Year Gini Ratio Change (%)
2000 0.587
2001 0.577 -1.57%
2002 0.583 0.87%
2003 0.544 -6.61%
2004 0.561 3.12%
2005 0.550 -1.91%
2006 0.600 9.16%
Table 2. Colombia GDP Per Capita, 2000-2006. Source: Ieconomics
Year GDP Per Capita (US Dollar) Change (%)
2000 4764.16
2001 4774.98 0.23%
2002 4825.83 1.06%
2003 4945.96 2.49%
2004 5139.98 3.92%
2005 5312.08 3.35%
2006 5596.73 5.35%
Another methodology used for the analysis is social contribution of Colombia during the period. Social contribution of country with extremely high amount of social contributions where all income is equally distributed among all citizens the Kuznets curve cannot exist because the Gini index must be always zero independently on the level of economic development )ek and Nelikhova- 3125*- vice versa/ The category of amount of social contributions is expressed in % of GDP: low amount (< 5 %), intermediate amount, (5-10 %), high amount (10-15 %), very high amount (> 15 %).
RESULT ANALYSIS
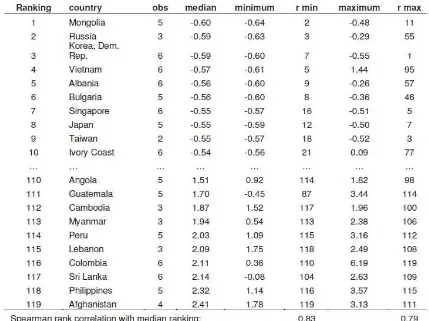
According to the works of Jong-A-Pin (2008), Colombia is an unstable country based on the amount of politically motivated violence with a low ranking refers to a stable country and a high ranking refers to an unstable country. Table 3 shows that Colombia is ranked 116 out of 119 countries observed, which could be categorized as high rank, and thus Colombia refers to an unstable country.
Table 3. Politically Motivated Violance Ranking. Source: Jong-A-Pin (2008)
pioneers of social-revolutionary terrorist who rejected the supremacy of the democratic government.
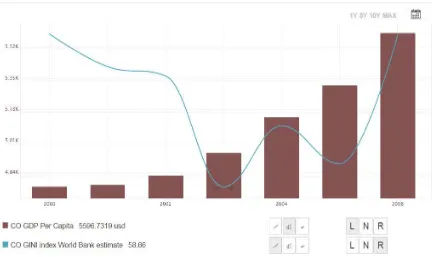
Political instability in Colombia is undeniable gives effect to its economic condition, mainly on inequity, reflects from its income inequality which is measured by Gini ratio. Based on data of Gini Ratio and GDP Per Capita of Colombia during period 2000-2006, Figure 2 shows graphically the alteration of the variables. During period 2000-2006, GDP per Capita of Colombia has constantly increased with different increase percentages. While GDP per Capita continues to rise, Colombia still experiencing fluctuate Gini index with value higher than 0,5 over the same period, which may fall into the category of high degree of inequality. This indicates Dolombia peoples standard of living are getting better, nevertheless there is no improvement on reducing income inequality. Moreover, this indicates economic growth of Dolombia has been going well- yet societys welfare remain concern for the government, not all people relish the increasing GDP per Capita.
Figure 2 Gini Index and GDP Per Capita Colombia, Period 2000-2006. Source: Ieconomics
intermediate amount of social contribution as many of Colombia budgets, resources and chances for more than five decades are taken by the conflict and battle against terorrism.
Gigure 4/ Tcatter Qlot Segression Hini Jndex versus log )HEQ per Dapita*/ Tource< ek and
Melikhova (2014)
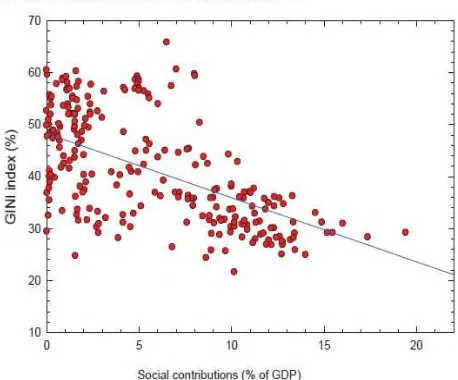
Figure 4. Scatter Plot Dependence of Gini Index on Social Contribution/ Tource< ek and Melikhova (2014)
there is negative relationship between income inequality and social contribution, more social contribution lead to lower income inequality, vice versa. The inverted U-curve was found in the countries with low amount of social contributions. Colombia has 7.63% of revenue for social contribution in 2000, which could be categorized as intermediate amount of social contribution could be evidence of this research, as its income inequality is relatively high on those period.
By showing a positive correlation between political instability and distribution of wealth, many actions can be taken as a preventive way in the future to hold against the latter. Especially for the developing countries that have some similarities in background, including Indonesia. Third world countries share the common complication of unstable regime, radical opposition, and also separatist movement. This case showed the effect of dangerous obstacles above. Identifying and solving the root of the problem first is an option that worth a try. For this case, terrorism is the main act for the political instability, so unriddling the complicated world of it might be the best shot to shut the integral part of the problem. Furthermore, this brief explanation of the whole issue as once provides a new insight that might be turned into fullscale research. One important thing is that social contribution plays crucial role for country with increasing GDP per Capita to redistribute wealth of society, and thus could suppress value of Gini ratio and income inequality. Hence, the government of developing countries, including Indonesia need not to lose sight of the importance of social contribution.
CONCLUSION
Colombia is an unstable country based on the amount of politically motivated violence with a low ranking refers to a stable country and a high ranking refers to an unstable country, whereas terrorism is the biggest contributor in political instability of Colombia. Instability political in Colombia played role in the intermediate amount of social contribution as many of Colombia budgets, resources and chances for more than five decades are taken by the conflict and battle against terorrism, which could be one reason to a high fluctuate value of Gini ratio during period 2000-3117/ Blthough Dolombia peoples standard of living are getting better, nevertheless there is no improvement on reducing income inequality. Thus, government of developing countries need to consider social contribution as a means to solve the problem of inequity.
REFERENCES
ek- K/- ' Nelikhova- P/ )3125*/ Luznets Jnverted V-Curve Hypothesis Examined On Up-to-Date Observations for 145 Countries.Prague Economic Papers, 3, 2014
Gallo, Cesar. (2002). Economic Growth And Income Inequality: Theoretical Background And Empirical Evidence.Working PaperNo. 119 University College London
Naguib, Costanza. (2015). The Relationship between Inequality and GDP Growth: an Empirical Approach.Luxembourg Income Study (LIS), asbl No. 631
Sanín, F., Acevedo, T., & Viatela, J. (2007).Violent liberalism? State, conflict, and political regime in Colombia, 1930-2006. Universidad Nacional de Colombia.
Waldman, Peter. 2012. The Anomic State: Law, Insecurity and Everyday Life in Latin