Procedia Chemistry 4 ( 2012 ) 164 – 171
1876-6196 © 2012 Published by Elsevier Ltd. doi: 10.1016/j.proche.2012.06.023
The Influences of Elastomer toward Crystallization of
Poly(lactic acid)
M. Kaavessina
a,b,*, I. Ali
c, S.M. Al-Zahrani
a,daDepartment of Chemical Engineering, King Saud University, Riyadh 11421, Saudi Arabia bDepartment of Chemical Engineering, Sebelas Maret University, Surakarta 57126, Indonesia cSABIC Polymer Research Center (SPRC), King Saud University, Riyadh 11421, Saudi Arabia
dCenter of Excellence on Research of Engineering Material (CEREM), King Saud University, Riyadh 11421, Saudi Arabia
Abstract
Poly (lactic acid)/elastomer blends were prepared via direct injection molding. In non-isothermal crystallization scan, the crystallinity of PLA increased with a decrease in the heating and cooling rate. The melt crystallization of PLA appeared in the low cooling rate (1, 5 and 7.5 qC/min). The presence of elastomer tended also to increase the crystallinity of PLA. However, it started to decrease in 30% of elastomer. It was also showed by the decreasing of cold crystallization activation energy. Elastomer also gave plasticization effect in PLA properties. Thermal treatment through annealing completed after 1 h at 80 qC. In isothermal crystallization scan, the cold crystallization rate increased with increasing crystallization temperature in the blends. The Avrami analysis showed that at low temperatures, the cold crystallization had two regime processes whereas at high temperature only one stage was observed.
© 2012 Published by Elsevier Ltd.
Keywords: Poly(lactic acid); elastomer; crystallinity; cold crystallization; crystallization kinetics.
1. Introduction
Recently, environmental issues have encouraged researchers from academia and industry to develop biodegradable polymer. Poly (lactic acid)/PLA, linear aliphatic polyester, has been well acknowledged as having a better potential of mechanical properties, biocompatibility and thermal plasticity. These properties were comparable to polystyrene (PS), polyethylene (PE) and polyethylene terephthalate (PET) [1]. PLA was synthesized from renewable resources and degraded to nontoxic of simple and natural product in a relative short time. Therefore, they were able to encourage its use in many applications [2-3].
* Corresponding author. Tel.: +966-1-4676873; fax: +966-1-4678770
PLA has also drawbacks that limited its range of applications.Several methods have been developed to obtain desirable properties of PLA such as: high flexibility, ductility and high impact without altering its tensile properties. One of the most economical and practical strategies to tailor the properties of PLA is melt blending with another polymer. Although, copolymerization exhibited better performance than melt blending, it required more knowledge of reaction and polymerization during the process [4-5].
Elastomers are polymers which have low young modulus and high yield strain. If an amorphous polymer has a temperature glass transition (Tg) below room temperature, it will have elastomer properties,
i.e. soft and rubbery. By introducing of elastomer via melt blending, a new class of PLA can be expected with enhanced elastic and ductile properties. In previous study, Zhang et al. [6] and Zaman et al. [7] reported the depletion of tensile modulus and enhancement of yield strain of PLA in the addition of elastomer through melt blending. However, they have not detailed the crystallization behavior of its attendant properties.
Considering the relationship between molecular structure and property, crystallinity reflected to mechanical and thermal properties [2,8]. Thus, understanding of crystallization kinetic is also important allowing for the design of materials with desirable properties. For example, the lower crystallization rate required longer time to obtain the certain crystallinity, the amorphous phase was obtained in short time. Liao et al. [9] concluded that crystallization rate decreased as increasing temperature in isothermal scan. Due to the most process were operated under non isothermal. The study of non-isothermal crystallization kinetic was also important [3].
In this investigation, details of crystallization behavior of PLA/elastomer are reported. PLA and elastomer is blended by injection molding directly. By using differential scanning calorimetry (DSC), dynamic mechanical analysis (DMA) and X-ray diffraction (XRD), the cold and melt crystallization phenomenon is elucidated. The cold crystallization during non-isothermal and isothermal mode is also described, including the effect of thermal treatment on cold crystallization.
2. Experiment
2.1.Materials
Poly(lactic acid)/PLA, commercial name “PLI003”, was kindly supplied by NatureplastTM(France). It is an injection molding grade of PLA which has a density of 1.25 g/mL and melt flow index (MFI) of 12-20 g/10 min (190 qC/2.16 kg). Elastomer, commercial name “NPEL001”, was also supplied by NatureplastTM(France). It has density of 1.23 g/mL and opaque. PLA was melt blended with elastomer via injection molding directly. Then, the PLA/elastomer samples were named as PLA, PLA10, PLA20 and PLA30 that refer to the composition of elastomer as follows: 0, 10, 20, and 30 wt%, respectively.
2.2.Melt blending
2.3.Characterization
The thermal properties of PLA were performed by A Shimadzu DSC60 in non isothermal and isothermal scans, their procedures as follows:
Non isothermal scan. The procedure of this part was: first heating with a ramp of 10 qC/min from room temperature up to 200 qC and kept at this temperature for 5 min to discard any anterior thermal history, and cooled down at a ramp of 10 qC/min down to 25 qC, second heating scan from 25 to 300 qC with a ramp of 10 qC/min. The various ramps were employed at 1, 5, 7.5, 15 and 20 qC/min for all blend samples.
Isothermal scan. The procedure of this part was: first heating with a ramp of 10 qC/min from room temperature up to 200 qC and kept at this temperature for 5 min to discard any anterior thermal history and subsequently cooling at 10 qC/min to 25 qC. The second heating scan from 25 qC to various Tiso at
50 qC/min and held for 5 min, then heated at 10 qC/min to 250 qC to get the melt temperature.
The plasticization effect of elastomer was investigated by using a dynamic mechanical analyzer (AR G2, TA instrument). It was done within temperature range of 26-90 qC at a frequency 1Hz, strain 1% and heating rate 2 qC/min to determine temperature dependence of storage modulus (G’) of the solid samples.
The degree of crystallinity was also evaluated by XRD analysis. It was performed on XMD 300 (Unisantis, Germany) with Cu-KD radiation (wavelength, O=1.5406 Å), operated at 45 kV and 0.8 mA.
The scanning rate was operated at 0.16q/sec with angle scanning from 5 to 80q.
3. Results and Discussion
3.1. Non isothermal scan
It could be highlighted from Table 1. The melt crystallization tended to appear in cooling rate lower than 7.5 qC/min while the cold crystallization was absent in this rate. Melt crystallization temperature shifted to lower temperature when cooling rate was increased. It meant that PLA started to crystallize slower at high cooling rate. In other hand, cold crystallization temperature had a tendency to shift to higher temperature with increasing heating rate. As a whole, there was not enough time for PLA chains to rearrange into a crystalline structure in the fast cooling/heating rate. Thus, it was obtaining PLA more amorphous. Further, this statement was proved and discussed later.
By increasing the heating rate from 7.5 to 20 qC/min, the exothermic cold crystallization peaks became wider and shifted to a higher temperature. It indicated that there was not enough time during crystallization at high heating rate [3]. In the same heating rate, the cold crystallization temperature decreased significantly as increasing elastomer contents in PLA/elastomer blends. This result suggests that PLA and elastomer are thermodynamically compatible as reported by others [4,7].
The result data from DSC was also supported by DMA analysis, Figure 1. The storage modulus of all the samples is almost constant at low temperature. At certain temperature, the storage modulus decreased sharply and then increased again until a new relative constant value. The depletion of PLA modulus around 50 qC represents the glass transition temperature (Tg) while the onset of the modulus increase
coincided with the onset of the cold crystallization [8].
effect at the addition of elastomer. There was a similar result between DSC and DMA analysis about the depression of cold crystallization temperature due to an increase of elastomer in blends.
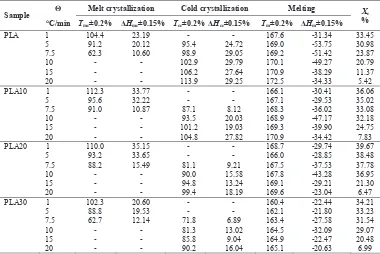
Table 1. Characteristics data of non isothermal scan for PLA and its blends
Sample Ĭ Melt crystallization Cold crystallization Melting Xc % qC/min Tmc±0.2% ǻHmc±0.15% Tcc±0.2% ǻHcc±0.15% Tm±0.2% ǻHm±0.15%
PLA 1 104.4 23.19 - - 167.6 -31.34 33.45
5 91.2 20.12 95.4 24.72 169.0 -53.75 30.98
7.5 62.3 10.60 98.9 29.05 169.2 -51.42 23.87
10 - - 102.9 29.79 170.1 -49.27 20.79
15 - - 106.2 27.64 170.9 -38.29 11.37
20 - - 113.9 29.25 172.5 -34.33 5.42
PLA10 1 112.3 33.77 - - 166.1 -30.41 36.06
5 95.6 32.22 - - 167.1 -29.53 35.02
7.5 91.0 10.87 87.1 8.12 168.3 -36.02 33.08
10 - - 93.5 20.03 168.9 -47.17 32.18
15 - - 101.2 19.03 169.3 -39.90 24.75
20 - - 104.8 27.82 170.9 -34.42 7.83
PLA20 1 110.0 35.15 - - 168.7 -29.74 39.67
5 93.2 33.65 - - 166.0 -28.85 38.48
7.5 88.2 15.49 81.1 9.21 167.5 -37.53 37.78
10 - - 90.0 15.58 167.8 -43.28 36.95
15 - - 94.8 13.24 169.1 -29.21 21.30
20 - - 99.4 18.19 169.6 -23.04 6.47
PLA30 1 102.3 20.60 - - 160.4 -22.44 34.21
5 88.8 19.53 - - 162.1 -21.80 33.23
7.5 62.7 12.14 71.8 6.89 163.4 -27.58 31.54
10 - - 81.3 13.02 164.5 -32.09 29.07
15 - - 85.8 9.04 164.9 -22.47 20.48
20 - - 90.2 16.04 165.1 -20.63 6.99
Ĭ = heating/cooling rate (oC/min); Xc = degree of crystallinity (%); ǻH = melting enthalpy (J/mol)
Fig. 1. Dynamic storage modulus of PLA and its blends as a function of temperature
formed PLA crystals in blends could be also responsible for the decrease of crystallinity [6]. This result was also found in XRD scans as presented in Figure 2.
Fig. 2. Typical XRD scans of neat PLA and its blends
The degree of crystallinity calculated from DSC with normal ramp (10 qC/min) and XRD showed the different values, although it has same tendency. The values of crystallinity calculated from XRD were always higher that those calculated from DSC, Table 2. This phenomenon occurred due to difference scanned areas of the same sample [2]. XRD diffractograms just scanned the sample surface, while the DSC evaluated the bulk crystallinity. Therefore, the crystallinity values of XRD scan were strongly influenced by injection molding. It provoked morphology of surface and shear zones, thus leading to higher crystallinity, as a result of the orientation.
Table 2. The crystallinity of PLA obtained from both DSC and XRD scans
No
Sample Degree of crystallinity, Xc (%) DSC(10 oC/min)
XRD
1
PLA 20.79 24.35
2
PLA10 32.18 36.21
3
PLA20 36.95 40.54
4
PLA30 29.07 31.14
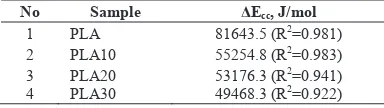
Cold crystallization activation energy (ǻEcc). Kissinger’s equation was the most widely used model to
calculate this energy by considering the effect of the various heating rate in the non isothermal cold crystallization. Table 3 shows the presence of elastomer in blends tends to decrease the activation energy. Due to the low ǻE value exhibits the high crystallization ability [11]. It could be concluded that elastomer may give an extra movement ability of chain segments, thereby making it easier for crystallization.
Table 3. Calculation data of ǻEcc by Kissinger’s equation
Non isothermal cold crystallization kinetic. The kinetic of cold crystallization can be explained by making relationship between fractional crystallinity versus crystallization time. Quantification of non-isothermal crystallization rate could be proposed by half time of crystallization. The half time crystallization (t1/2) was obtained directly by tracing the fractional crystallinity of 0.5 to required time and
tabulated in Table 4. The crystallization time becomes longer as decreasing the heating rate. It indicated that the lower heating rate promoted crystallization by given an appropriate crystallization time and were proved that higher crystallinity can be obtained in lower heating rate, Table 1. However, crystallization rate was also lower than that of higher heating rate. The same tendency was also obtained for PLA/elastomer blends.
Table 4. The half time crystallization (t1/2) at different heating rate
Sample Half time crystallization (t1/2), minutes 7.5 qC/min 10 qC/min 15 qC/min 20 qC/min
PLA 1.56 1.13 0.86 0.76
PLA10 2.01 1.45 1.02 0.84 PLA20 1.71 1.24 0.93 0.75 PLA30 1.22 1.03 0.85 0.68
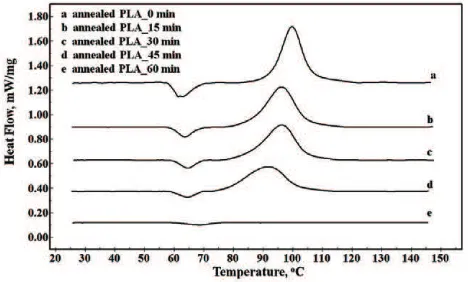
Effect of annealing on cold crystallization. Annealing is a thermal treatment process at higher temperature than glass temperature transition (Tg). It was intended to recovery of crystals that were lost
during injection molding process. Figure 3 shows the different annealing time of PLA at 80 qC. Clearly, the longer annealing time decreased gradually the enthalpy of cold crystallization ('Hcc). The cold
crystallization peak did not appear at annealing time of 1 h. It meant that rearranging of crystalline structure of PLA would be completed after one hour at 80 qC.
Fig. 3. The heating DSC scans (10 qC/min) of neat PLA with various annealing time at 80 qC
3.2. Isothermal scan
Evaluation of isothermal cold crystallization kinetic was presented in Figure 4a. At fractional crystallinity of 0.9, the cold crystallization rate decreased significantly. In this condition, the crystallite collision might detain the crystal growth. The different Tcc did not change the cold crystallization
of t1/2 at the same Tcc. It meant that elastomer may act as diluent which enhancing the crystallization rate
of PLA [10]. Besides that, elastomer shifted down the crystallization peak to the lower temperature.
Fig. 4. Isothermal cold crystallization of PLA at different temperature: (a) fractional crystallinity vs. time and (b) Avrami plots
The Avrami model shows the powerful model (R2 = 0.99) to describe an isothermal crystallization kinetic by assuming a constant growth and nucleation rate in random nucleation, Figure 4b. There were two stages of cold crystallization of poly(lactic acid) and its blends. It was clearly visible when lower temperature was employed during isothermal cold crystallization.
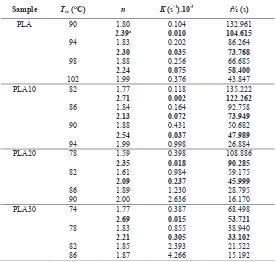
Table 5. Kinetics parameters obtained from isothermal cold crystallization experiments and Avrami analysis
Sample Tcc (qC) n K (s-1).10-3 t½ (s)
PLA 90 1.80 0.104 132.961
2.39a 0.010 104.615
94 1.83 0.202 86.264
2.30 0.035 73.768
98 1.88 0.256 66.685
2.24 0.075 58.400
102 1.99 0.376 43.847
PLA10 82 1.77 0.118 135.222
2.71 0.002 122.262
86 1.84 0.164 92.758
2.13 0.072 73.949
90 1.88 0.431 50.682
2.54 0.037 47.989
94 1.99 0.998 26.884
PLA20 78 1.59 0.398 108.886
2.35 0.018 90.285
82 1.61 0.984 59.175
2.09 0.237 45.999
86 1.89 1.230 28.795
90 2.00 2.636 16.170
PLA30 74 1.77 0.387 68.498
2.69 0.015 53.721
78 1.83 0.855 38.940
2.21 0.305 33.102
82 1.85 2.393 21.522
86 1.87 4.266 15.192
The Avrami exponent (n) at first stage was varying from 1.59 to 2 which described a one-dimensional crystallization growth with homogeneous nucleation, whereas at second stage was varying from 2.09 to 2.71 which described the transitional mechanism to three dimensional crystallization growth with heterogeneous nucleation mechanism [11]. The first and second stage referred to primary and secondary crystallization stage. The n value of PLA and PLA/elastomer blends at the same temperature are almost same. Indicating the presence of elastomer did almost not influence the nucleation mechanism.
Considering the K value, crystallization rate of PLA could be enhanced by increasing cold crystallization temperature (Tcc) and introducing elastomer in PLA blends. Comparison the first and
second stage crystallization in lower temperature for each sample proved the previous statement. In the second stage, crystallization rate was detained by the present of crystallite collision. It was described by lower K value than that in the first stage.
4. Conclusion
There were two kind of crystallizations appeared in PLA during isothermal scanning, i.e. melt crystallization and cold crystallization. The appeared crystallization was only melt crystallization at low heating/cooling rate, indicating there was enough time to rearrange its crystalline structure. In other hand, the cold crystallization tended to appear at higher heating/cooling rate, indicating more amorphous structure was obtained. The presence of elastomer tended to increase the crystallinity of PLA at low composition as well as its cold crystallization kinetics during non-isothermal scan. The cold crystallization peaks shifted down to lower temperature which addressed by decreasing their activation energy. The enhancement of crystallization rate could be done by increasing heating/cooling rate. Thermal treatment through annealing completed after 1 h at 80 qC. Nucleation phenomenon of PLA was almost not influenced by presence of elastomer during isothermal mode. The higher crystallization rate could be obtained by increasing crystallization temperature and introducing elastomer in PLA blends.
Acknowledgement
Authors were grateful to Center of Excellence on Research of Engineering Material (CEREM) for its partial financial support and SABIC Polymer Research Center (SPRC) at King Saud University for providing their equipment to conduct these tests.
References
[1] Auras R., Harte B., Selke S., Macromol. Biosci. 2004; 4: 835-864.
[2] Carrasco F., Pagès P., Gámez-Pérez J., Santana O.O., Maspoch M.L., Polym. Degrad. Stability 2010; 95: 116-125. [3] Zhao Y., Qiu Z., Yan S., Yang W., Polym. Eng. Sci., (2011); 51: 1564-1573.
[4] Ali F., Chang Y.-W., Kang S.C., Yoon J.Y., Polym. Bull. 2009; 62: 91-98. [5] Rasal R.M., Janorkar A.V., Hirt D.E., Prog. Polym. Sci. 2010; 35: 338-356. [6] Zhang W., Chen L., Zhang Y., Polymer 2009; 50: 1311-1315.
[7] Zaman H., Song J., Park L.S., Kang I.K., Park S.Y., Kwak G., Park B.S., Yoon K.B., Polym. Bull. 2011; 67: 187-198. [8] Suryanegara L., Nakagaito A.N., Yano H., Compos. Sci. Technol. 2009; 69: 1187-1192.