Vol. 11, No. 3, May 2010, 261–276
ISSN 1466-0970 print/ISSN 1743-9590 online © 2010 Taylor & Francis
DOI: 10.1080/14660971003619560 http://www.informaworld.com
Classification of the teams in the Brazilian Soccer Championship by
probabilistic criteria composition
Annibal Parracho Sant’Anna, * Eduardo Uchoa Barboza and João Carlos Correia Baptista Soares de Mello
Department of Engenharia de Produção, Universidade Federal Fluminense, Niterói-RJ, Brazil Taylor and Francis
The essay discusses alternative rules for the classification of the teams in the Brazilian Soccer Championship. Three explanatory variables for the final classification are explored: the total number of goals scored and taken by each team and the results of their matches against each opponent. Two teams are placed in different classes only if their relative ranks according to a combination of these three criteria do not contradict the official ranks. The essay studies the rules for building the joint classification based on the probabilities of dominance according to these three criteria. Finally, it presents the results of the application of different rules to the data of 2006 and 2007.
Introduction
The Brazilian Football Confederation (CBF) employed during the 2007 season a championship framework applied for some decades in the European championships. The championship had two half-seasons, each formed by matches among all teams, without playoffs. The teams were ranked by the sum of points, counting three points for a victory and one for a tie. By the end of each season, four clubs at each end of the final official standings were selected for relegation and for promotion or indication for an international tournament.
This model, we argue, generates a long championship, with important decisions in matches of the last rounds, subject to the influence of lack of motivation of teams already relegated by then. In this context, the results of games played in different moments against a same third team, may determine relegation of a team that wins all games against another that is not relegated. Different aspects of this model, like the asymmetry in the valuation of wins and losses,1 or the two half-seasons round-robin framework,2 have been the object of extensive discussion.
In 2007, the Brazilian champion of 2005 was relegated to the second division through the result of a match in the last round. To obtain a higher number of points, another team, facing at home an opponent without any further motivation, had the decisive goal scored in the third attempt of a penalty kick. The two previous unsuc-cessful kicks were declared invalid due to foul moves of the goalkeeper detected by the referee. This is an evidence of the phenomenon of ‘home advantage’.3 Specifically, the contribution of the referees to home advantage is a well studied subject.4
The present essay proposes parallel classification rules designed to assure clearer cut points in the official ranking. With the addition of these rules, small differences in
the official number of points contradicted by the performance according to other crite-ria are erased. If the number of clubs to be relegated or, at the other end, selected for higher level tournaments, has to be fixed, playoff games between tied teams may be scheduled. Untying rules may also be based on rankings that take into account a larger series of results, like the CBF’s permanent ranking of clubs.
Three factors are considered to generate the alternative classifications: number of goals scored, number of goals taken and the balance of goals in the direct confronta-tion of each pair of teams. This last factor does not determine a relaconfronta-tion of order in the set of teams, because it lacks the transitive property. In fact, for any three teams, X, Y and Z, it is frequent that X beats Y in their direct confrontation, Y beats Z and Z beats X. But an approach based on pairwise comparison according to all factors allows for taking into account criteria without the transitive property.
Other factors are suggested in the relevant literature.5 They may be employed if a more precise representation is required. The criteria composition must then be formu-lated in such a way as to avoid that the increase in the number of factors might reduce excessively the number of resulting classes.
Different forms of composition are studied here. The composition algorithms employ, as scores for the joint ranking, probabilities of simultaneous preference according to the whole set of criteria or to at least one criterion.6 The determination of such probabilities may be done in different ways. If it is possible to assign weights to the criteria, weighted means may be employed. Alternatively, as will be done here, joint probabilities will be employed. The computation of these probabilities will be discussed in the next section while the peculiarities of the application of this approach to the classification of teams in a championship and the results of its application to the data of first and second divisions of the Brazilian Soccer Championships of 2006 and 2007 are discussed in the two following sections. In 2006, the above referred model of championship was applied for the first time simultaneously for the two divisions in Brazil.
Probabilistic criteria composition
The probabilistic composition enables to objectively combine the criteria in different ways. If it is possible to numerically evaluate preferences among the criteria, the pref-erence according to each criterion may be dealt conditionally on the choice of the criterion. But preferences among criteria are difficult to quantify. Probabilistic evalu-ation of the preferences allows for the combinevalu-ation of the criteria without the previous assignment of numerical weights to them. For instance, adopting an optimistic point of view, we may decide on the basis of the probability of preference according to at least one of the available criteria. Alternatively, we may use the probability of prefer-ence according to all the criteria together. Another possible choice is between basing the decision on the vector of probabilities of being the best choice among all or decid-ing, conservatively, on the basis of the probabilities of not being the worst.
case, it is distance to the frontier of worst performance that must count and a good performance according to one criterion only may be enough to satisfy the fans in the stands and justify the presence in the first division.
Another aspect that the probabilistic composition permits to objectively take into account is the possibility of dependence relations between the criteria. If correlation between criteria can be quantified, it may be introduced in the computation of joint probabilities. In cases which lack ways of direct evaluation, extreme instances of dependence may be assumed. To simplify, it might be taken as constant the correlation between the indicators of preference. But this hypothesis is unrealistic because, deal-ing with indicators, if the probability of the events indicated is high, it is low in its probability of further increase in such a way that the correlation coefficient must be small for indicators of events of high probability and, on the contrary, large for cators of events of low probability. In numerical terms, the covariance between indi-cators is a difference between a minuend bounded above by 1 and a subtrahend that is the product of the isolated probabilities; if these are large, the difference must be small.
Taking into account this inversion effect, the instance of extreme dependence that will be considered here assumes covariances proportional to the probabilities of unfavourable evaluations. Following this principle, the difference between the ence probability according to a pair of criteria together and the product of the prefer-ence probabilities according to each of them separately is proportional to the product of the probabilities of not being preferred according to each of them separately.
While the hypothesis of independence, by the other end, computing the joint prob-ability simply by the product of the probabilities of preference according to each crite-rion, results in small values, especially if there are many criteria, this hypothesis of covariance proportional to the rejection probabilities leads, as proven by Sant’Anna,7 to the highest possible value to the joint probability, given by the minimum of the preference probabilities according to the different criteria. It is interesting to notice that the composition by the minimum or the maximum constitutes the basis of the concepts of possibility and necessity of Fuzzy Logic.8
The composition by the minimum or by the maximum has the disadvantage of not taking into account the exact estimates of the probabilities of preference according to the majority of the criteria. Due to that, even if there are sound reasons to assume correlation, it is interesting to compute classifications by the products and their complements as well as the classifications by minima and maxima.
Strategies for joint evaluation of the teams
be somehow explained by its offensive and defensive abilities. Offensive power is naturally evaluated by the total of goals scored. Analogously, the total number of goals taken is a good evaluation of defensive capacity. Results of direct confrontation complete the information in these two attributes, by bringing under consideration aspects of the teams that affect their matches against each opponent. Playing at home, for instance,9 may differently influence games against more popular or unpopular opponents.
How to use the balance of direct confrontations? It is easy to see that it does not determine a transitive relation, so that it may not be represented by a cardinal vari-able in the domain of teams that might be employed, for instance, in a regression model. The exit taken here, instead of requiring of each criterion an evaluation for each team, employs the results of the pairwise comparisons of the teams according to the criterion. Factors like the result of direct confrontations can then be repre-sented by a variable in the domain of ordered pairs of teams, associating to the pair (X,Y) the difference between the number of goals scored by X and the number of goals scored by Y in the matches between these two teams during the championship. For factors like the total of goals scored or taken along the championship, to the pair of teams (X,Y) will be associated the difference between the total of X and the total of Y. Any other factor, like the number of attack moves or the time of ball posses-sion during the games,10 may similarly enter the analysis, whether on total or on individual basis.
In a previous analysis of the data of 2006, Sant’Anna et al. evaluated the effect of the addition of two other explanatory variables,11 total number of wins and total number of losses. Including such variables, which naturally present a higher correla-tion with the number of points earned, results in better fit. Nevertheless, the three variables employed in the present analysis are more suitable to the aim of providing relegation and promotion rules capable of keeping the teams motivated until the last round. In fact, the classification according to goals scored and taken and balances in direct confrontation may be changed by efforts of any team in moments when, by the other side, the number of wins or losses could not be explored in a last try to contradict the classification by points. Thus the probabilistic composition of these criteria makes every game important, even though changes resulting from a particular final game are difficult to happen.
Before combining the criteria, the distribution of probabilities of preference according to each criterion must be determined. To estimate these probabilities, it is here assumed a Pareto law, relating, to the positive value x of the difference between the teams X and Y, the probability pYX(x) = 1/(x+1)/(x+2) of preference of Y over X and the probability pXY(x) = 1 - pYX(x) of preference of X over Y. In the case of a tie, that means, of x = 0, the probability is pXY(0) = pYX(0) = 1/2 for each alternative.
The Pareto distribution has been chosen due to its form of slow decay. This prop-erty allows for giving more importance to higher differences than that allowed by distributions of lighter tails. With that, the compositions considered in the present case will assign less importance to direct confrontation balances, which present, in general, smaller values than the comparisons by the totals of goals, without the need of assign-ing weights to the criteria. This suitably fits the fact that the total values provide more stable information.
employs as global preference score the probability of being preferred according to all the criteria. That means, each team is evaluated by the probability of, when compared to each opponent, beating it on every criterion. Assuming independence, this score is the product of the probabilities of beating each opponent according to each criterion.
In a progressive and optimistic approach, the evaluation is based on the probability of, when compared to each opponent, beating it on at least one criterion. This proba-bility is evaluated, assuming independence, by the product, along all opponents, of the probabilities of the complements of the events of being beaten on every criterion. The probability of each of these last events is calculated, assuming independence again, by the product of the probabilities of being beaten according to each criterion.
The third classification examined takes into account the possibility of positive correlation. The global score is then given by the minimum of the probabilities of beating each opponent, this minimum evaluated along all the opponents and along all the criteria. With that, this score may be strongly affected by one isolated bad confrontation.
The fourth composition considered is hybrid. It consists of assuming, by one side, independence between criteria, and, on the other, correlation between the comparisons with different opponents. The probability of a team beating any opponent is given by the product of the probabilities of beating it according to each criterion. These proba-bilities of beating particular opponents are combined in a global score given by the minimum along the whole set of opponents.
Finally, a last score envisaging the upper frontier consists of assuming indepen-dence between comparisons with different opponents and depenindepen-dence between the criteria. In the present application, this hybrid alternative may be more realistic than the previous one, since random disturbances affecting the development of matches against the same opponent may affect simultaneously the three explanatory variables, while it is more conceivable that matches against different opponents become subject to independent disturbances. In this approach, the global score is the product, along the opponents, of the minimum of the probabilities of beating each opponent accord-ing to the different criteria.
Similarly, from the conservative point of view, five measures of inverted prefer-ence are considered. The first one is the product of the probabilities of being beaten by all the opponents according to all the criteria. The second is the product along the set of all opponents of the rest to one of the probabilities of beating such opponents according to every criterion. This second measure estimates, assuming indepen-dence, the probability of, when compared with each opponent, being beaten accord-ing to at least one criterion. The third is the maximum maximorum of the probabilities of being beaten. The first hybrid measure is the maximum, along the set of all opponents, of the products of the probabilities of being beaten according to the three criteria. A simple computation shows that this measure is also given, comple-mentarily, by the minimum, along all the opponents, of the probabilities of not being beaten by at least one criterion. Finally, the last global score is the product of the three minima of the probabilities of being beaten, varying the opponents while the criteria remain fixed.
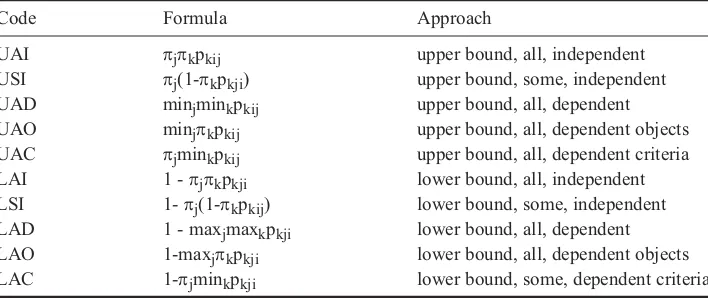
Formally, these measures are described in Table 1, where i denotes the team being evaluated, j varies along the set of all opponents, k varies along the set of criteria, pkij denotes the probability of preference for i against j according to k, π denotes the
Data analysis
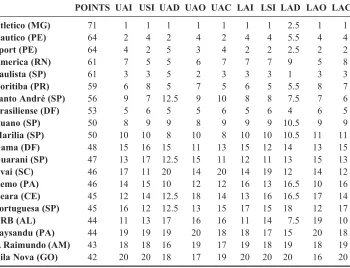
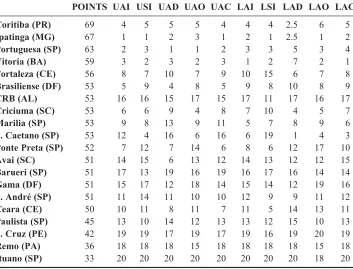
Tables 2 to 5 present, for the years of 2006 and 2007, the final official total of points of the teams in the 1st and the 2nd divisions of the Brazilin Soccer Championship as well as their ranks according to the above referred strategies of composition of the explanatory factors. The official total of points is obtained from the sum of three points per win and one point per tie. The values of the explanatory variables, extracted from CBF,12 are presented in the Appendices.
The strongest contradictions appear in Table 5, suggesting the existence of a higher homogeneity of the 20 teams in the 2nd division of 2007. A clear illustration Table 1. Probabilistic compositions.
Code Formula Approach
UAI πjπkpkij upper bound, all, independent
USI πj(1-πkpkji) upper bound, some, independent
UAD minjminkpkij upper bound, all, dependent
UAO minjπkpkij upper bound, all, dependent objects
UAC πjminkpkij upper bound, all, dependent criteria
LAI 1 - πjπkpkji lower bound, all, independent
LSI 1- πj(1-πkpkij) lower bound, some, independent
LAD 1 - maxjmaxkpkji lower bound, all, dependent
LAO 1-maxjπkpkji lower bound, all, dependent objects
LAC 1-πjminkpkji lower bound, some, dependent criteria
Table 2. 2006 First Division ranking.
POINTS UAI USI UAD UAO UAC LAI LSI LAD LAO LAC
S. Paulo (SP) 78 1 1 1 1 1 1 1 1 1 1
Internacional (RS) 69 5 4 5 3 5 4 3 2.5 3 4
Gremio (RS) 67 3 5 3 4 3 3 2 5.5 5 3
Santos (SP) 64 2 2 2 2 2 2 4 2.5 2 2
Parana (PR) 60 9 7 8 8 8 8 6 9.5 6 9
Vasco (RJ) 59 8 9 9.5 12 7 9 9 11.5 16 8
Figueirense (SC) 57 7 3 5 5 9 6 11 4 4 6
Goias (GO) 55 4 6 7 6.5 4 5 5 9.5 9 5
Corinthians (SP) 53 6 13 13 9 15 7 14 5.5 11 13
Cruzeiro (MG) 53 13 10 5 14 6 14 8 7 10 10
Flamengo (RJ) 52 12 14 11.5 11 11 12 12 8 14 14
Botafogo (RJ) 51 10 12 9.5 13 10 11 7 11.5 15 12
Atletico (PR) 48 11 8 16.5 6.5 12 10 10 13 8 7
Juventude (RS) 47 16 16 11.5 19 13 16 15 15 19 16
Fluminense (RJ) 45 15 15 14 15 14 15 13 17 13 15
Palmeiras (SP) 44 14 11 19 10 19 13 17 16 7 11
Ponte Preta (SP) 39 18 19 18 18 17 18 16 19 18 18
Fortaleza (CE) 38 19 18 16.5 16 18 19 19 18 17 19
S. Caetano (SP) 36 17 17 15 17 16 17 18 14 12 17
of how the risk of artificial cuts may be reduced by combining two classifications is shown by the contradictions between the ranks of S. Caetano in this table. Due to a small number of goals suffered, which is, among the attributes considered, that with the largest amplitude in the 2nd division of 2007, this team reaches the best position in the LAD composition, based on the maxima. Notwithstanding, due to its bad offen-sive performance, it is classified by various other compositions in the worst quartile, even reaching the second worst rank by LSI.
Another noticeable example is given by the contradiction between the official rank of CRB and its ranks in the alternative classifications, all of them much lower. This club had been classified among the four with fewer points in 2006 and was not relegated because an administrative development determined the relegation of Guarani instead. Another indication of the homogeneity of the 2nd division in 2007 is the relegation of Paulista. This team was close to promotion to the 1st division at the end of 2006. Even though its relegation in 2007 was by a difference of five points, it is better ranked than CRB and Avai by all the alternative classifications.
The analysis of the concordances between the classifications shows that, in general, whatever the form of composition and the frontier of reference chosen, it is easy to separate one team at the upper end, the champion, and another team at the lower end. So, in the 1st division, in 2007 as well as in 2006, all the classifications agree about the first and about the last ranked. In the 2nd division, in 2006, nine out of the ten aggregate measures agree with the official classification about the champion and six agree about the last one. Even in the 2nd division in 2007, whose homogeneity has been already commented above, although the variations reach the upper end, there is full agreement about the last position.
Table 3. 2006 Second Division ranking.
POINTS UAI USI UAD UAO UAC LAI LSI LAD LAO LAC
Atletico (MG) 71 1 1 1 1 1 1 1 2.5 1 1
Nautico (PE) 64 2 4 2 4 2 4 4 5.5 4 4
Sport (PE) 64 4 2 5 3 4 2 2 2.5 2 2
America (RN) 61 7 5 5 6 7 7 7 9 5 8
Paulista (SP) 61 3 3 5 2 3 3 3 1 3 3
Coritiba (PR) 59 6 8 5 7 5 6 5 5.5 8 7
Santo André (SP) 56 9 7 12.5 9 10 8 8 7.5 7 6
Brasiliense (DF) 53 5 6 5 5 6 5 6 4 6 5
Ituano (SP) 50 8 9 9 8 9 9 9 10.5 9 9
Marilia (SP) 50 10 10 8 10 8 10 10 10.5 11 11
Gama (DF) 48 15 16 15 11 13 15 12 14 13 15
Guarani (SP) 47 13 17 12.5 15 11 12 11 13 15 13
Avai (SC) 46 17 11 20 14 20 14 19 12 14 12
Remo (PA) 46 14 15 10 12 12 16 13 16.5 10 16
Ceara (CE) 45 12 14 12.5 18 14 13 16 16.5 17 14
Portuguesa (SP) 45 16 12 12.5 13 15 17 15 18 12 17
CRB (AL) 44 11 13 17 16 16 11 14 7.5 19 10
Paysandu (PA) 44 19 19 19 20 18 18 17 15 20 18
S. Raimundo (AM) 43 18 18 16 19 17 19 18 19 18 19
Table 4. 2007 First Division ranking.
POINTS UAI USI UAD UAO UAC LAI LSI LAD LAO LAC
S. Paulo (SP) 77 1 1 1 1 1 1 1 1 1 1
Santos (SP) 62 4 7 4.5 5 4 6 4 11 7 9
Flamengo (RJ) 61 6 10 8 4 6 10 6 13 8 11
Fluminense (RJ) 61 2 3 2 3 2 2 2 4 3 3
Cruzeiro (MG) 60 7 2 14.5 6 9 3 10 2 2 2
Gremio (RS) 58 14 9 7 17 14 11 15 7 15 8
Palmeiras (SP) 58 12 11 4.5 14 10 12 12 11 9 12
Atletico (MG) 55 5 4 10 2 5 4 5 5 4 4
Botafogo (RJ) 55 9 6 14.5 7 13 9 14 6 5 6
Atletico (PR) 54 10 14 9 11 8 14 13 15 11 14
Internacional (RS) 54 8 13 3 15 7 8 8 8 16 10
Vasco (RJ) 54 3 5 6 8 3 5 3 9 6 7
Figueirense (SC) 53 11 12 13 9 11 13 7 11 10 13
Sport (PE) 51 13 15 12 12 12 15 11 15 13 15
Nautico (PE) 49 15 8 17 10 15 7 9 3 12 5
Goias (GO) 45 17 17 16 16 16 17 16 17 17 17
Corinthians (SP) 44 16 16 11 13 17 16 18 15 14 16
Juventude (RS) 41 19 19 19 18 18 18 17 18 18 18
Parana (PR) 41 18 18 18 19 19 19 19 19 19 19
America (RN) 17 20 20 20 20 20 20 20 20 20 20
Table 5. 2007 Second Division ranking.
POINTS UAI USI UAD UAO UAC LAI LSI LAD LAO LAC
Coritiba (PR) 69 4 5 5 5 4 4 4 2.5 6 5
Ipatinga (MG) 67 1 1 2 3 1 2 1 2.5 1 2
Portuguesa (SP) 63 2 3 1 1 2 3 3 5 3 4
Vitoria (BA) 59 3 2 3 2 3 1 2 7 2 1
Fortaleza (CE) 56 8 7 10 7 9 10 15 6 7 8
Brasiliense (DF) 53 5 9 4 8 5 9 8 10 8 9
CRB (AL) 53 16 16 15 17 15 17 11 17 16 17
Criciuma (SC) 53 6 6 9 4 8 7 10 4 5 7
Marilia (SP) 53 9 8 13 9 11 5 7 8 9 6
S. Caetano (SP) 53 12 4 16 6 16 6 19 1 4 3
Ponte Preta (SP) 52 7 12 7 14 6 8 6 12 17 10
Avai (SC) 51 14 15 6 13 12 14 13 12 12 15
Barueri (SP) 51 17 13 19 16 19 16 17 16 14 14
Gama (DF) 51 15 17 12 18 14 15 14 12 19 16
S. André (SP) 51 11 14 11 10 10 12 9 9 11 12
Ceara (CE) 50 10 11 8 11 7 11 5 14 13 11
Paulista (SP) 45 13 10 14 12 13 13 12 15 10 13
S. Cruz (PE) 42 19 19 17 19 17 19 16 19 20 19
Remo (PA) 36 18 18 18 15 18 18 18 18 15 18
As a consequence of higher homogeneity of the teams in the middle of the tables, trying to identify extreme classes of larger size is much harder. Nevertheless, to confirm the upper class of size 4, only in the 1st division of 2007 there is difficulty with all the alternative measures. Five measures agree with the official classification in the 1st division in 2006 and four in the 2nd division in 2007. The 2nd division of 2006 presents a very interesting pattern on that matter, due to a tie in the number of points earned that required the application of a secondary untying criterion, the number of wins, to choose the 4th club selected for promotion to the 1st division. America and Paulista got the same total of points. While the larger number of wins determined promotion of America, all the alternative measures would place Paulista among the best four.
As for the other clubs promoted to the 1st division at the end of the 2006 season, there is no doubt. Besides agreeing with respect to the champion, all of them place its official runner-up and all but one place the third ranked in the official classification among the best four. Looking at the following season, we find that these three clubs delivered a pretty satisfactory performance in the 1st division of 2007, while America soon distanced from the others in the last position, its return to the 2nd division being early unavoidable. This seems to strengthen the case for a revision of the asymmetric valuation of wins and losses presently adopted in soccer rules.
At the lower end, eight measures agree with the official class of four teams in the 1st division of 2006, only one in the 2nd division, two in the 1st division of 2007 and none in the 2nd division. The concordances about relegation of three teams are, on the contrary, very high in every case. In the 1st division of 2007, the 10 measures agree. It is here interesting to notice that the 4th relegated was Corinthians, the champion of 2005. In general, the results obtained suggest that it would be sounder to select three clubs, instead of four, for promotion and for relegation.
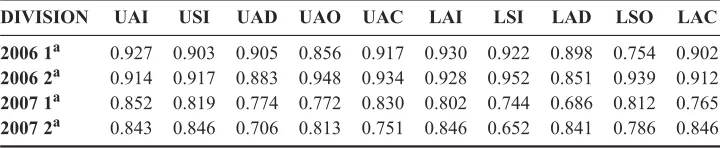
The analysis of Tables 2 to 5 reveals also that, with few exceptions, there is considerable agreement between the alternative classifications. That means that, once chosen as explanatory variables, the total number of goals scored and taken and the balance of goals in the direct confrontation, the form of composition does not much matter. This agreement is confirmed by the high correlations registered in Table 6. This table presents the ranks correlation (Spearman correlation coefficient) between the official classification and each of the 10 alternative vectors of scores, for both years and both divisions.
For the comparison between the hypotheses of independence and of maximal correlation, it is noticeable the proximity of the correlations in Table 6 related to classifications employing different hypotheses. This suggests that other intermediary assumptions would also lead to similar rankings. The vectors of scores derived from the hypothesis of independence presented a slightly higher correlation with the classi-fication by points than those involving dependence. But, even if the significance of
Table 6. Ranks correlations with the official classification.
DIVISION UAI USI UAD UAO UAC LAI LSI LAD LSO LAC
2006 1a
0.927 0.903 0.905 0.856 0.917 0.930 0.922 0.898 0.754 0.902
2006 2a
0.914 0.917 0.883 0.948 0.934 0.928 0.952 0.851 0.939 0.912
2007 1a
0.852 0.819 0.774 0.772 0.830 0.802 0.744 0.686 0.812 0.765
2007 2a
this difference is confirmed, such result might be related to the fact that the multipli-cative algorithm explores the exact numeric values of all differences, most of which are irrelevant for the computations involving maxima and minima.
As for the choice of one only alternative measure, a high correlation with the official classification is a good property, since it should generate more cutting points. Table 6 shows that the composition that is closer to the classification by points is UAI, which is also among those of easier interpretation. But, the correlations are close, in such a way that in different groups other measures present the highest value. For instance, in the 1st division of 2007, that highest value is of UAI, which in the 1st division of 2006 presents also a correlation very close to the highest, which is that of LAI. In the 2nd division of 2007, where are more divergences, five classifications present very close results: UAI, LAI, USI, LAD and LAC. Finally, in the 2nd division of 2006, the highest correlations with the official classification are those of UAO and LSI.
Among the six measures assuming dependence, those assuming dependence only between the criteria seem to present higher correlation with the official classification than the other four. These measures have an advantage of simplifying computation and interpretation, mainly if a large number of criteria are to be taken into account. Given the small variations, this concern with simplicity of computation may turn even UAD and LAD best choices.
Counting on a variety of measures slightly different from each other, a strategy to keep all teams motivated until the end of the championship may consist of holding the determination of the measure to be applied until the last round. This may be done by establishing that such measure will be chosen among those in a list by applying a pre-assigned rule. For instance, the alternative classification to be applied maybe that generating a vector of scores with the highest Spearman correlation coefficient with the Final Official Ranking. The results here obtained indicate, however, that such a complex rule is in fact unnecessary. To assure that the final decision will not be antic-ipated it is enough to apply a combination of a few relevant attributes, as any of those above studied.
Finally, to assure the highest importance of the last matches for both teams, it may also be advisable to base the rules applied to relegation on composition approaches different from those of the rules applied for promotion. For instance, to keep the teams in good standings motivated until the end, their composition approach would be referred to the frontier of best performances while the approach in the rules applied for relegation would involve probabilities of not being the worst.
Final comments
This work developed and tested alternative approaches to compose classification decision rules that may enable more soundly founded decisions on promotion and relegation of clubs by the end of a soccer season. These approaches can be applied in the same way to other sports and to different kinds of selection strategies based on ranking. The different forms of composition studied were found to be able to approx-imate the classification on points, allowing for the determination of clear cutting points for relegation and promotion.
A last comment may be interesting to add. Since the win in a soccer match is ordi-narily determined by a very small difference of goals scored, errors of the referees may be more important in soccer than in other sports. These errors may become systematic as the influence of attendance pressures, tradition of a club, press evalua-tions and other factors not related to the performance of the teams playing may affect the instantaneous and hardly revocable decisions of the referees. By the end of a long championship, discrepancies between classifications based on wins and losses and classifications by technical attributes that should determine such wins and losses may sign the presence of such extra-field influences.
The biggest discrepancy observed in the classifications analysed here is between Flamengo and Vasco in 2007. These two teams are ranked, respectively, third and tenth in the Final Official Standings, while the second is much better ranked than the other in all but one of the alternative classifications. They are two clubs of Rio de Janeiro, of strong rivalry. Flamengo has a much larger support of public and press and Vasco has a tradition of forming better teams that by the end of the season rarely reach compatible results.
Besides, in the last few years preceding 2007, the President of Vasco developed a violent animosity against the Brazilian sports press, which, for instance, after denouncing irregularities in the election in 2006 when he was re-elected as President, created for him the epithet of Interim President. This may explain the bad practical rank of the team. On the other side, Flamengo counted on a powerful favourable mobi-lization that resulted in successive records of attendance in its home games. Many of these games ended in epic and sometimes surprising victories.
Notes
1.Bloyce and Murphy, ‘Sports Administration’. 2.Courneya and Carron, ‘The Home Advantage’.
3.Smith, ‘The Home Advantage’; Thomas, Reeves and Davies, ‘An Analysis’; Page and Page, ‘The Second Leg’; Jacklin, ‘Temporal Changes’; Pollard, ‘Worldwide Regional Variations’. 4.Groot, ‘Referees’; Boyko, Boyco and Boyco, ‘Referee Bias’; Dawson et al., ‘Are Football
Referees?’; Downward and Jones, ‘Effects of Crowd Size’.
5.Carmichael, Thomas and Ward, ‘Team Performance’; Hoffman, Lee and Ramasamy,
‘The Socioeconomic Determinants’; Haas, ‘Productive Efficiency’; Barros and Leach, ‘Performance Evaluation’; Goddard, ‘Who Wins the Football?’
6.Sant’Anna, ‘Data Envelopment Analysis’. 7.Sant’Anna, ‘Probabilistic Majority Rules’.
8.Zadeh, ‘Fuzzy Sets’, and Zadeh, ‘Fuzzy Sets as the Basis’.
9.Leifer, ‘Perverse Effects’; Madrigal and James, ‘Team Quality’; Nevill, Balmer and Williams, ‘The Influence of Crowd Noise’.
10.Espidia-Escuer and Garcia-Cebian, ‘Measuring the Efficiency’.
11.Sant’Anna, Uchoa Barboza and Soares de Mello, ‘A Framework’, 180–5.
12.CBF, Site dos Campeonatos Brasileiros das series A, B e C, 2007. http://200.159.15.35/ seriea/Table.aspx.
References
Barros, C.P., and S. Leach. ‘Performance Evaluation of the English Premier Football League with Data Envelopment Analysis’. Applied Economics 38 (2006): 1449–58.
Bloyce, D., and P. Murphy. ‘Sports Administration on the Hoof: The Three Points for a Win “Experiment” in English Soccer’. Soccer and Society 9, no. 1 (2008): 95–113.
Carmichael, F., D. Thomas, and R. Ward. ‘Team Performance: The Case of English Premiership Football’. Managerial and Decision Economics 21 (2000): 31–45.
Courneya, K.S., and A.V. Carron. ‘The Home Advantage in Sport Competitions: A Literature Review’. Journal of Sport & Exercise Psychology 14 (1992): 13–27.
Dawson, P., S. Dobson, J. Goddard, and J. Wilson. ‘Are Football Referees Really Biased and Inconsistent? Evidence on the Incidence of Disciplinary Sanction in the English Premier League’. Journal of the Royal Statistical Society. Series A 170 (2007): 231–50.
Downward, P., and M. Jones. ‘Effects of Crowd Size on Referee Decisions: Analysis of the FA Cup’. Journal of Sports Sciences 25 (2007): 1541–5.
Espidia-Escuer, M., and L.I. Garcia-Cebian ‘Measuring the Efficiency of Spanish First-Division Soccer Teams’. Journal of Sports Economics 5 (2004): 329–46.
Goddard, J. ‘Who Wins the Football?’ Significance 3 (2006): 16–19.
Groot, L. ‘Referees Smong Most Important Players in Soccer Tournaments’. Journal of Sport and Social Issues 29 (2005): 437–42.
Haas, D.J. ‘Productive Efficiency of English Football Teams – A Data Envelopment Analysis Approach’. Managerial and Decision Economics 24 (2003): 403–10.
Hoffman, R., C.G. Lee, and B. Ramasamy. ‘The Socioeconomic Determinants of International Soccer Performance’. Journal of Applied Economics 5 (2002): 253–72.
Jacklin, P.B. ‘Temporal Changes in Home Advantage in English Football since the Second World War: What Explains Improved Away Performance?’ Journal of Sports Sciences 23 (2005): 669–79.
Leifer, E.E. ‘Perverse Effects of Social Support: Publics and Performance in Major League sports’. Social Forces 74 (1995): 81–118.
Madrigal, R., and J. James. ‘Team Quality and the Home Advantage’. Journal of Sport Behaviour 22 (1999): 381–98.
Nevill, A.M., N.J. Balmer, and A. Mark Williams. ‘The Influence of Crowd Noise and Experience upon Referring Decisions in Football’. Psychology of Sport and Exercise 3 (2002): 261–72.
Page, L., and K. Page. ‘The Second Leg Home Advantage: Evidence from European Football Cup Competitions’. Journal of Sports Sciences 25 (2007): 1547–56.
Pollard, R. ‘Worldwide Regional Variations in Home Advantage in Association Football’. Journal of Sports Sciences 24 (2006): 231–40.
Sant’Anna, A.P. ‘Data Envelopment Analysis of Randomized Ranks’. Pesquisa Operacional 22 (2002): 203–15.
Sant’Anna, A.P. ‘Probabilistic Majority Rules: A New Approach to the Composition of Social Preferences’. International Journal of Industrial Systems Engineering 4 (2009): 32–45. Sant’Anna, A.P., E. Uchoa Barboza, and J.C.C.B. Soares de Mello. ‘A Framework to explain
the Brazilian Soccer Championship Classifications’. In Proceedings of the IMA Mathe-matics in Sports Conference, Salford, UK, 2007.
Smith, D.R. ‘The Home Advantage Revisited: Winning and Crowd Support in an Era of National Publics’. Journal of Sport and Social Issues 27 (2003): 346–71.
Thomas, S., C. Reeves, and S. Davies. ‘An Analysis of Home Advantage in the English Football Premiership’. Perceptual and Motor Skills 99 (2004): 1212–16.
Zadeh, L.A. ‘Fuzzy Sets’. Information and Control 8 (1965): 338–53.
Soc
ce
r &
Soc
ie
ty
273
PT GP GT Direct confrontation
Team A-M A-P Bot Cor Cru Fig Fla Flu Goi Gre Int Juv Nau Pal Par San S. P Spo Vas
America 17 24 80 −4 −1 −2 −2 −3 −3 −3 −3 −3 −6 −3 −6 −8 −2 2 −2 −4 0 −3
Atletico-MG 55 63 51 −1 −2 3 −3 2 −1 3 2 −1 0 4 2 1 2 −1 1 0 −3
Atletico-PR 54 51 50 0 0 0 3 0 −2 −2 2 0 4 −5 3 1 −3 −1 −1 0
Botafogo 55 62 58 0 2 0 0 −1 −3 0 1 2 −1 0 1 −4 −2 2 3
Corinthians 44 40 50 0 1 −1 0 1 1 −3 1 −4 −2 −1 2 1 −2 −3
Cruzeiro 60 73 58 −2 0 2 1 4 0 −2 3 7 −1 −4 −2 1 4
Figueirense 53 57 56 1 −2 0 2 −1 3 0 −2 5 −1 −2 −1 0
Flamengo 61 55 49 −1 4 1 −3 4 0 −3 0 −2 1 0 1
Fluminense 61 57 39 1 −2 6 1 1 −2 −2 5 1 5 0
Goias 45 49 62 −1 0 0 −1 0 1 −2 −2 −3 −4
Gremio 58 44 43 3 3 3 −2 −1 1 −3 −1 −2
Internacional 54 49 44 1 2 1 0 0 −2 4 −1
Juventude 41 43 65 −3 1 −3 −3 0 −2 3
Nautico 49 66 63 −2 2 0 −4 −1 −3
Palmeiras 58 48 47 2 0 −1 −3 1
Parana 41 42 64 −3 −7 −1 −3
Santos 62 57 47 −3 −1 −3
S. Paulo 77 55 19 3 4
Sport 51 54 55 −2
A
.P
. Sant
’ A
nna
et
a
l.
PT GP GT Direct confrontation
Team Bar Bra Cea Cor crb Cri For Ga Ipa Itu Ma Pau Pon Por Re Sat S.A S.C Vit
Avai 51 52 55 0 0 1 0 0 0 −2 −1 1 4 −1 3 −1 −2 −1 0 −2 1 −3
Barueri 51 57 71 0 0 −4 −4 −1 −1 −4 2 4 0 −6 1 −3 2 1 0 −2 1
Brasiliense 53 57 53 3 −2 −2 −1 −1 1 −2 1 1 1 1 0 −3 2 1 −1 5
Ceara 50 57 56 −2 5 0 −2 2 −1 4 0 1 3 1 −1 3 −4 −1 −3
Coritiba 69 54 41 0 −1 −2 −1 0 3 1 1 1 0 2 3 1 −1 −2
CRB 53 54 62 −1 0 −1 −4 3 −1 0 0 1 1 −3 1 −3 −2
Criciuma 53 51 44 0 5 1 3 0 −3 −3 −2 1 1 −2 0 2
Fortaleza 56 51 46 −3 0 1 3 0 −2 1 2 0 2 −2 −5
Gama 51 50 55 −5 2 −1 −2 −1 −3 2 1 −1 2 −1
Ipatinga 67 60 41 4 0 5 −2 2 2 0 1 2 −3
Ituano 33 41 74 −1 3 −1 −1 −1 −3 −3 1 2
Marilia 53 66 61 2 2 −3 3 0 3 3 −4
Paulista 45 58 61 0 0 1 −1 1 −3 4
Ponte Preta 52 58 55 −3 1 6 3 1 −7
Portuguesa 63 63 45 0 0 3 1 2
Remo 36 53 69 1 −2 −3 −1
Santa Cruz 42 47 65 −4 0 −3
Santo André 51 51 50 0 −1
S. Caetano 53 45 39 1
Soc
ce
r &
Soc
ie
ty
275
PT GP GT Direct confrontation
Team A-P Bot Cor Cru Fig Fla Flu For Goi Gre Int Juv Pal Par Pon Sat San S. P Vas
Atletico (PR) 48 61 62 −1 0 0 −3 0 0 1 −1 −3 −1 0 2 3 3 2 −1 1 0 1
Botafogo 51 52 50 −1 −1 0 −1 1 2 0 −4 −1 0 −3 4 2 3 1 1 −3 3
Corinthians 53 41 46 −1 −2 −5 1 −4 −3 −4 −1 2 0 2 0 0 1 2 −2 2
Cruzeiro 53 52 45 2 0 −2 2 1 1 1 0 1 −1 5 −3 −2 2 −2 0
Figueirense 57 52 44 −2 −1 0 −1 3 3 0 5 −1 −2 2 0 −2 1 −2
Flamengo 52 44 48 2 1 2 −2 −2 1 −1 −1 −3 −3 −3 3 −1 −1
Fluminense 45 48 58 1 −1 −1 −3 1 −3 0 −3 1 1 0 −2 0
Fortaleza 38 39 62 −3 −2 −4 3 −3 −2 3 −2 −2 1 1 −2
Goias 55 63 49 2 3 2 0 −2 2 1 −1 2 −3 2
Gremio 67 64 45 −1 2 2 −2 4 4 0 2 −1 −1
Internacional 69 52 36 −1 3 0 4 3 −1 1 0 −1
Juventude 47 44 54 1 2 −3 2 0 3 −5 0
Palmeiras 44 58 70 0 1 0 −5 0 −1 −1
Parana 60 56 49 4 5 −1 3 −1 −1
Ponte Preta 39 45 65 2 −1 −1 −2 −1
S. Cruz 28 41 76 −2 −5 −6 −3
Santos 64 58 36 1 3 −2
S. Caetano 36 37 53 −2 0
S. Paulo 78 66 32 4
A
.P
. Sant
’ A
nna
et
a
l.
PT GP GT Direct confrontation
Team Ame A-M Av Cea Cor crb Ga Gu Itu Ma Na Pau Pay Por Re S.A S.C S.R Vil
America 61 59 51 1 2 3 0 −4 −1 3 3 0 0 1 2 −2 −2 1 −2 1 0 2
Atletico-MG 71 70 39 1 0 4 2 6 1 3 0 2 −1 2 3 1 1 1 4 2 0
Avai 46 36 51 −2 −1 −3 −3 −1 1 2 2 −3 2 1 0 −1 −1 −1 −3 −1
Brasiliense 53 66 51 −1 5 2 −3 1 1 1 0 −1 3 0 2 4 2 −1 1
Ceara 45 47 56 2 0 2 −1 −3 0 −1 −6 2 1 0 0 0 −1 −2
Coritiba 59 64 51 1 1 −1 1 3 0 −1 3 3 2 −1 1 −2 4
CRB 44 61 67 −1 −1 0 −1 −2 −1 3 0 0 2 2 1 −3
Gama 48 52 62 −2 0 1 −3 −1 0 1 −1 −1 −1 −4 3
Guarani 47 53 61 0 −4 −3 1 0 3 −3 −1 2 −5 5
Ituano 50 49 48 1 −2 0 −1 1 5 −1 0 −2 1
Marilia 50 58 58 3 −3 0 2 0 1 0 0 0
Nautico 64 64 48 −1 0 1 2 2 4 −1 −2
Paulista 61 72 51 9 0 2 −1 −2 3 3
Paysandu 44 51 70 2 0 2 1 −3 0
Portuguesa 45 47 58 3 −1 −2 1 2
Remo 46 50 60 −3 2 0 2
Santo Andre 56 47 45 2 −1 2
S. Raimundo 43 42 59 −2 0
Sport 64 57 36 3